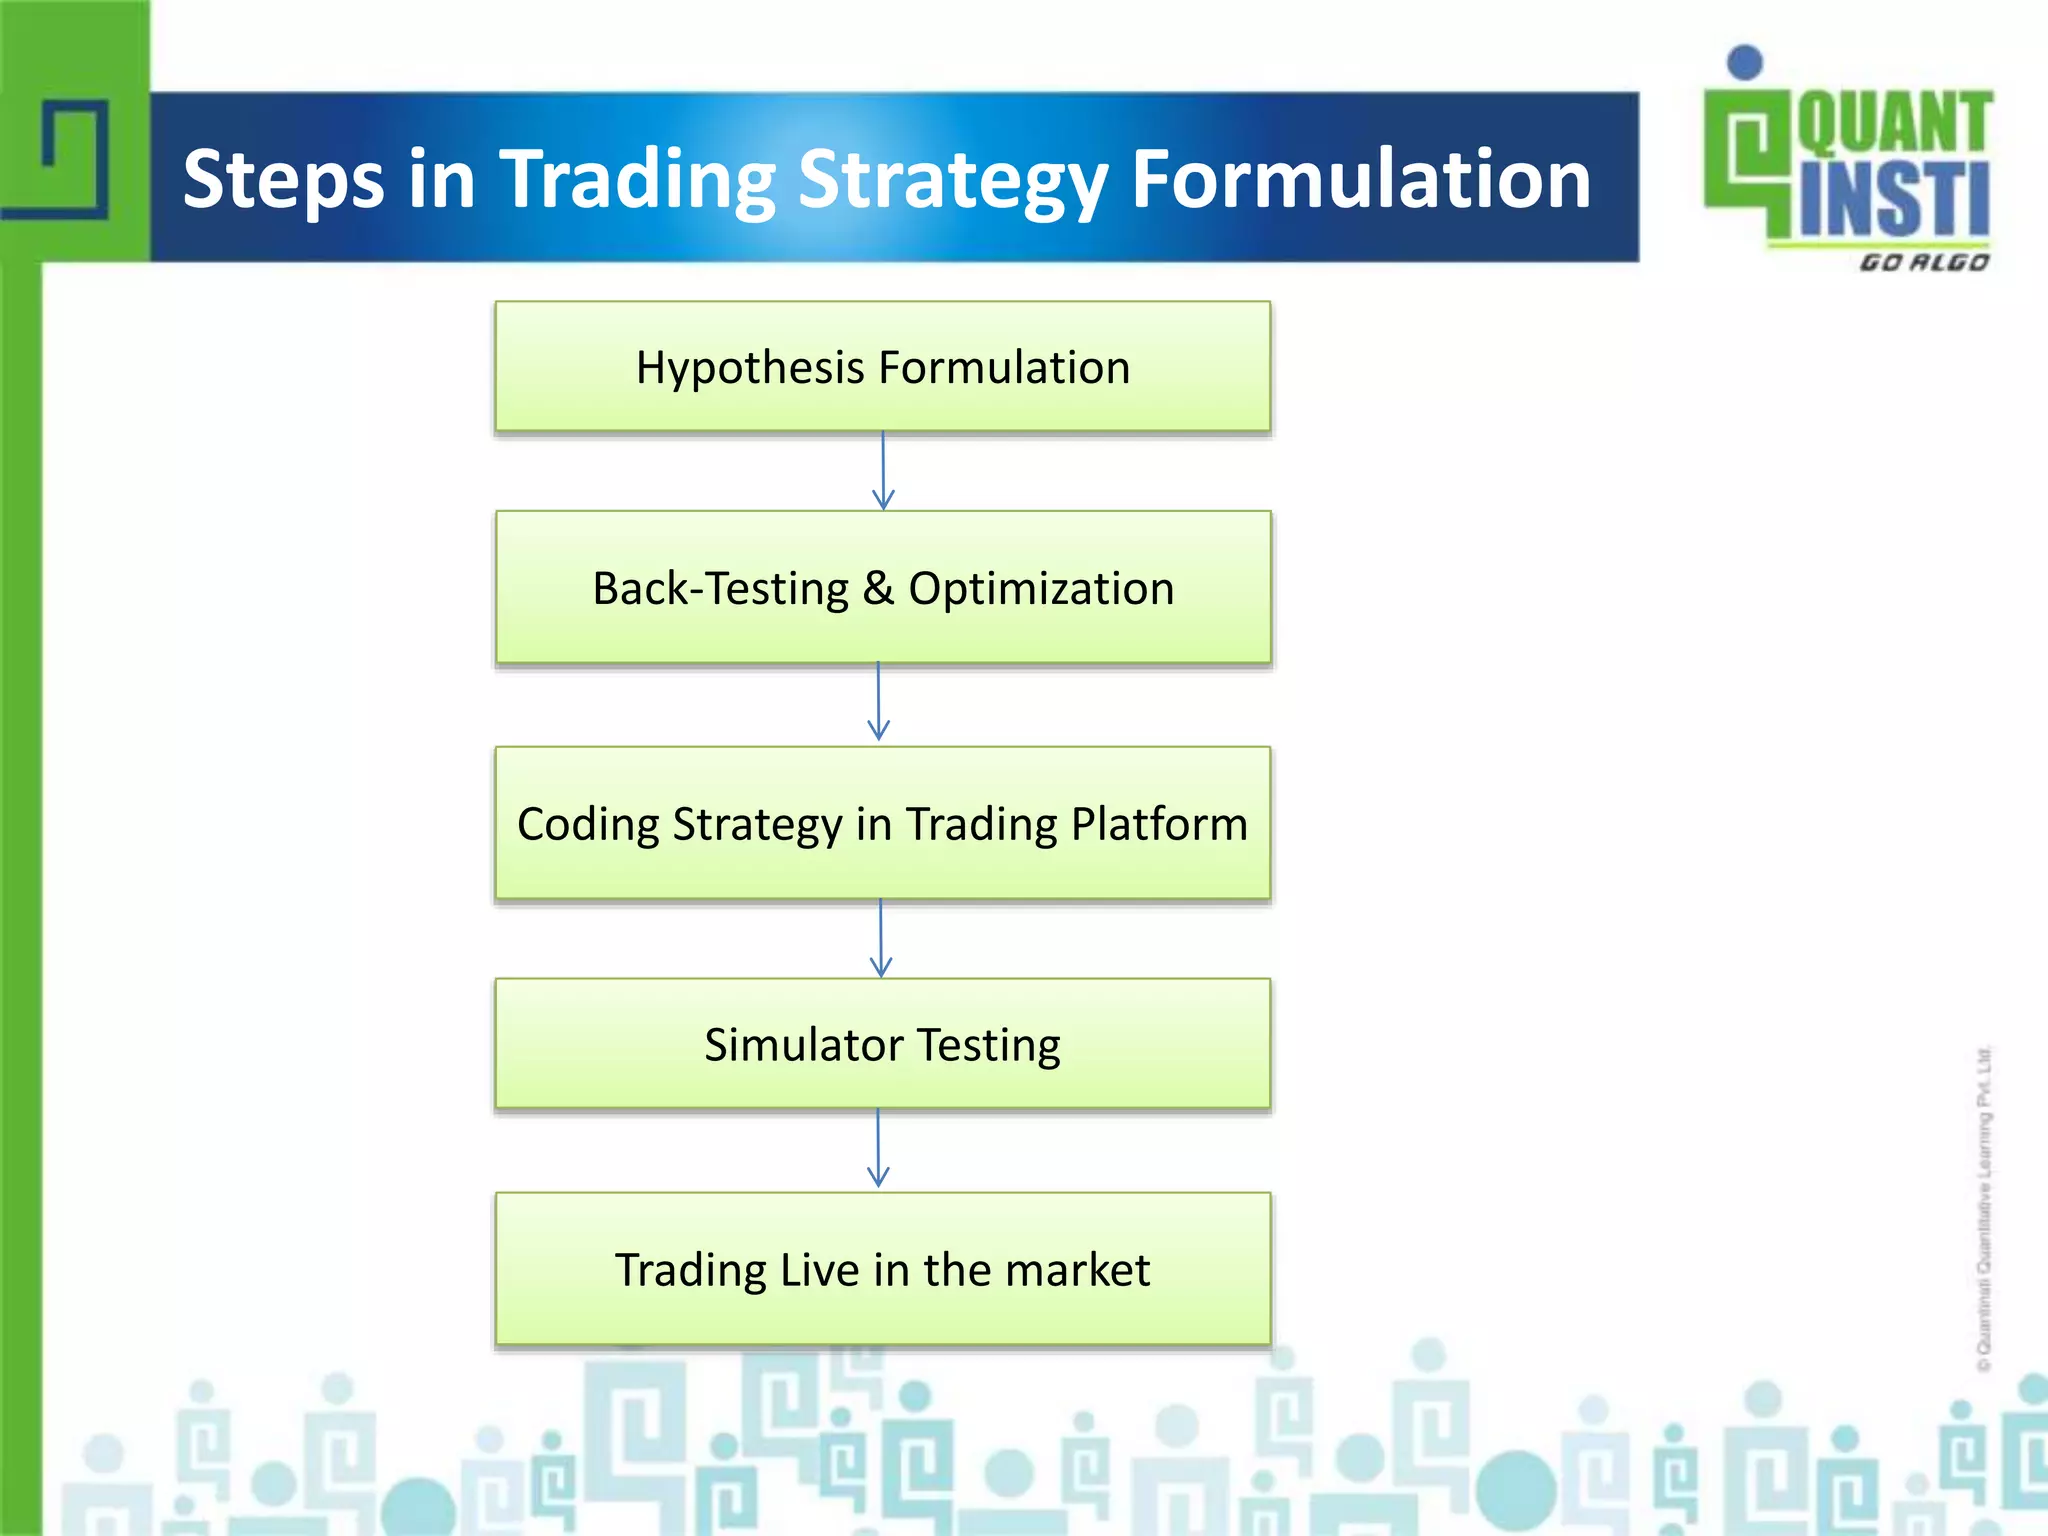
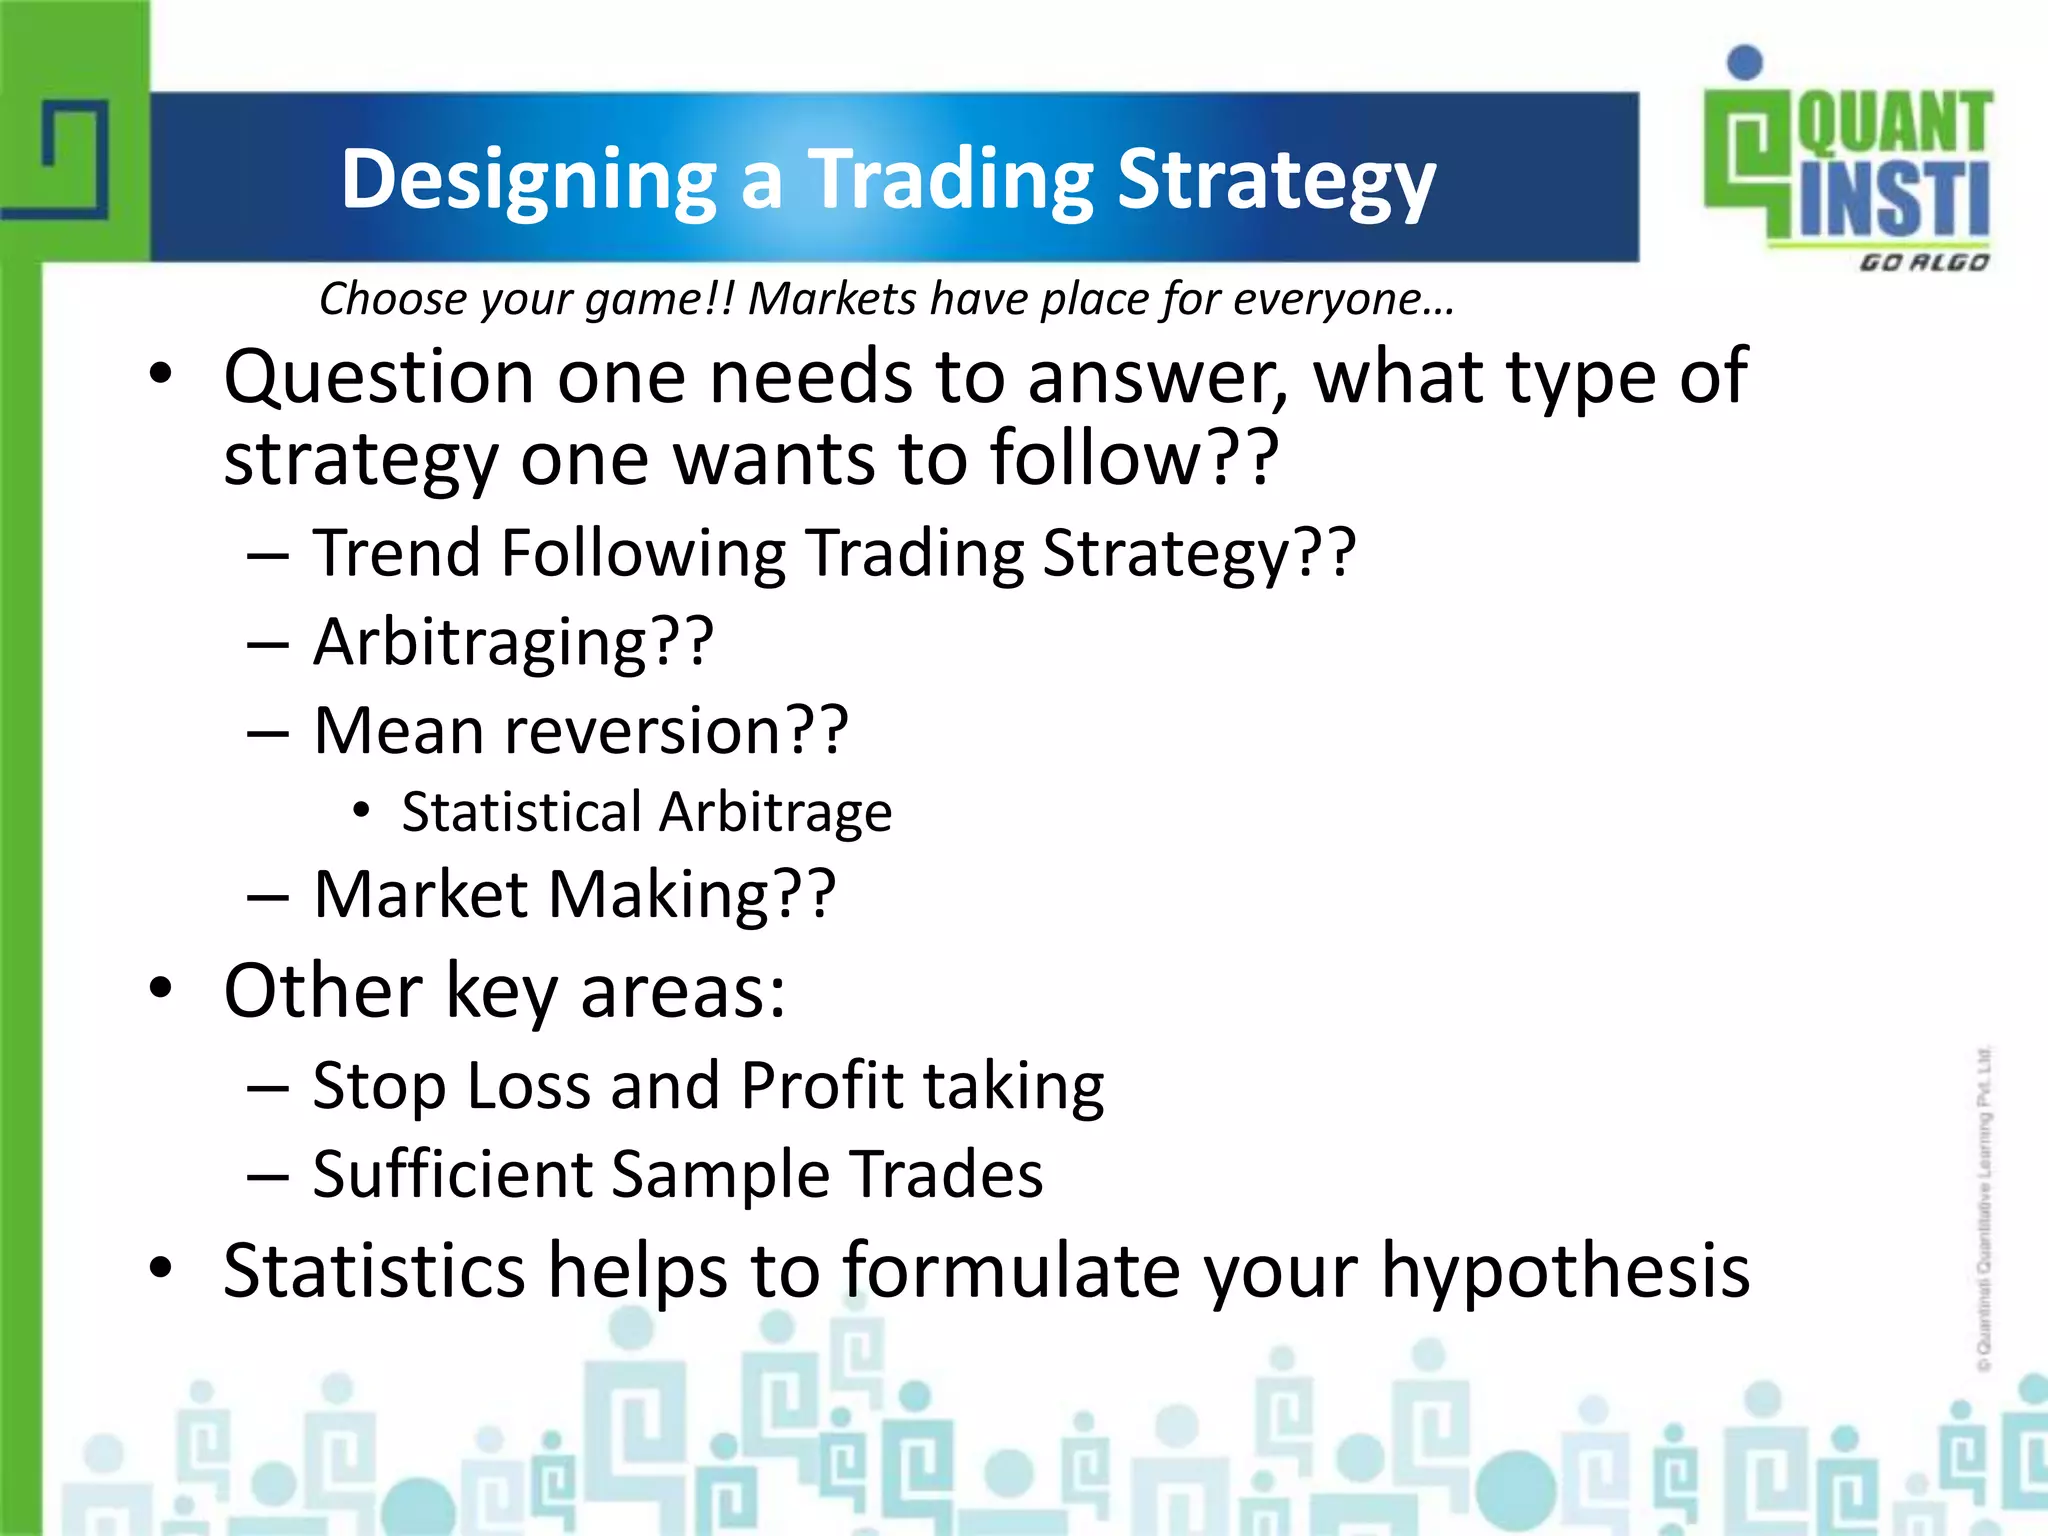
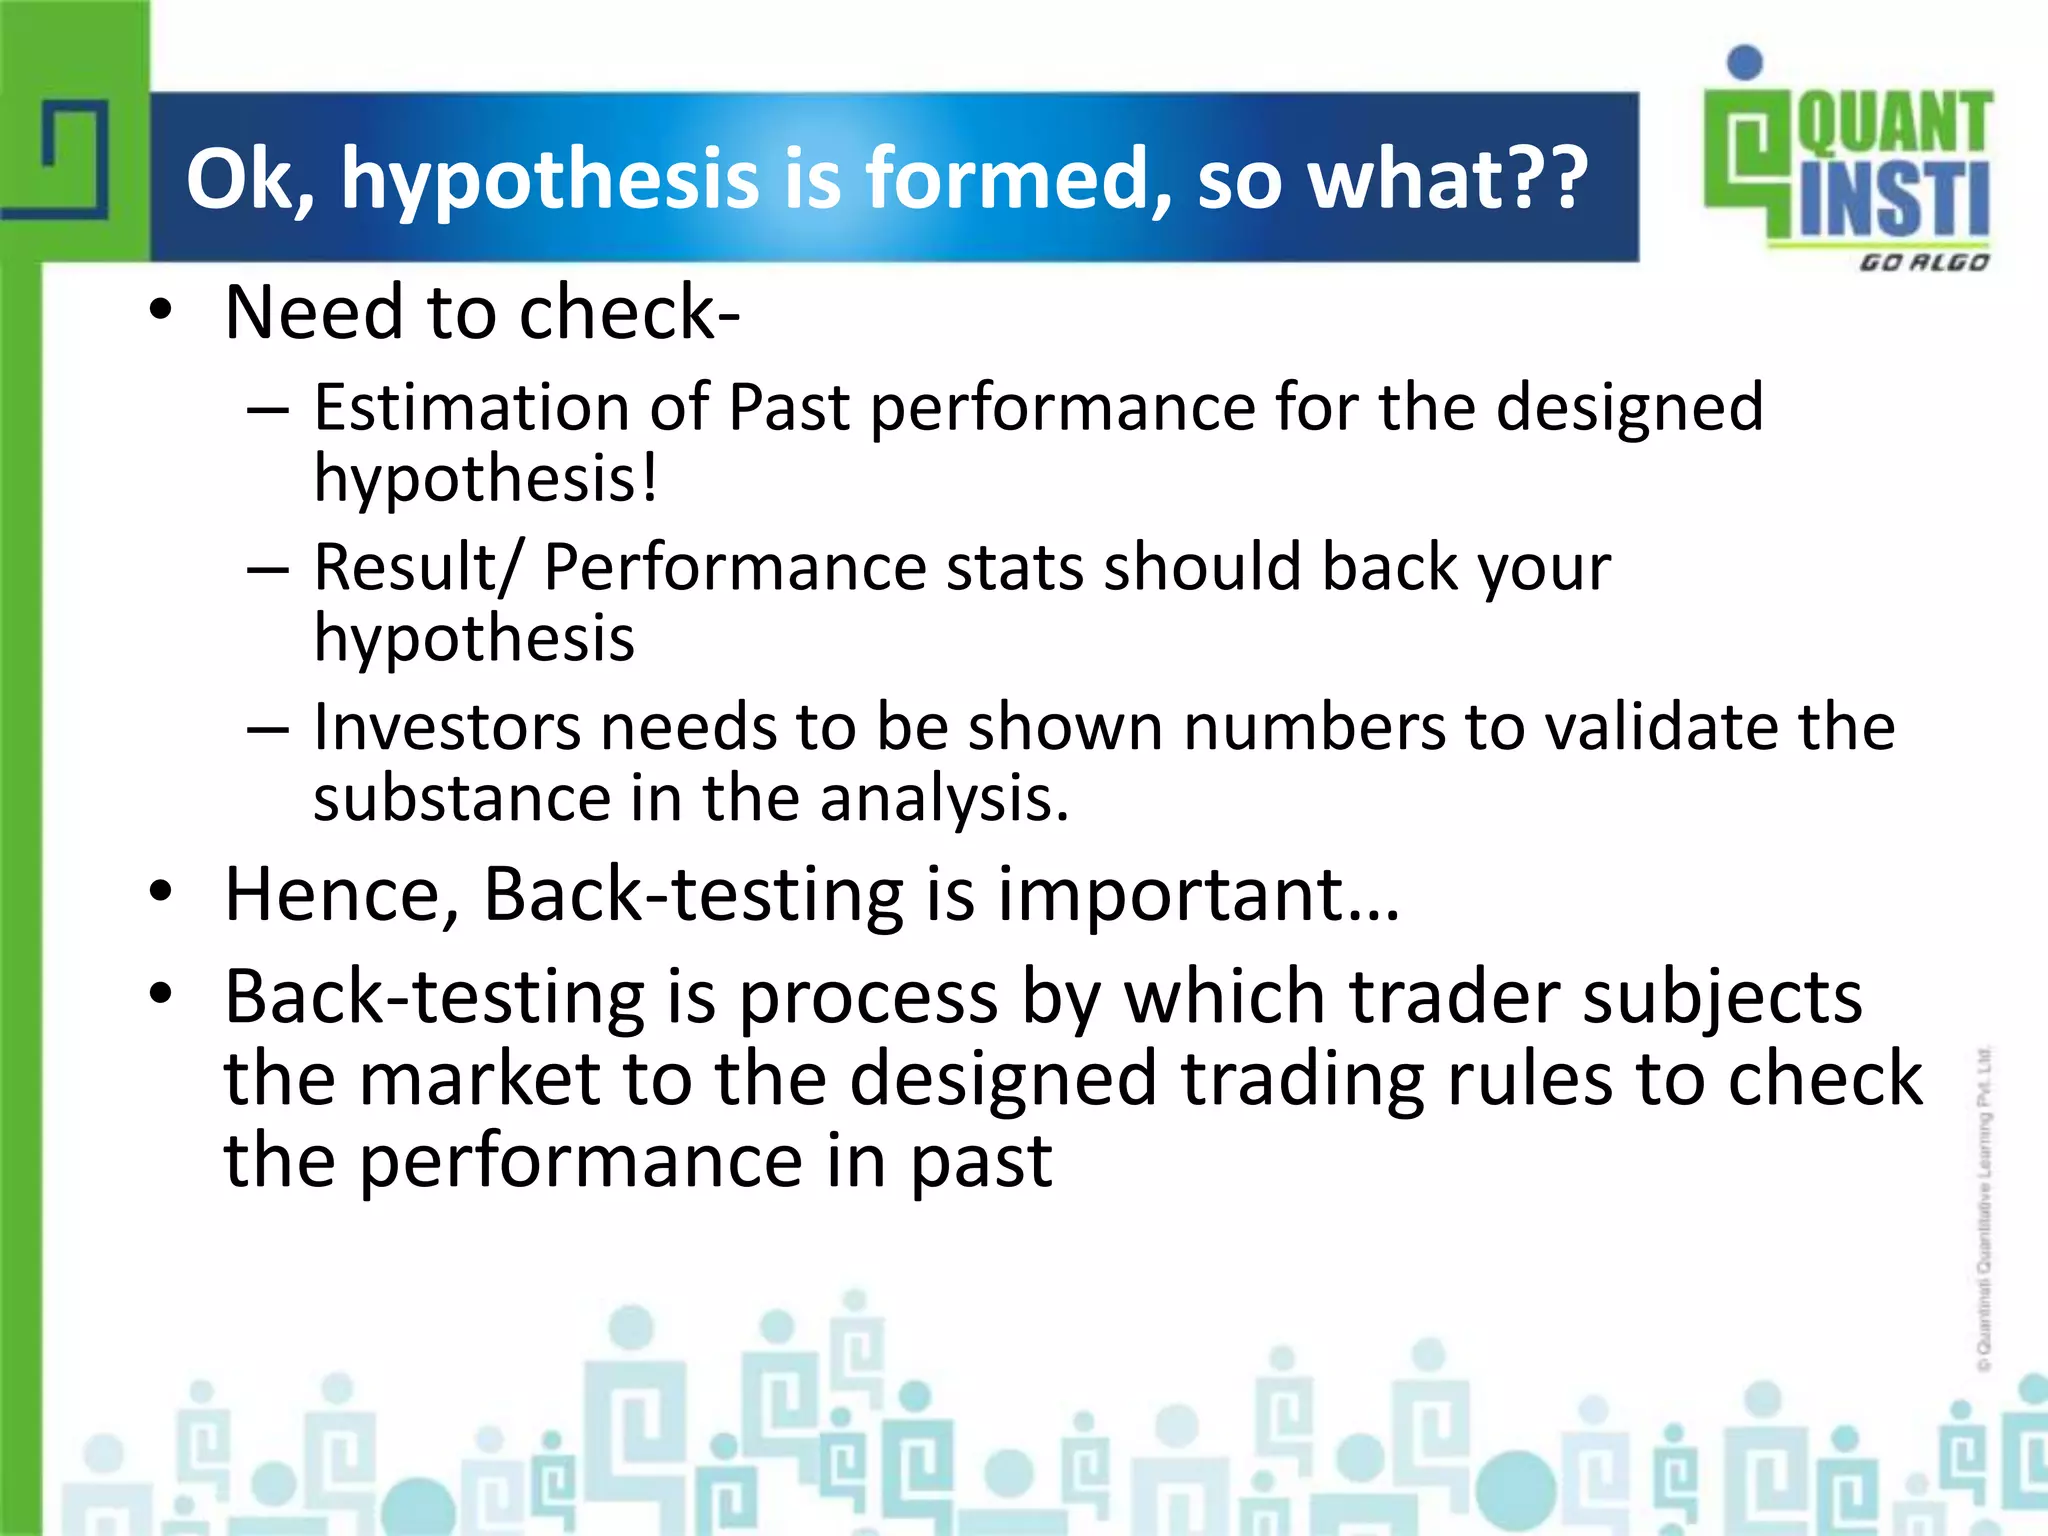
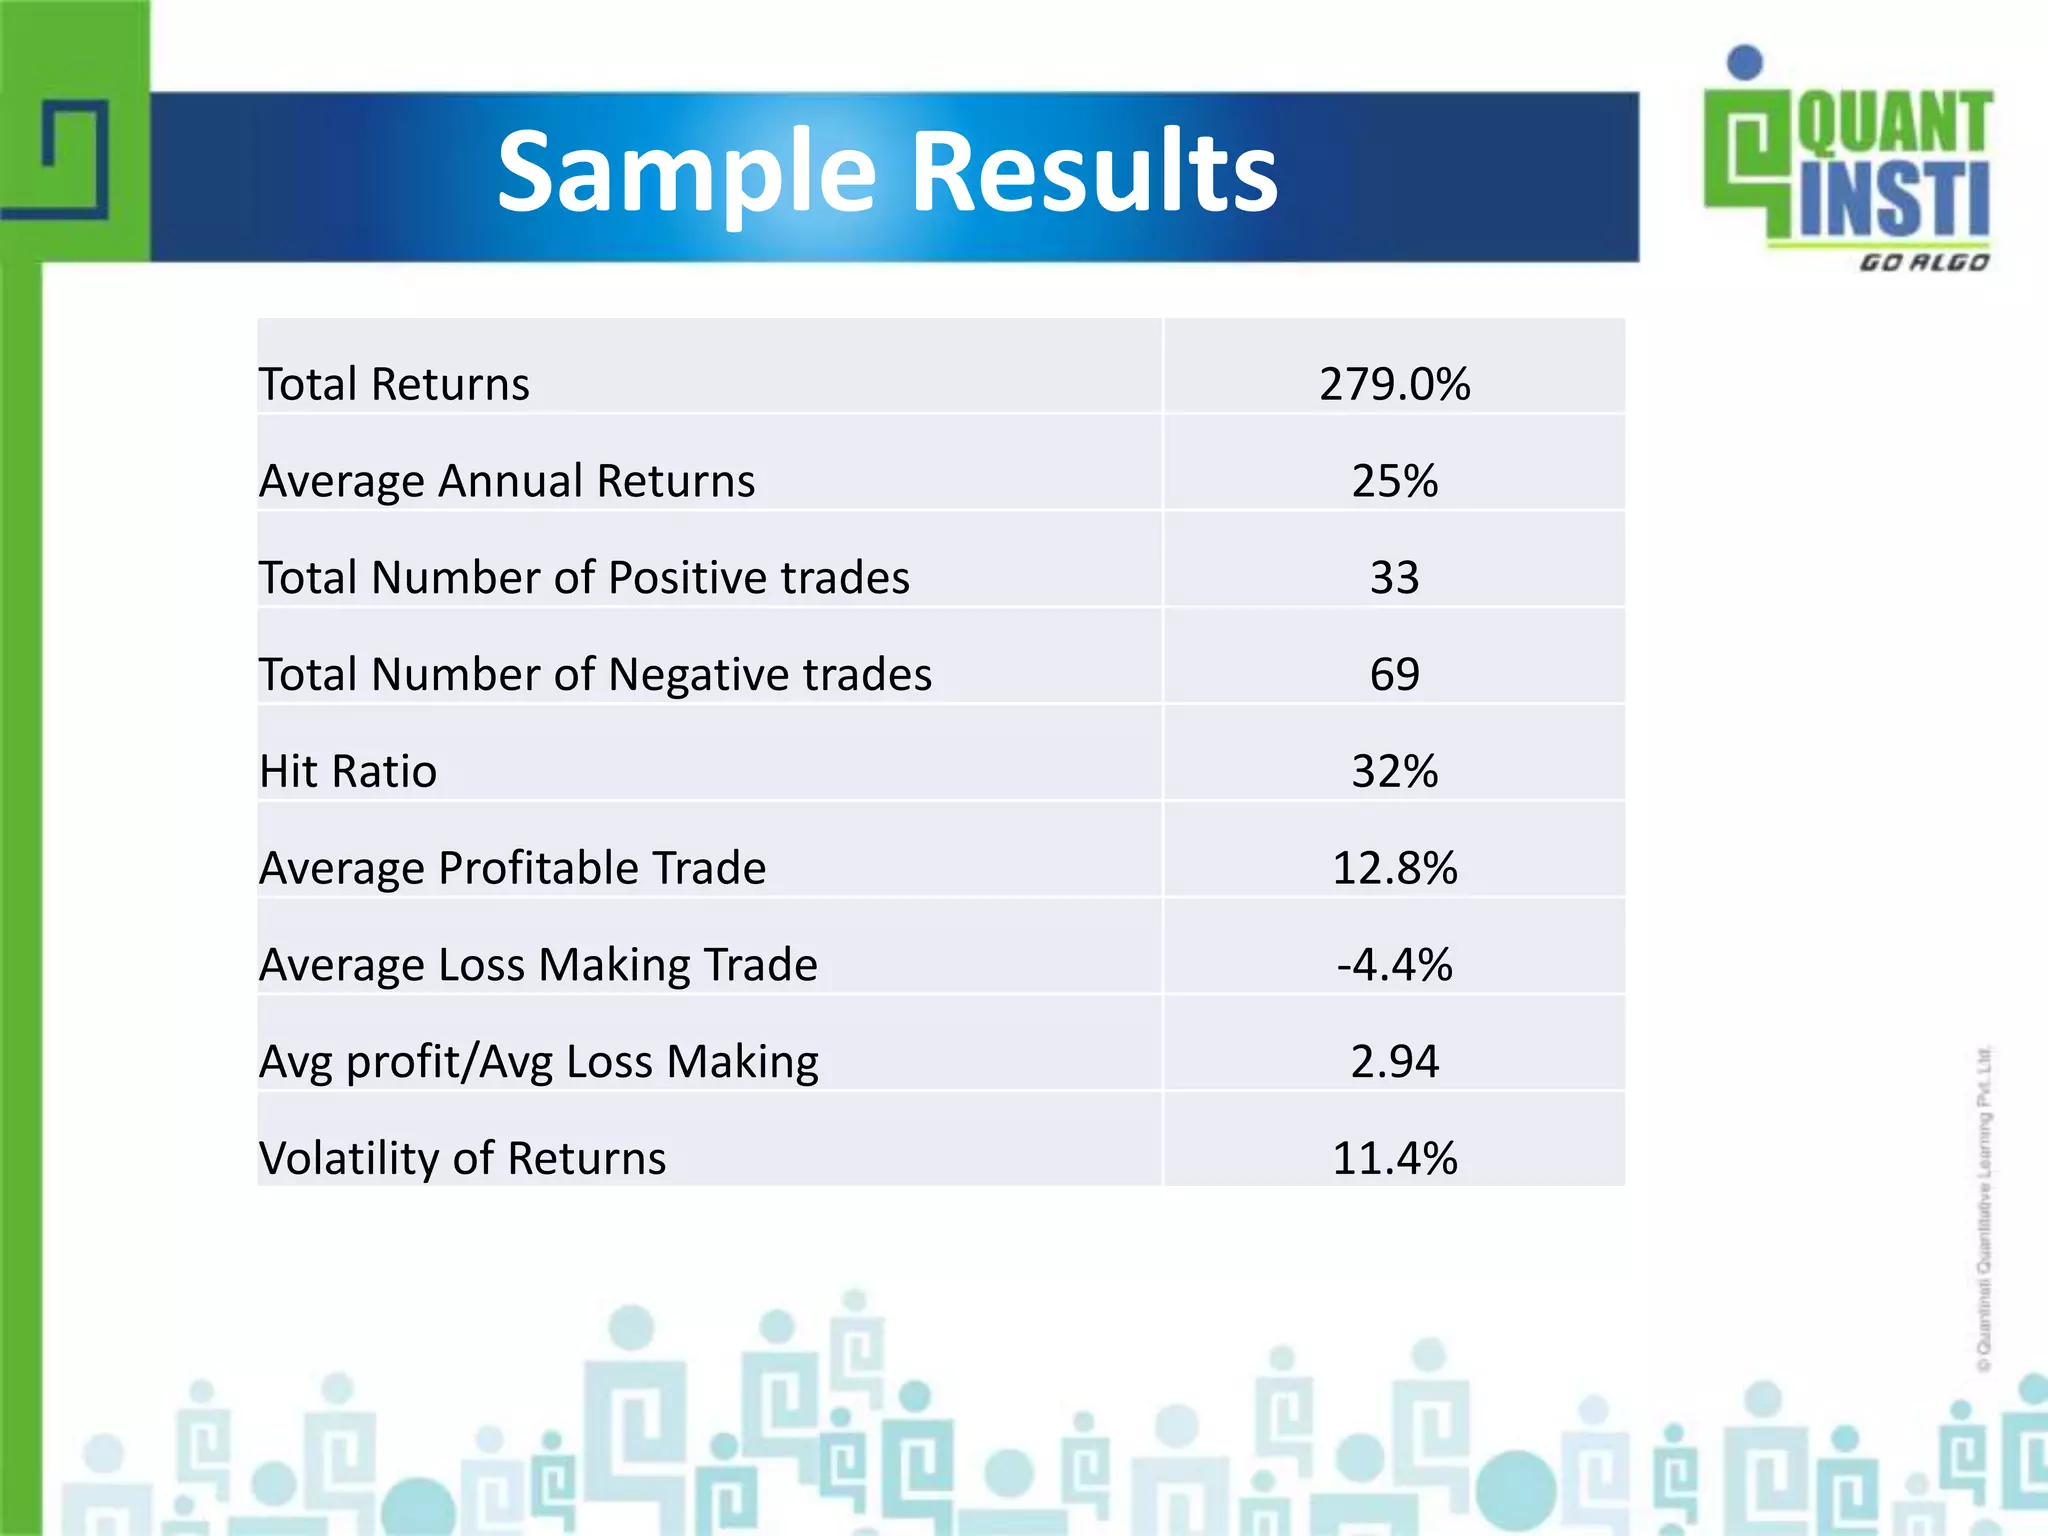
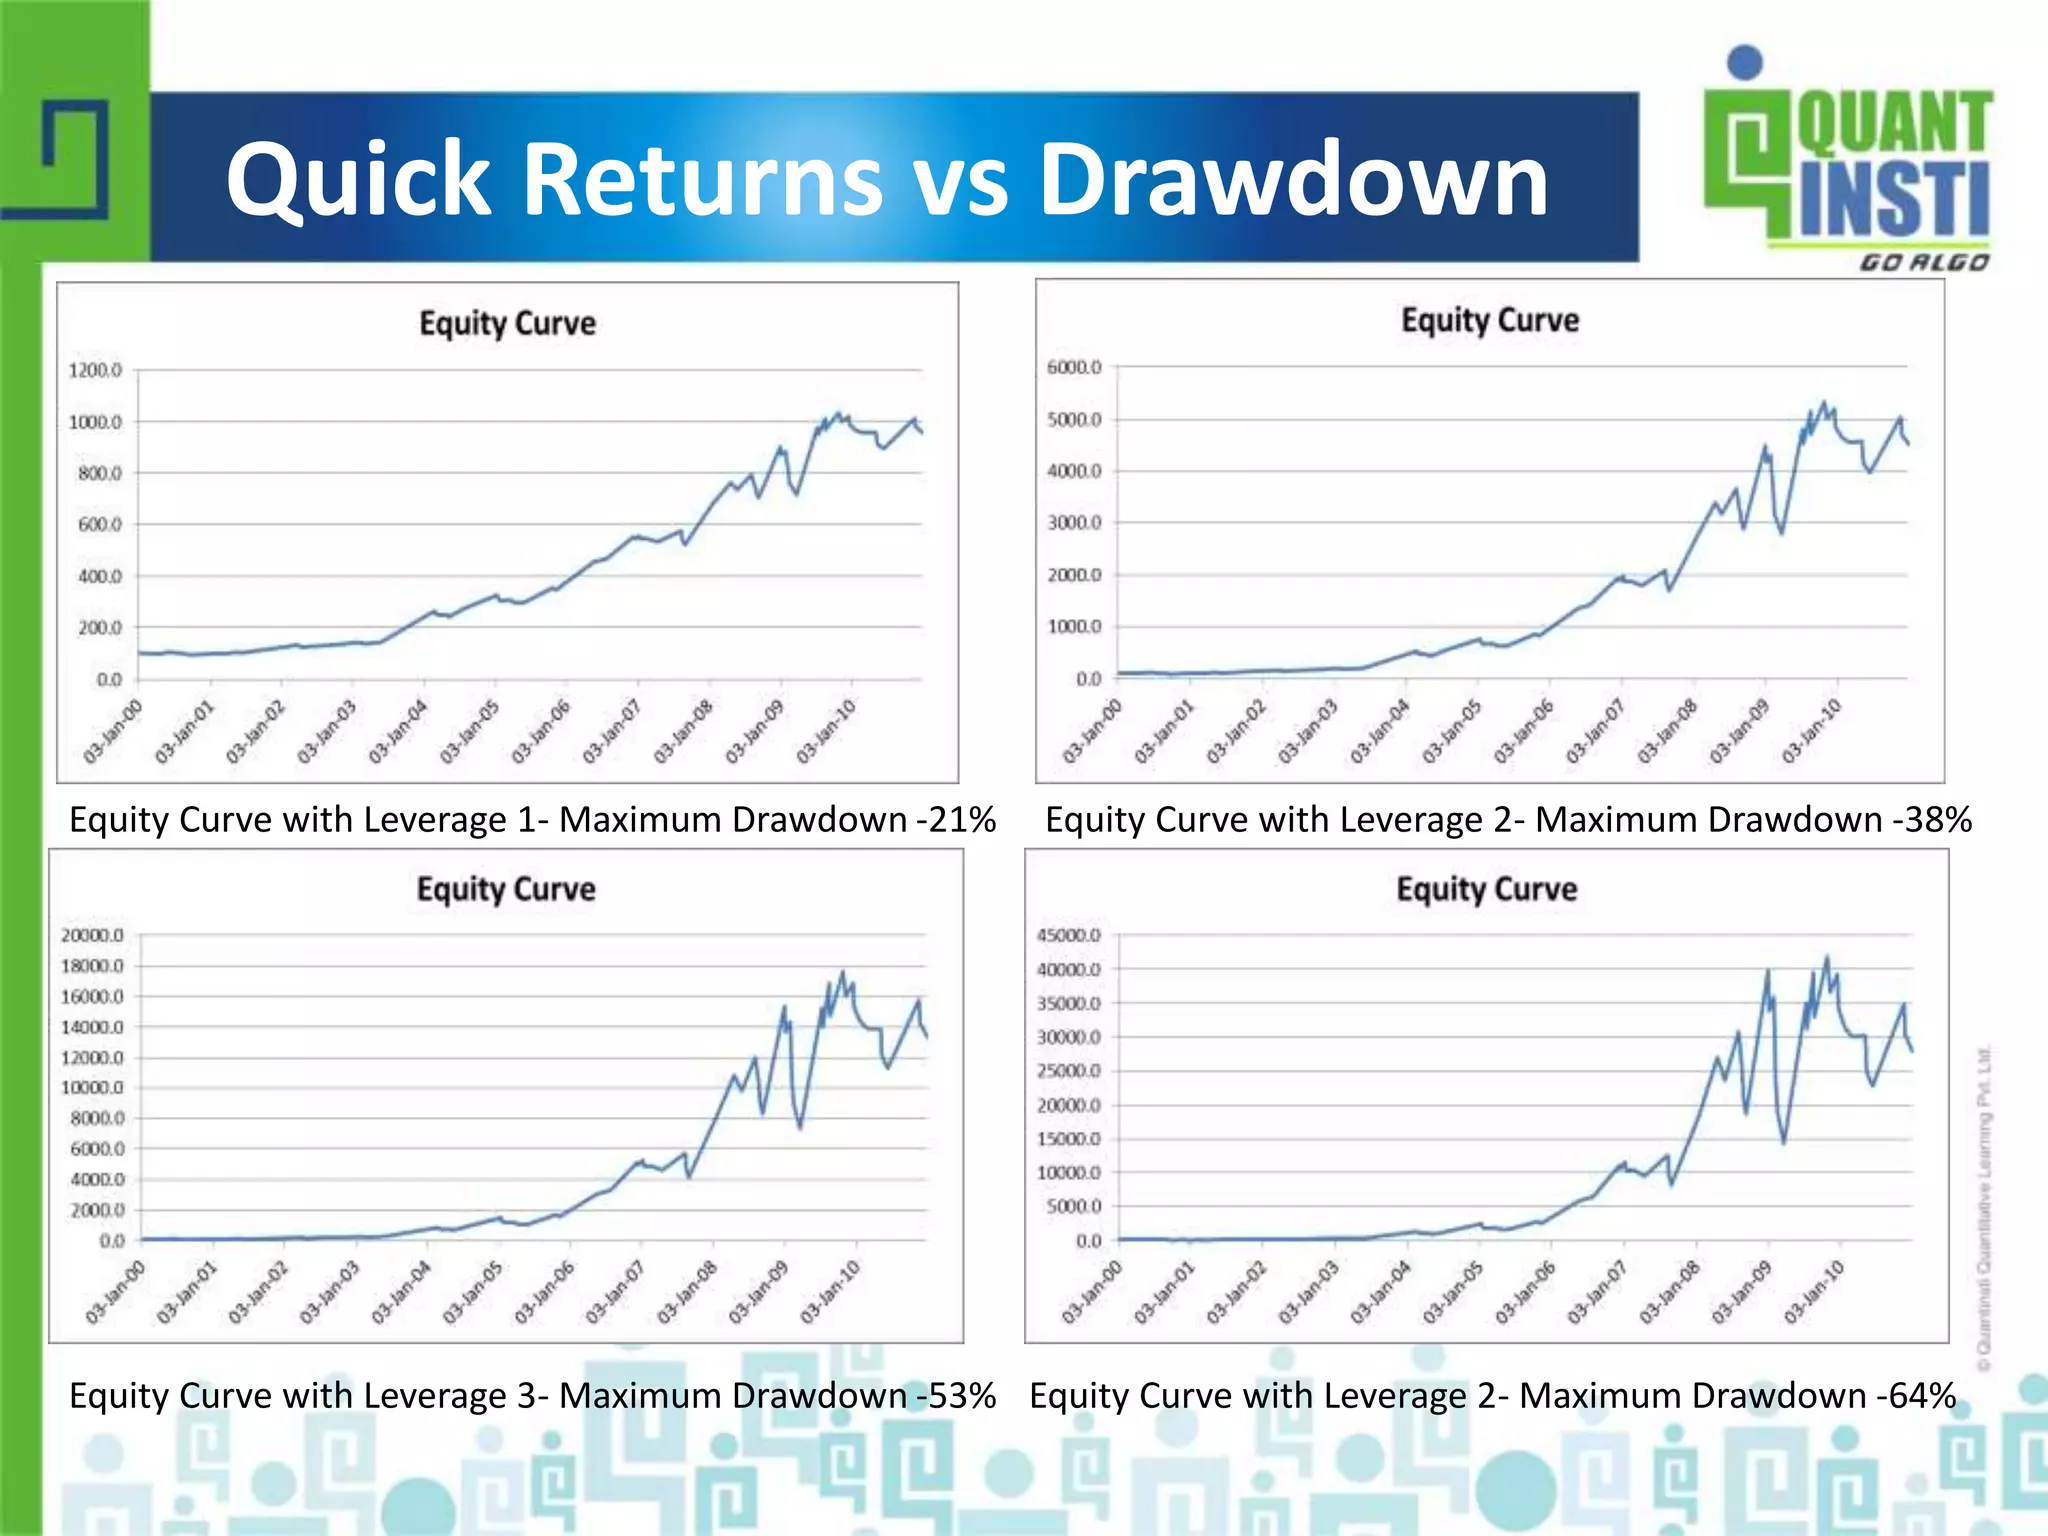
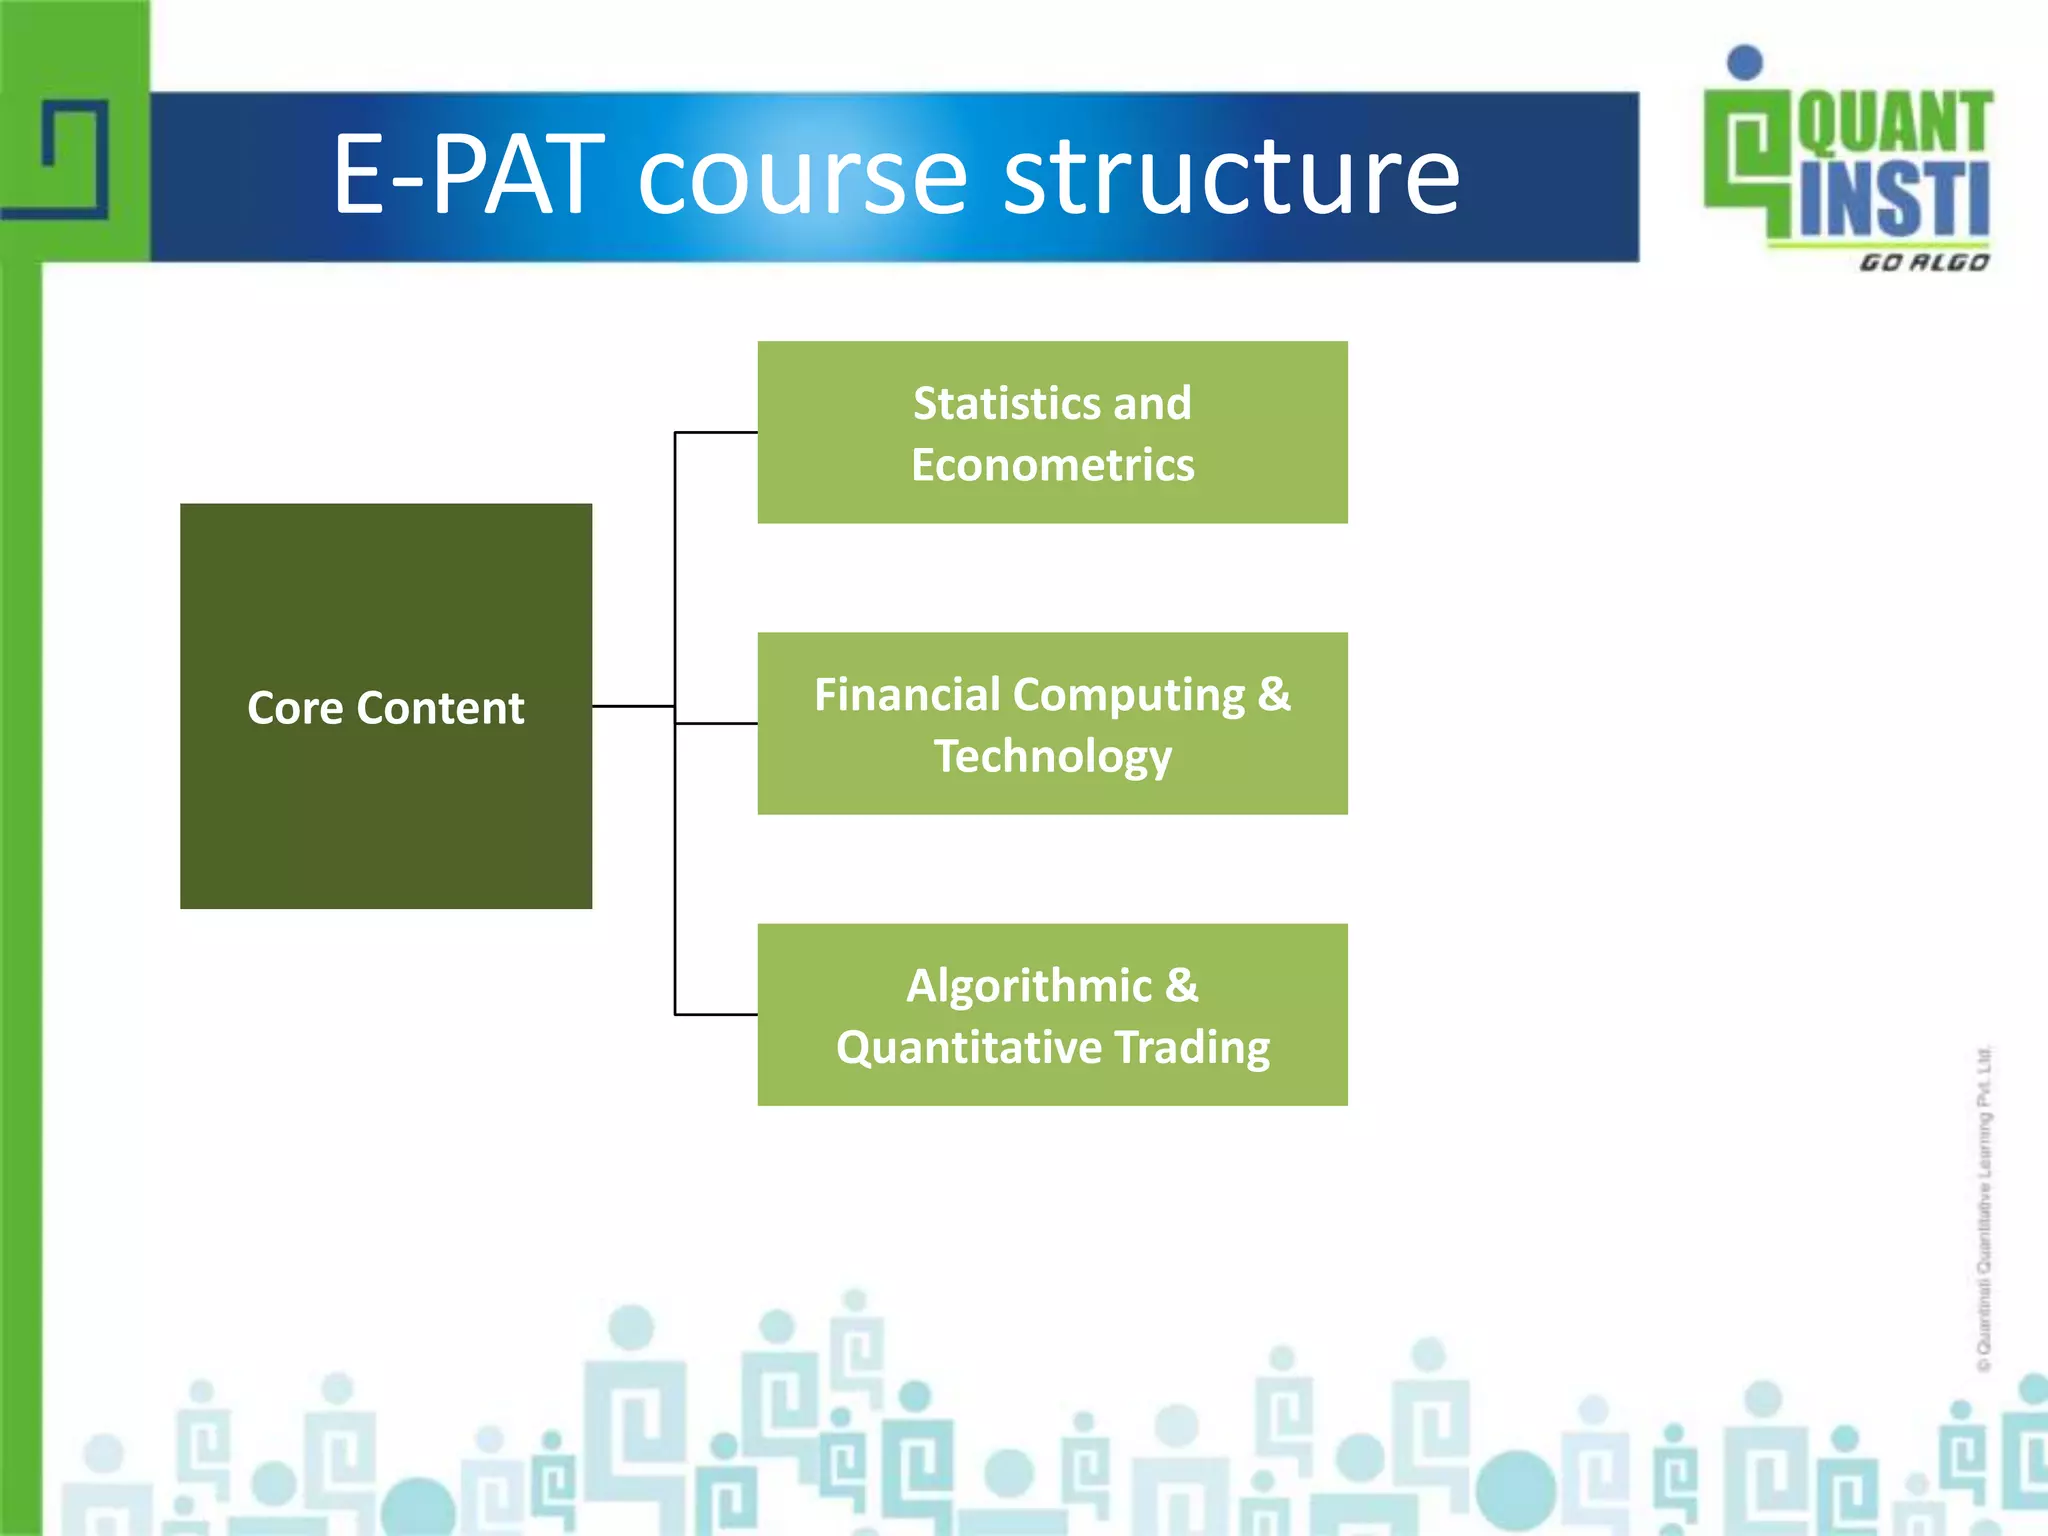
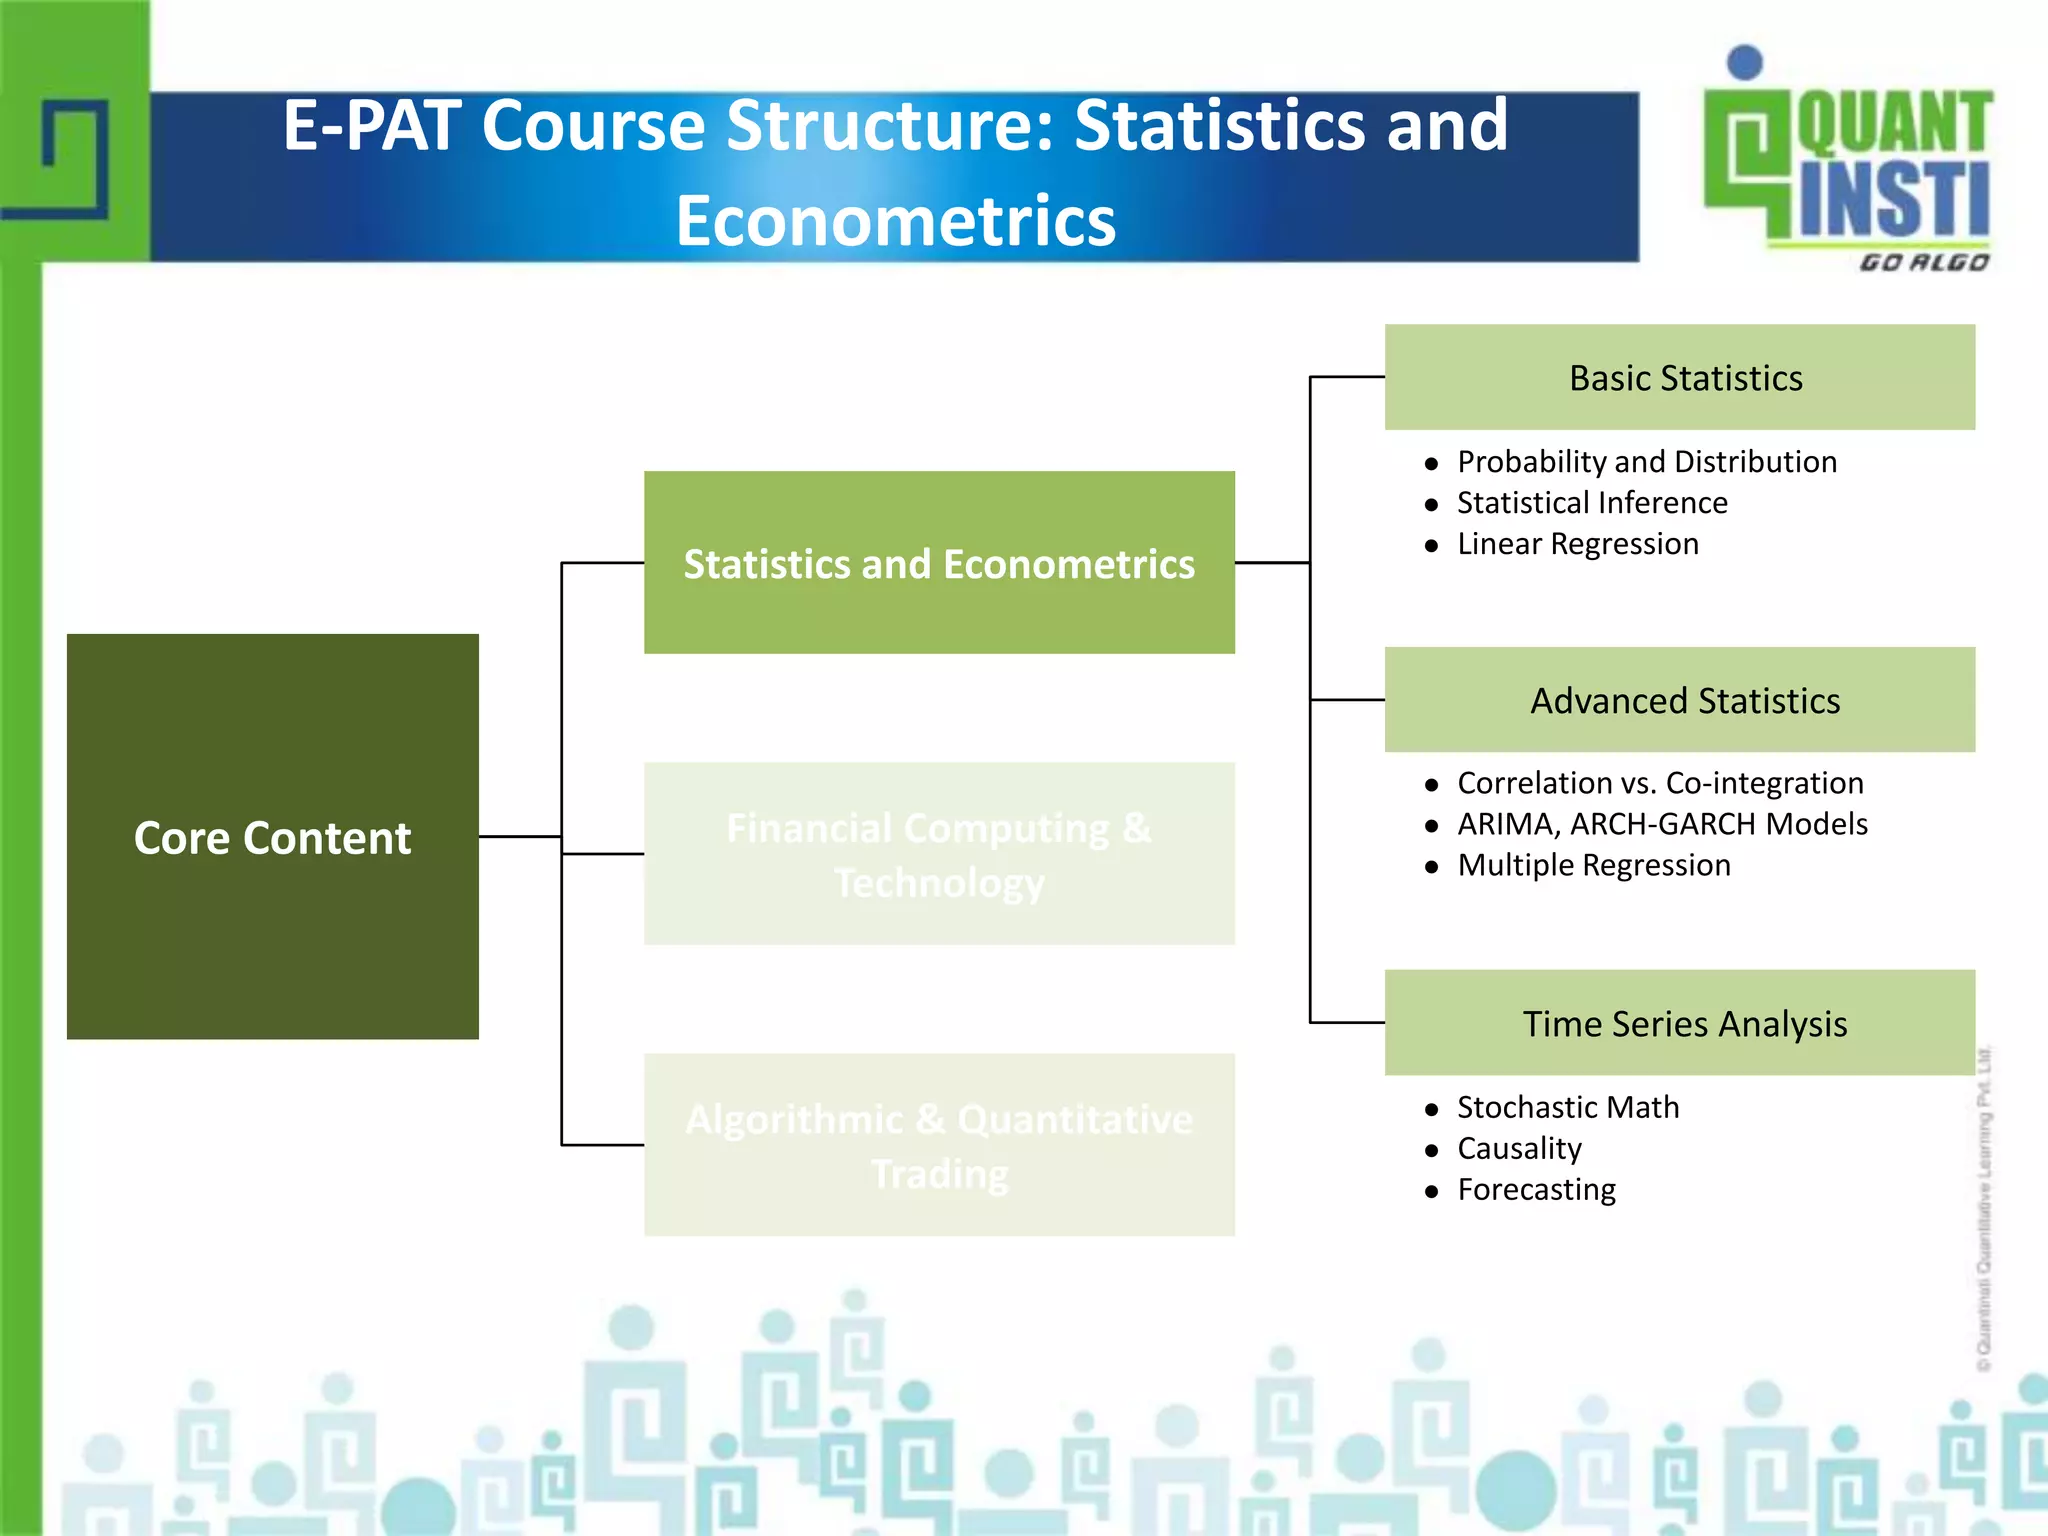
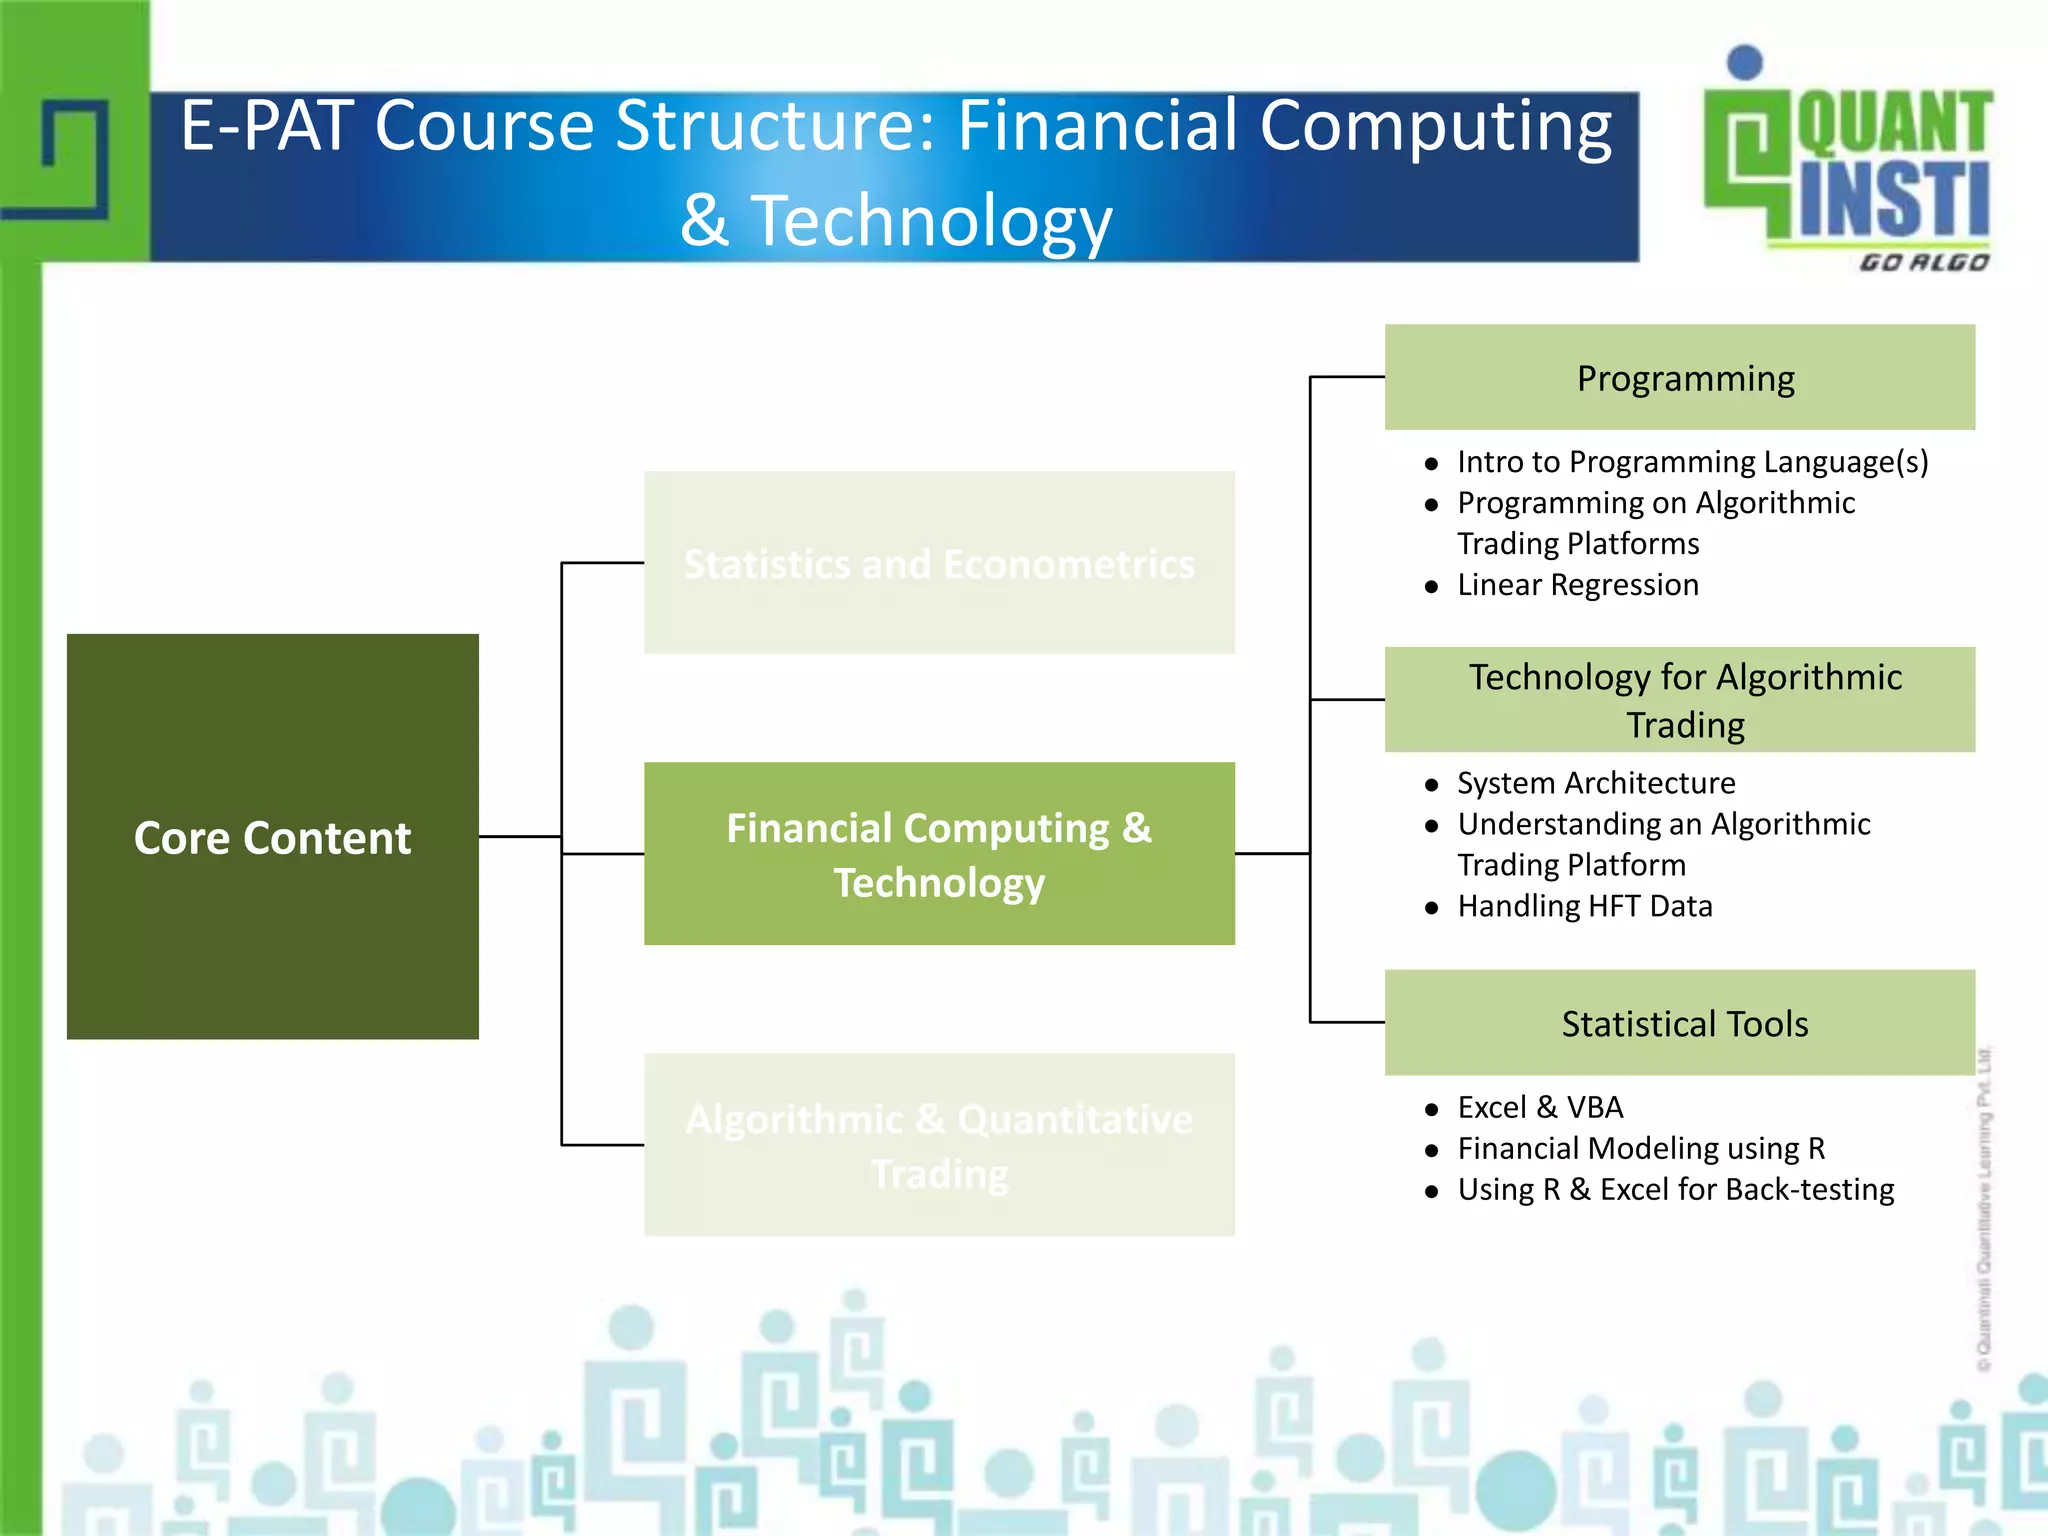
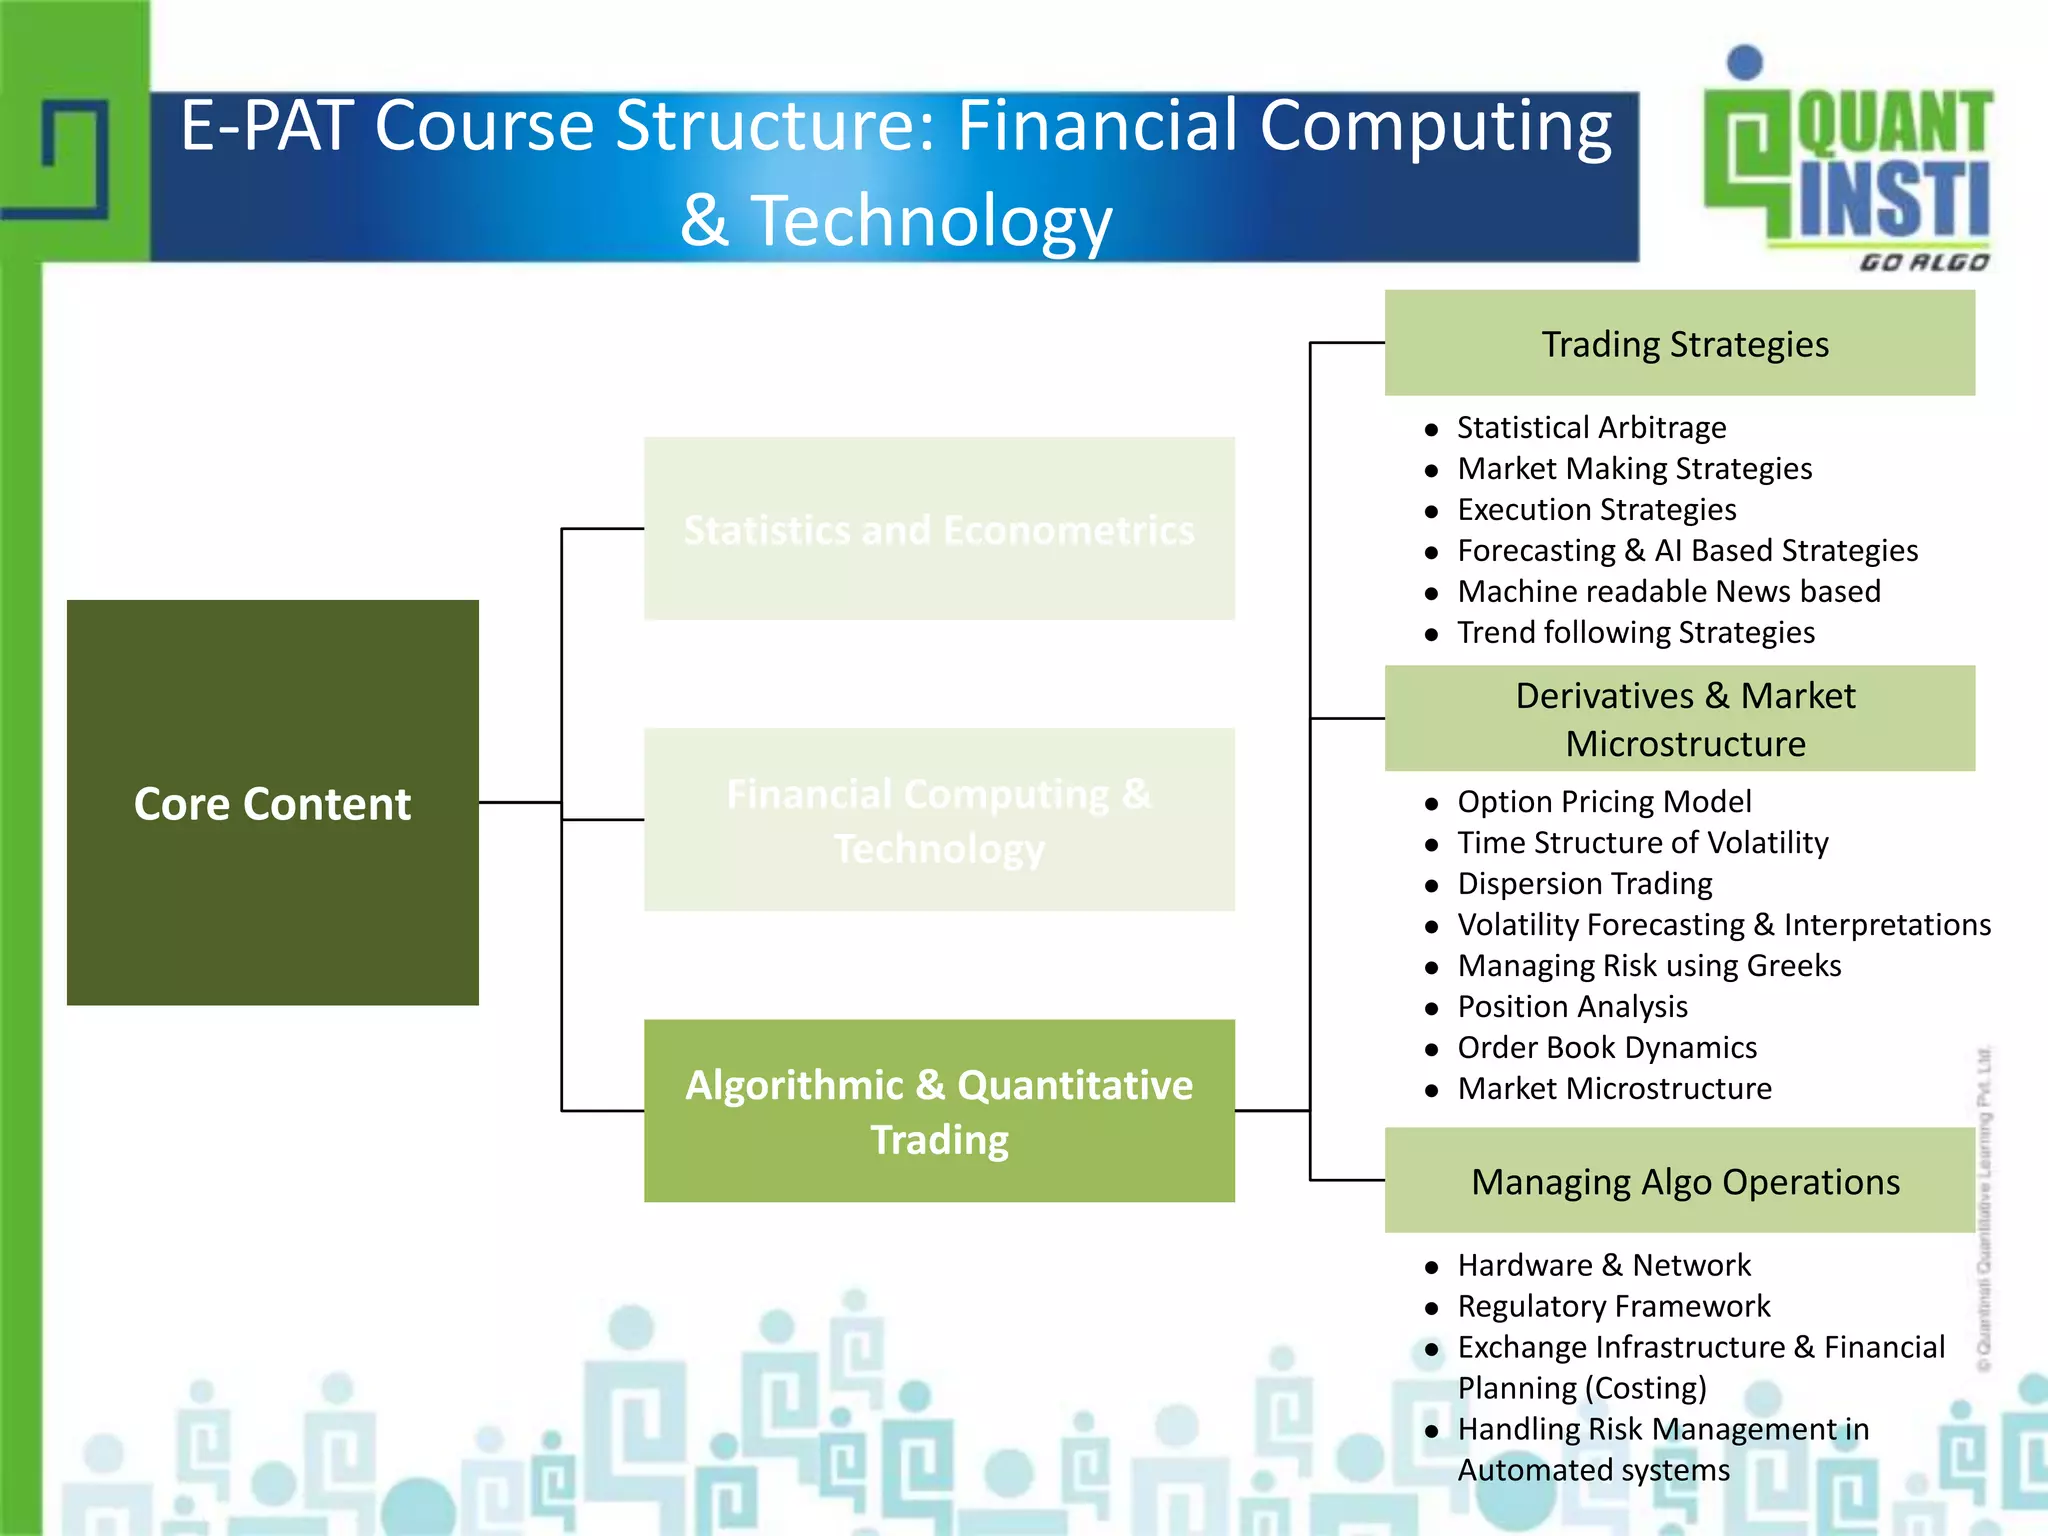
Paradigms of Trading Strategy Formulation 
How and Why of A Trading Strategy Design 
By 
Shaurya Chandra 
Faculty QuantInsti 
© Copyright 2010-2014 QuantInsti Quantitative Learning Private Limited
Housekeeping 
• Headset Requirement: 
• Q&A: Question/answer session will happen after the 
webinar. 
• Web Recordings: Webinar's recordings will be mailed 
to you in 3-4 working days. 
© Copyright 2010-2014 QuantInsti Quantitative Learning Private Limited
Some Hard Truth about Trading.. 
• You might get some 
stock trading tip here 
& there…... 
• But, it takes a real hard 
work to make profit 
consistently!! 
© Copyright 2010-2014 QuantInsti Quantitative Learning Private Limited
Steps in Trading Strategy Formulation 
Hypothesis Formulation 
Back-Testing & Optimization 
Coding Strategy in Trading Platform 
Simulator Testing 
Trading Live in the market 
© Copyright 2010-2014 QuantInsti Quantitative Learning Private Limited
Designing a Trading Strategy 
Choose your game!! Markets have place for everyone… 
• Question one needs to answer, what type of 
strategy one wants to follow?? 
– Trend Following Trading Strategy?? 
– Arbitraging?? 
– Mean reversion?? 
• Statistical Arbitrage 
– Market Making?? 
• Other key areas: 
– Stop Loss and Profit taking 
– Sufficient Sample Trades 
• Statistics helps to formulate your hypothesis 
© Copyright 2010-2014 QuantInsti Quantitative Learning Private Limited
Ok, hypothesis is formed, so what?? 
• Need to check- 
– Estimation of Past performance for the designed 
hypothesis! 
– Result/ Performance stats should back your 
hypothesis 
– Investors needs to be shown numbers to validate the 
substance in the analysis. 
• Hence, Back-testing is important… 
• Back-testing is process by which trader subjects 
the market to the designed trading rules to check 
the performance in past 
© Copyright 2010-2014 QuantInsti Quantitative Learning Private Limited
Process in Back-Testing 
• Choose a detailed historical data with 
following characteristic: 
– Sufficient data number of data points so as to 
create sufficient sample of trades (at-least 100+ 
trades) 
– Should be in sufficient details with various market 
scenario being handled like (bullish, bearish etc..) 
• Make provision for brokerage and slippage 
cost 
• Beware of over fittings!! 
© Copyright 2010-2014 QuantInsti Quantitative Learning Private Limited
Forward Testing & Optimization 
• Suppose, a strategy deploys N- day Moving Average for 
the signal generation, now the question trader face is: 
What should be the value of N?? 
• Following process in involved: 
– Divide the data into 2 parts. Say we call them, A & B, 80% 
and 20% respectively, in terms of number of data points 
– Apply Back-testing and optimize the value of N for some 
parameter on dataset A. Arrive at value of N say ‘n1’ 
– Now, Back-test on dataset B with the value ‘n1’ 
– If the results parameter is same as that of dataset A, keep 
the value of n1, else try with next best. 
© Copyright 2010-2014 QuantInsti Quantitative Learning Private Limited
Some typical Parameters to be estimated… 
• Total Returns (CAGR) 
• Hit Ratio (i.e. Success Ratio) 
• Average Profit per Trade 
• Average Loss Per Trade 
• Maximum Drawdown 
• Maximum Consecutive losses 
• Volatility of Returns 
• Sharpe Ratio : Excess returns (over risk free rate) 
versus Volatility of returns 
© Copyright 2010-2014 QuantInsti Quantitative Learning Private Limited
Trade-offs in the market: 
“Choose what pain you can live with, rather choosing what 
gain you want to make” 
• Returns vs Risk 
– How high the risk you want to take? 
– Is low risk arbitrage for you or the high risk trend following is 
your cup of tea? 
• Hit Ratio Vs Average Returns Per trade 
– Can you handle the string of losses before you see the light of 
dawn? 
• Quick Returns vs Maximum Drawdown 
– Do you want big returns (by leveraging your position) and 
susceptible to big draw downs, or smooth curve of returns?? 
© Copyright 2010-2014 QuantInsti Quantitative Learning Private Limited
A sample strategy 
• Sample Hypothesis: If the daily closing price 
closes above 60-day moving average, then, it’s 
a buy and if it closes below, then the trade is 
Sell. 
• Back-testing particulars: 
– Daily Nifty Data for 3-Jan-2000 to 31-Dec-2010 
– Almost all kind of market scenario considered. 
© Copyright 2010-2014 QuantInsti Quantitative Learning Private Limited
Sample Results 
Total Returns 279.0% 
Average Annual Returns 25% 
Total Number of Positive trades 33 
Total Number of Negative trades 69 
Hit Ratio 32% 
Average Profitable Trade 12.8% 
Average Loss Making Trade -4.4% 
Avg profit/Avg Loss Making 2.94 
Volatility of Returns 11.4% 
© Copyright 2010-2014 QuantInsti Quantitative Learning Private Limited
Quick Returns vs Drawdown 
Equity Curve with Leverage 1- Maximum Drawdown -21% 
Equity Curve with Leverage 3- Maximum Drawdown -53% 
Equity Curve with Leverage 2- Maximum Drawdown -38% 
Equity Curve with Leverage 2- Maximum Drawdown -64% 
© Copyright 2010-2014 QuantInsti Quantitative Learning Private Limited
Why you want to Trade? 
• Want to prove right or you want to make 
money? 
• Getting the right tool and skill set is most 
important!! 
• One Mantra and only one key to success in 
Trading :- “Improve Everyday” 
• Diligently improve, improve on your mistake, 
commit new ones and improve on them. 
© Copyright 2010-2014 QuantInsti Quantitative Learning Private Limited
E-PAT course structure 
Core Content 
Statistics and 
Econometrics 
Financial Computing & 
Technology 
Algorithmic & 
Quantitative Trading 
© Copyright 2010-2014 QuantInsti Quantitative Learning Private Limited
E-PAT Course Structure: Statistics and 
Econometrics 
Core Content 
Statistics and Econometrics 
Financial Computing & 
Technology 
Algorithmic & Quantitative 
Trading 
Basic Statistics 
 Probability and Distribution 
 Statistical Inference 
 Linear Regression 
Advanced Statistics 
 Correlation vs. Co-integration 
 ARIMA, ARCH-GARCH Models 
 Multiple Regression 
Time Series Analysis 
 Stochastic Math 
 Causality 
 Forecasting 
© Copyright 2010-2014 QuantInsti Quantitative Learning Private Limited
E-PAT Course Structure: Financial Computing 
& Technology 
Core Content 
Statistics and Econometrics 
Financial Computing & 
Technology 
Algorithmic & Quantitative 
Trading 
Programming 
 Intro to Programming Language(s) 
 Programming on Algorithmic 
Trading Platforms 
 Linear Regression 
Technology for Algorithmic 
Trading 
 System Architecture 
 Understanding an Algorithmic 
Trading Platform 
 Handling HFT Data 
Statistical Tools 
 Excel & VBA 
 Financial Modeling using R 
 Using R & Excel for Back-testing 
© Copyright 2010-2014 QuantInsti Quantitative Learning Private Limited
E-PAT Course Structure: Financial Computing 
Core Content 
& Technology 
Statistics and Econometrics 
Financial Computing & 
Technology 
Algorithmic & Quantitative 
Trading 
Trading Strategies 
 Statistical Arbitrage 
 Market Making Strategies 
 Execution Strategies 
 Forecasting & AI Based Strategies 
 Machine readable News based 
 Trend following Strategies 
Derivatives & Market 
Microstructure 
 Option Pricing Model 
 Time Structure of Volatility 
 Dispersion Trading 
 Volatility Forecasting & Interpretations 
 Managing Risk using Greeks 
 Position Analysis 
 Order Book Dynamics 
 Market Microstructure 
Managing Algo Operations 
 Hardware & Network 
 Regulatory Framework 
 Exchange Infrastructure & Financial 
Planning (Costing) 
 Handling Risk Management in 
Automated systems 
© Copyright 2010-2014 QuantInsti Quantitative Learning Private Limited
Program Delivery 
• Weekends only program 
– 3 hrs sessions on Saturday & Sunday both days 
– 4 months long program 
– Practical Oriented 
– 100 contact hours including practical sessions 
• Convenience – Conducted online 
• Open Source 
• Virtual Classroom integration 
• Student Portal 
© Copyright 2010-2014 QuantInsti Quantitative Learning Private Limited
Going beyond the curriculum 
• Faculty supervision 
• Placement assistance 
© Copyright 2010-2014 QuantInsti Quantitative Learning Private Limited
Important dates 
Date Event Venue 
5th December, 2013 
Last date for Early bird registration for 
18th batch of EPAT* 
Online 
4th January, 2014 Classes for EPAT batch 18th start Online & offline 
http://www.quantinsti.com/importantdates.html 
*Scholarships: http://www.quantinsti.com/scholarships.html 
© Copyright 2010-2014 QuantInsti Quantitative Learning Private Limited
Thanks! 
THANK YOU 
Contact us at: 
Email: contact@quantinsti.com or sales@quantinsti.com 
Phone: +91-22-61691400, +91-9920448877 
© Copyright 2010-2014 QuantInsti Quantitative Learning Private Limited

Paradigms of trading strategies formulation

  • 1.
    Paradigms of TradingStrategy Formulation How and Why of A Trading Strategy Design By Shaurya Chandra Faculty QuantInsti © Copyright 2010-2014 QuantInsti Quantitative Learning Private Limited
  • 2.
    Housekeeping • HeadsetRequirement: • Q&A: Question/answer session will happen after the webinar. • Web Recordings: Webinar's recordings will be mailed to you in 3-4 working days. © Copyright 2010-2014 QuantInsti Quantitative Learning Private Limited
  • 3.
    Some Hard Truthabout Trading.. • You might get some stock trading tip here & there…... • But, it takes a real hard work to make profit consistently!! © Copyright 2010-2014 QuantInsti Quantitative Learning Private Limited
  • 4.
    Steps in TradingStrategy Formulation Hypothesis Formulation Back-Testing & Optimization Coding Strategy in Trading Platform Simulator Testing Trading Live in the market © Copyright 2010-2014 QuantInsti Quantitative Learning Private Limited
  • 5.
    Designing a TradingStrategy Choose your game!! Markets have place for everyone… • Question one needs to answer, what type of strategy one wants to follow?? – Trend Following Trading Strategy?? – Arbitraging?? – Mean reversion?? • Statistical Arbitrage – Market Making?? • Other key areas: – Stop Loss and Profit taking – Sufficient Sample Trades • Statistics helps to formulate your hypothesis © Copyright 2010-2014 QuantInsti Quantitative Learning Private Limited
  • 6.
    Ok, hypothesis isformed, so what?? • Need to check- – Estimation of Past performance for the designed hypothesis! – Result/ Performance stats should back your hypothesis – Investors needs to be shown numbers to validate the substance in the analysis. • Hence, Back-testing is important… • Back-testing is process by which trader subjects the market to the designed trading rules to check the performance in past © Copyright 2010-2014 QuantInsti Quantitative Learning Private Limited
  • 7.
    Process in Back-Testing • Choose a detailed historical data with following characteristic: – Sufficient data number of data points so as to create sufficient sample of trades (at-least 100+ trades) – Should be in sufficient details with various market scenario being handled like (bullish, bearish etc..) • Make provision for brokerage and slippage cost • Beware of over fittings!! © Copyright 2010-2014 QuantInsti Quantitative Learning Private Limited
  • 8.
    Forward Testing &Optimization • Suppose, a strategy deploys N- day Moving Average for the signal generation, now the question trader face is: What should be the value of N?? • Following process in involved: – Divide the data into 2 parts. Say we call them, A & B, 80% and 20% respectively, in terms of number of data points – Apply Back-testing and optimize the value of N for some parameter on dataset A. Arrive at value of N say ‘n1’ – Now, Back-test on dataset B with the value ‘n1’ – If the results parameter is same as that of dataset A, keep the value of n1, else try with next best. © Copyright 2010-2014 QuantInsti Quantitative Learning Private Limited
  • 9.
    Some typical Parametersto be estimated… • Total Returns (CAGR) • Hit Ratio (i.e. Success Ratio) • Average Profit per Trade • Average Loss Per Trade • Maximum Drawdown • Maximum Consecutive losses • Volatility of Returns • Sharpe Ratio : Excess returns (over risk free rate) versus Volatility of returns © Copyright 2010-2014 QuantInsti Quantitative Learning Private Limited
  • 10.
    Trade-offs in themarket: “Choose what pain you can live with, rather choosing what gain you want to make” • Returns vs Risk – How high the risk you want to take? – Is low risk arbitrage for you or the high risk trend following is your cup of tea? • Hit Ratio Vs Average Returns Per trade – Can you handle the string of losses before you see the light of dawn? • Quick Returns vs Maximum Drawdown – Do you want big returns (by leveraging your position) and susceptible to big draw downs, or smooth curve of returns?? © Copyright 2010-2014 QuantInsti Quantitative Learning Private Limited
  • 11.
    A sample strategy • Sample Hypothesis: If the daily closing price closes above 60-day moving average, then, it’s a buy and if it closes below, then the trade is Sell. • Back-testing particulars: – Daily Nifty Data for 3-Jan-2000 to 31-Dec-2010 – Almost all kind of market scenario considered. © Copyright 2010-2014 QuantInsti Quantitative Learning Private Limited
  • 12.
    Sample Results TotalReturns 279.0% Average Annual Returns 25% Total Number of Positive trades 33 Total Number of Negative trades 69 Hit Ratio 32% Average Profitable Trade 12.8% Average Loss Making Trade -4.4% Avg profit/Avg Loss Making 2.94 Volatility of Returns 11.4% © Copyright 2010-2014 QuantInsti Quantitative Learning Private Limited
  • 13.
    Quick Returns vsDrawdown Equity Curve with Leverage 1- Maximum Drawdown -21% Equity Curve with Leverage 3- Maximum Drawdown -53% Equity Curve with Leverage 2- Maximum Drawdown -38% Equity Curve with Leverage 2- Maximum Drawdown -64% © Copyright 2010-2014 QuantInsti Quantitative Learning Private Limited
  • 14.
    Why you wantto Trade? • Want to prove right or you want to make money? • Getting the right tool and skill set is most important!! • One Mantra and only one key to success in Trading :- “Improve Everyday” • Diligently improve, improve on your mistake, commit new ones and improve on them. © Copyright 2010-2014 QuantInsti Quantitative Learning Private Limited
  • 15.
    E-PAT course structure Core Content Statistics and Econometrics Financial Computing & Technology Algorithmic & Quantitative Trading © Copyright 2010-2014 QuantInsti Quantitative Learning Private Limited
  • 16.
    E-PAT Course Structure:Statistics and Econometrics Core Content Statistics and Econometrics Financial Computing & Technology Algorithmic & Quantitative Trading Basic Statistics  Probability and Distribution  Statistical Inference  Linear Regression Advanced Statistics  Correlation vs. Co-integration  ARIMA, ARCH-GARCH Models  Multiple Regression Time Series Analysis  Stochastic Math  Causality  Forecasting © Copyright 2010-2014 QuantInsti Quantitative Learning Private Limited
  • 17.
    E-PAT Course Structure:Financial Computing & Technology Core Content Statistics and Econometrics Financial Computing & Technology Algorithmic & Quantitative Trading Programming  Intro to Programming Language(s)  Programming on Algorithmic Trading Platforms  Linear Regression Technology for Algorithmic Trading  System Architecture  Understanding an Algorithmic Trading Platform  Handling HFT Data Statistical Tools  Excel & VBA  Financial Modeling using R  Using R & Excel for Back-testing © Copyright 2010-2014 QuantInsti Quantitative Learning Private Limited
  • 18.
    E-PAT Course Structure:Financial Computing Core Content & Technology Statistics and Econometrics Financial Computing & Technology Algorithmic & Quantitative Trading Trading Strategies  Statistical Arbitrage  Market Making Strategies  Execution Strategies  Forecasting & AI Based Strategies  Machine readable News based  Trend following Strategies Derivatives & Market Microstructure  Option Pricing Model  Time Structure of Volatility  Dispersion Trading  Volatility Forecasting & Interpretations  Managing Risk using Greeks  Position Analysis  Order Book Dynamics  Market Microstructure Managing Algo Operations  Hardware & Network  Regulatory Framework  Exchange Infrastructure & Financial Planning (Costing)  Handling Risk Management in Automated systems © Copyright 2010-2014 QuantInsti Quantitative Learning Private Limited
  • 19.
    Program Delivery •Weekends only program – 3 hrs sessions on Saturday & Sunday both days – 4 months long program – Practical Oriented – 100 contact hours including practical sessions • Convenience – Conducted online • Open Source • Virtual Classroom integration • Student Portal © Copyright 2010-2014 QuantInsti Quantitative Learning Private Limited
  • 20.
    Going beyond thecurriculum • Faculty supervision • Placement assistance © Copyright 2010-2014 QuantInsti Quantitative Learning Private Limited
  • 21.
    Important dates DateEvent Venue 5th December, 2013 Last date for Early bird registration for 18th batch of EPAT* Online 4th January, 2014 Classes for EPAT batch 18th start Online & offline http://www.quantinsti.com/importantdates.html *Scholarships: http://www.quantinsti.com/scholarships.html © Copyright 2010-2014 QuantInsti Quantitative Learning Private Limited
  • 22.
    Thanks! THANK YOU Contact us at: Email: contact@quantinsti.com or sales@quantinsti.com Phone: +91-22-61691400, +91-9920448877 © Copyright 2010-2014 QuantInsti Quantitative Learning Private Limited