SlideShare a Scribd company logo
Tiffany Seawell
Final Exam
MBA 5200
INSTRUCTIONS: Put your answers in a Word document and save the file as “yourlastname_Exam.docx”. Also, save
your SAS EG file as “yourlastname_Exam.egp”. Upload all files on the AsULearn site. Make sure your answers are well
organized.
1. Type up and submit your statistics “cheat sheet”. Make sure you list the five steps and the decision rules for
when you would use the different measures of central tendency and the inferential statistics we learned in the
course.
a. Make sure you cheat sheet includes when you use the following statistics
i. Mean, median, mode
ii. One-sampled t-test, Paired samples t-test, ANOVA, Post-Hoc analyses, correlations (parametric
and non-parametric), simple regression, multiple regression
1) Read the question
2) Define the variables
 Conceptual- the idea you are trying to test
 Operational- quantifying the idea: the numbers
3) Identify scales of measure
 Nominal, Ordinal, Interval, & Ratio (Of the operational variables)
Scales of
Measure
Nominal Ordinal Interval Ratio
Classification Yes Yes Yes Yes
Rank-Order No Yes Yes Yes
Fixed/Equal
Intervals
No No Yes Yes
Natural “0”
Point
No No No Yes
 Mean: the average
i. Interval and Ratio data
ii. Symmetric distribution
 Median: the middle
i. Interval, Ratio, and Ordinal
ii. Skewed
 Mode: the most occurring
4) Run the appropriate analysis
 One-Sample t-Test
i. Interval/Ratio data (Variable)
ii. Compare the mean of one variable to an external standard
iii. Two-Scoops Example
 ANOVA
1. Interval/Ratio data (Variable)
2. Ordinal/nominal data: grouping variable
3. Compare the mean of that variable across two or more groups
a. 2 groups- Dunnette T- CI for difference of the means
b. 3 groups- run a Post Hoc Analysis (MULTIPLE ANOVA)
i. Determines the level of variance among groups
 Paired Sample t-Test
i. Interval/Ratio data
ii. Compare the mean of two variables on the same metric (within the same group)
iii. Before & After
 Correlation Coefficient
i. Interval/Ratio data (Pearson’s)
ii. Ordinal data (Kendall or Spearman)
iii. Linear relationship between two variables NOT on the same metric
 Simple Regression
i. One independent variable and one dependent variable
ii. Must be continuous
iii. Allows us to make a prediction
 Multiple Regression
i. Same as simple regression, but with two or more predictors.
5) Report the results
2. Why is statistical power more than just looking at the p-value?
a. Make sure your answer includes a thorough discussion of effect size, confidence intervals, and what
additional or redundant information effect size measures and confidence intervals provide to traditional
‘null hypothesis testing’ (i.e., p-values).
b. Make sure your answer also includes a discussion of what a power analysis tell you, how statistical power
and sample size are related (both conceptually and empirically), and why it is important to conduct a
power analysis when conducting an inferential test.
There are four ways to find statistical power: p-value, confidence intervals, effect size, and power.
P-value is a measure that suggests whether or not it is possible that the mean of whatever variable
relationship being examined could be 0. If the p-value is less than .05, then the mean is not 0 and I
can reject the null hypothesis. If it is greater than .05, then the mean could be 0 and this means that
there could be no relationship, and I cannot reject the null hypothesis. This is why statistical power
important, because the p-value is not a great enough test to determine whether or not something is
statistically significant. There are many cases in which a p-value could say that the relationship is
significant, when it is not, because the p-value is extremely sensitive towards sample size. If the
sample size is large enough, the p-value could show a relationship between anything. Vice versa, if
a sample size is too small, an obvious relationship could be seen as not statistically significant if
only the p-value is examined. The confidence intervals show the range that I can be 95% percent
confident that the mean falls between. If this interval contains 0, then the information is not
statistically significant. If the range is too wide, my confidence in the model would not be high
because of the large amounts of options for the mean. If the interval is small, and there are a small
amount of options for what the mean number could be, I am more confident in the significance. The
effect size shows how much variance can be explained in the model. This is a standardized
measure, so I can tell how well one population can be compared to another. If the effect size is
small then there’s a small magnitude of difference between the variables, and if it is large (0.08),
then there is a larger magnitude of difference. Finally, the power is the probably that I found a
difference if one exists. It is extremely important to conduct a power analysis when conducting an
inferential test so that one can a difference in the model, if one exists. Not being able to find an
existing difference when there is one, or finding a difference when one does not exist, results in a
failed experiment.
INSTRUCTIONS: Use the “Exam.xlsx” file on AsuLearn and SAS EG to answer questions 3 to 5. See Exam Codebook
for survey questions and responses.
3. The famous researcher, Dr. Doowutchalike, is looking to determine what factors influence students’ satisfaction
with their college social life. She is proposing that the ability to manage stress and course difficulty will
significantly relate to students’ report of their satisfaction with their college social life. Additionally, Dr.
Doowutchalike is predicting that student’s level of social involvement will add to the prediction of satisfaction with
their college social life. Is she correct?
a. Assume that ratings scales (e.g., Not Satisfied to Extremely Satisfied; Not at all difficult to Extremely
difficult; Very Poor to Very Good) are interval and write a short analysis plan (i.e., one sentence to one
paragraph) that describes which statistical analysis or analyses you will use to answer the question and
provide the rationale for why that statistic or those statistics are appropriate.
The statistical analysis plan that was used to answer this question was Multiple Regression.
This was the chosen plan because there are two or more predictors being used, manage stress
and course difficulty, and then later there are three predictors once social involvement is added.
This is also the ideal model because the data used is continuous, as each variable is a rating
scale and therefore interval data.
H0: Ability to manage stress and course difficulty will not significantly related to student’s
satisfaction with their college life.
HA: Ability to manage stress and course difficulty will significantly related to student’s
satisfaction with their college life.
b. Provide a write-up of your statistical results (include effect size and CIs) and a non-technical
interpretation.
Manage Stress
M=3.45, SD=0.92, 95% CI [3.34, 3.55]
Course Difficulty
M=3.67, SD=0.92, 95% CI [3.57, 3.78]
Social Life Satisfaction
M=4.55, SD=1.32, 95% CI [4.40, 4.71]
Social Involvement
M=3.17, SD=0.99, 95% CI [3.06, 3.29]
Regression Model
F(2,289) = 11.13, p < .0001, R2 = 0.072
Mang_Stress= 0.19, p <.0008, 95% CI [0.08, 0.30], sr2=0.04
Class_Dif= 0.13, p <.0007, 95% CI [0.057, 0.21], sr2=0.04
Regression Model (After Adding Social Involvement)
F(3,288) = 14.41, p < .0001, R2 = .13
Mang_Stress= 0.15, p <.0092, 95% CI [0.36, 0.25], sr2=0.03
Class_Dif= 0.12, p <.0015, 95% CI [0.47, 0.20], sr2=0.03
Social_Inv= 0.22, p <.0001, 95% CI [0.13, 0.33], sr2=0.06
The ability to manage stress and course difficulty does significantly relate to students’ report of
their satisfaction with their college social life. After cleaning out some variables from the model
that seemed to be outliers, I found that the removal did not make the model much better
because there was no large mean difference when comparing the two models. However, since I
removed them and no large difference was made either way, I decided to use the model without
the outliers. According to the model, as social life satisfaction goes up by 1, manage stress goes
up by 0.19, and class difficulty goes up by 0.13. While these numbers do not seem that large,
they do make a difference for social life satisfaction. This can be supported by the fact that both
variables are also statistically significant according to the p-values, which are both less than .05.
This proves that the means of both are not 0, and makes me more confident in the model. The
confidence intervals are both reassuring to me also, because the ranges are not that large. I am
95% confident that the mean for manage stress is between 0.08 and 0.30, and that the mean for
class difficulty is between 0.057 and 0.21. This does not give much room for the mean to be
different from what the model suggests. Since my r2 is 0.072, I know that my model explains
7.2% of the variance while the F-value of 11.13 suggests that there is 11 times more variance
explained than not explained. The sr2 also shows that removing these predictors would change
the r2 value by 0.04. These are not large, but they are a good amount of security for my model.
Next, I ran a model where social involvement was added as a predictor. According to the model,
as a report of satisfaction goes up by 1, social involvement goes up by 0.22, manage stress
goes up by 0.15, and class difficulty goes up by 0.12. These are pretty significant numbers, and
seem to have a decent effect on college social life satisfaction. This can be supported in
multiple ways, one of which is that the p-value is less than .05 for each of the variables,
meaning that mean is not 0 and that the numbers are significant. I can also be 95% confident
that the mean of social involvement is somewhere between 0.13 and 0.33, manage stress mean
between 0.36 and 0.25, and class difficulty between 0.47 and 0.20. These are important ranges
because they are not very wide. If they were wide, I would not be as confident in the prediction
because the mean could be many different numbers. Since these ranges are small, I am more
confident that the predicted means are correct. The F-value shows that the model can also
explain 14 times more variance than it leaves behind, and the r2 of 0.13 shows that 13% of
variance can be explained. The sr2 for manage stress and class difference is 0.03, and 0.06 for
social involvement. This tells me that the r2 will change by 0.03 and 0.06 if these predictors are
removed. Compared to the last model, it is clear that social involvement does make a difference
in the social life satisfaction as almost all of the numbers I have used to prove whether or not
there is a relationship between the predictors and social life satisfaction were made better.
After analyzing both models, I am choosing to reject the null hypothesis and accept the
alternative hypothesis. By doing so, I am agreeing with Dr. Doowutchalike, that manage stress
and course difficulty do significantly relate to students’ report of their satisfaction with their
college social life and also that the student’s level of social involvement does add to the
prediction of satisfaction with their college social life.
c. Are you concerned about the redundancy of the predictors? Make sure your answer is supported by
empirical evidence.
I am not concerned with redundancy in my predictors, because there is not any. In my first
model, the VIF (Variance Inflation) is 1.00 for both manage stress and class difficulty. This
means that there is no overlap between the two groups, and overlap would represent
redundancy. In the second model, the one that included social involvement, the variables social
involvement and manage stress had VIF scores of 1.04, and class difficulty had a VIF score of
1.00. Once again, these scores show that there is no overlap and therefore no redundancies.
d. Which predictor is contributing most to the prediction of the outcome? Make sure your answer is
supported by empirical evidence.
The predictor that is contributing the most to the prediction of the outcome of social life
satisfaction is social involvement. The sr2 for social involvement was 0.06, meaning that since it
was added to the prediction model, the r2 value was improved by 6%, and removing this
predictor would worsen the r2 by 6%. This is the highest sr2 of any predictor from both models,
making social involvement the variable that is contributing the most.
4. Do students in the sample spend more nights during the school year studying or partying?
a. Write a short analysis plan (i.e., one sentence to one paragraph) that describes which statistical analysis
or analyses you will use to answer the question and provide the rationale for why that statistic or those
statistics are appropriate.
The statistical analysis that I used to answer this question was the Paired Sample t-Test. I
chose this analysis because I need to compare the mean of two variables, study and party, and
they are on the same metric of data, ratio. These meet the qualifications of using a Paired
Sample t-Test where one must be comparing the means, before and after, of two variables on
the same metric and within the same group of either interval or ratio data.
H0: Students do not spend more nights of the school year partying or studying
HA: Students spend more nights of the school year partying than studying
Students spend more nights of the school year studying than partying
b. Provide a write-up of your statistical results (include effect size and CIs) and a non-technical
interpretation.
Study: M=3.77; SD=2.33; 95% CI [3.51; 4.04]
Party: M=3.34; SD=2.37; 95% CI [3.08; 3.61]
MDiff T1-T2 = -0.44; 95% CI [0.04; 0.85]
Inferential Stats: t(299)= -2.11, p=0.04, d=0.18, power=0.61
c. How much do you trust the results of your analyses? That is, could you have made a Type I or Type II
error? How strong are the effects that you found?
To decide whether or not students spend more time studying or partying, or that there is no
difference in the times spent doing both, I first looked at the p-value. This value was less than
.05, showing that the mean is not 0 and that the data is significant. However, since it was .04,
and this is so close to .05, I do believe that it is significant, but not as significant as it should be
for me to have a high amount of confidence that the mean is not 0. The numbers for the
variables of study and party are extremely similar. The mean of study is 3.77, and the mean of
party is 3.34. The standard deviations of the variables study and party are 2.33 and 2.37. Both
of these sets of numbers are so close, it is hard to say that students spend more time doing one
or the other. The confidence intervals are also a small range and close. I am 95% confident that
the mean of study falls somewhere between 3.51 and 4.04, and that the mean of party falls
somewhere between 3.08 and 3.61. In both of these intervals, there is not a large option of
means because the numbers are so close. Also, in both of the intervals, it is possible for the
mean of both groups to be somewhere between 3.51 and 3.61, meaning that the groups could
potentially have the same mean. Although there is a mean difference of -0.44 (the fact that this
number is negative is not significant, it is only negative because of the order the variables are in
my model,) this is not large enough for me to believe that there is a significant difference
between the two means, especially after exploring the confidence intervals. Also, since the
effect size is so small, only 0.18, I can see that there is a small magnitude of difference between
the two groups. With a power of 0.61, there is a 39% chance that I made a type II error.
Therefore, I cannot trust my results. For all of these reasons, I will have to accept the null
hypothesis, that students do not spend any more time studying than they do partying, and vice
versa. There is no difference between the amount of time that students spend partying and
studying.
5. Dr. Acula wants to examine if students’ year in school is related to how students report the average amount of
negative emotions they have. He believes that seniors will experience more negative emotions compared to
sophomore and juniors, but fewer than freshmen. He also believe that sophomore and juniors will have the same
amount of negative compared to one another. Is. Dr. Acula correct?
a. Write a short analysis plan (i.e., one sentence to one paragraph) that describes which statistical analysis
or analyses you will use to answer the question and provide the rationale for why that statistic or those
statistics are appropriate.
i. Hint: You will have to compute a new variable to answer this question
To answer this question, I ran a One-Way ANOVA with Post Hoc analysis. I chose this analysis
plan because I am comparing the means of the new variable of negative emotions is interval
data, and that is being grouped by students’ year in college, ordinal data.
H0= There is no difference in negative emotions amongst the different years in college.
HA= There is a difference in the negative emotions between the different years in college.
b. Provide a write-up of your statistical results (include effect size and CIs) and a non-technical
interpretation.
Negative Emotions: M=2.14, SD=0.65, 95% CI [2.07, 2.22]
Freshman: M=2.10, SD=0.53, 95% CI [1.95, 2.26]
Sophomore: M=2.28, SD=0.72, 95% CI [2.14, 2.42]
Junior: M=2.04, SD=0.56, 95% CI [1.93, 2.15]
Senior: M=2.10, SD=0.74, 95% CI [1.91, 2.30]
F(3,296)= 2.49, p= 0.06, R2= 0.02
When trying to decide where or not a students’ year in school is related to how students report
the average amount of negative emotions they have, I had to analyze the statistical results from
the One-Way ANOVA. The p-value shows that there is a possibility that the mean could be 0,
because it is not less than 0.05, meaning that there is most likely no difference between the
groups. The r2 value was also extremely small, only 0.02. This small of a r2 value suggests that
only 2% of the variances in the model can be explained. This leaves 98% of unexplained
variances, which is an extremely large amount. The f-value is also small, 2.49, meaning that the
model can explain 2.49 times the amount of variance than it cannot explain. This is also a very
small number. With this analysis, I do not believe that the information is statistically significant
and therefore, cannot be trusted. This information allows me to come to the conclusion that I
must accept the null hypothesis that there is no difference between the students’ college year
and how many negative emotions they have.
When running a One-Way ANOVA, I would usually run a Post Hoc to find the differences
between the groups; but after evaluating the One-Way ANOVA results, and finding that I was
unable to reject the null hypothesis, I was also concluding that there is no difference in the
relationship between years and negative emotions. Because of this, any information found on a
Post Hoc analysis would be useless because the model cannot be trusted.

More Related Content

What's hot

Multivariate data analysis regression, cluster and factor analysis on spss
Multivariate data analysis   regression, cluster and factor analysis on spssMultivariate data analysis   regression, cluster and factor analysis on spss
Multivariate data analysis regression, cluster and factor analysis on spss
Aditya Banerjee
 
Multiple Linear Regression
Multiple Linear RegressionMultiple Linear Regression
Multiple Linear Regression
Indus University
 
Reconsidering baron and kenny
Reconsidering baron and kennyReconsidering baron and kenny
Reconsidering baron and kenny
Minhwan Lee
 
statistical estimation
statistical estimationstatistical estimation
statistical estimation
Amish Akbar
 
Addressing moderated mediation preacher rucker_hayes_2007
Addressing moderated mediation preacher rucker_hayes_2007Addressing moderated mediation preacher rucker_hayes_2007
Addressing moderated mediation preacher rucker_hayes_2007
Payal Anand
 
Data processing
Data processingData processing
Data processing
marie chris portillas
 
Correlational research 1 1
Correlational research 1 1Correlational research 1 1
Correlational research 1 1sdwilson88
 
notes on correlational research
notes on correlational researchnotes on correlational research
notes on correlational researchSiti Ishark
 
5. testing differences
5. testing differences5. testing differences
5. testing differences
Steve Saffhill
 
Lecture 07
Lecture 07Lecture 07
Lecture 07
MEHTAB REHMAN
 
Research Methodology (Correlational Research) By Emeral & Sarah
Research Methodology (Correlational Research) By Emeral & SarahResearch Methodology (Correlational Research) By Emeral & Sarah
Research Methodology (Correlational Research) By Emeral & Sarah
Emeral Djunas
 
Factor analysis (1)
Factor analysis (1)Factor analysis (1)
Factor analysis (1)
CVA170032STUDENT
 
Statistical parameters
Statistical parametersStatistical parameters
Statistical parameters
Burdwan University
 
Research methods 2 operationalization &amp; measurement
Research methods 2   operationalization &amp; measurementResearch methods 2   operationalization &amp; measurement
Research methods 2 operationalization &amp; measurement
attique1960
 
SEM
SEMSEM

What's hot (18)

Multivariate data analysis regression, cluster and factor analysis on spss
Multivariate data analysis   regression, cluster and factor analysis on spssMultivariate data analysis   regression, cluster and factor analysis on spss
Multivariate data analysis regression, cluster and factor analysis on spss
 
Factor analysis
Factor analysisFactor analysis
Factor analysis
 
Chapter 3
Chapter 3Chapter 3
Chapter 3
 
Multiple Linear Regression
Multiple Linear RegressionMultiple Linear Regression
Multiple Linear Regression
 
Reconsidering baron and kenny
Reconsidering baron and kennyReconsidering baron and kenny
Reconsidering baron and kenny
 
statistical estimation
statistical estimationstatistical estimation
statistical estimation
 
Addressing moderated mediation preacher rucker_hayes_2007
Addressing moderated mediation preacher rucker_hayes_2007Addressing moderated mediation preacher rucker_hayes_2007
Addressing moderated mediation preacher rucker_hayes_2007
 
Data processing
Data processingData processing
Data processing
 
Correlational research 1 1
Correlational research 1 1Correlational research 1 1
Correlational research 1 1
 
notes on correlational research
notes on correlational researchnotes on correlational research
notes on correlational research
 
5. testing differences
5. testing differences5. testing differences
5. testing differences
 
Lecture 07
Lecture 07Lecture 07
Lecture 07
 
Multivariate
MultivariateMultivariate
Multivariate
 
Research Methodology (Correlational Research) By Emeral & Sarah
Research Methodology (Correlational Research) By Emeral & SarahResearch Methodology (Correlational Research) By Emeral & Sarah
Research Methodology (Correlational Research) By Emeral & Sarah
 
Factor analysis (1)
Factor analysis (1)Factor analysis (1)
Factor analysis (1)
 
Statistical parameters
Statistical parametersStatistical parameters
Statistical parameters
 
Research methods 2 operationalization &amp; measurement
Research methods 2   operationalization &amp; measurementResearch methods 2   operationalization &amp; measurement
Research methods 2 operationalization &amp; measurement
 
SEM
SEMSEM
SEM
 

Viewers also liked

Analyse technique 12 mai 2010
Analyse technique 12 mai 2010Analyse technique 12 mai 2010
Analyse technique 12 mai 2010Cherradi -
 
Arch Ahmed Ashraf Design,Fit-Out & Marble Works Samples
Arch Ahmed Ashraf Design,Fit-Out & Marble Works SamplesArch Ahmed Ashraf Design,Fit-Out & Marble Works Samples
Arch Ahmed Ashraf Design,Fit-Out & Marble Works Samplesahmed ashraf
 
PresentationInclusionDr.Cole
PresentationInclusionDr.ColePresentationInclusionDr.Cole
PresentationInclusionDr.ColeKrista Kyker
 
Photos+spectaculaires+. +23+05+2012
Photos+spectaculaires+. +23+05+2012Photos+spectaculaires+. +23+05+2012
Photos+spectaculaires+. +23+05+2012denis
 
Manuela caro 8.2
Manuela caro 8.2Manuela caro 8.2
Manuela caro 8.2
manuela caro
 
фгос в условиях инклюзивного образования. вводная лекция.
фгос в условиях инклюзивного образования. вводная лекция.фгос в условиях инклюзивного образования. вводная лекция.
фгос в условиях инклюзивного образования. вводная лекция.
Наталья Игоревна
 
Differences in faa vs icao procedures
Differences in faa vs icao proceduresDifferences in faa vs icao procedures
Differences in faa vs icao procedures
Pangolin Chodri
 
KKykerEmotionalDisabilities
KKykerEmotionalDisabilitiesKKykerEmotionalDisabilities
KKykerEmotionalDisabilitiesKrista Kyker
 
Mejoramiento calidad
Mejoramiento calidadMejoramiento calidad
Mejoramiento calidad
Monica Lopera Ossa
 
60116829 jean-tech-pack
60116829 jean-tech-pack60116829 jean-tech-pack
60116829 jean-tech-pack
rajasekaranvg
 
Як запобігти інтернет – залежності вашої дитини
Як запобігти інтернет – залежності вашої дитиниЯк запобігти інтернет – залежності вашої дитини
Як запобігти інтернет – залежності вашої дитини
Александр Шовенко
 

Viewers also liked (12)

Analyse technique 12 mai 2010
Analyse technique 12 mai 2010Analyse technique 12 mai 2010
Analyse technique 12 mai 2010
 
Arch Ahmed Ashraf Design,Fit-Out & Marble Works Samples
Arch Ahmed Ashraf Design,Fit-Out & Marble Works SamplesArch Ahmed Ashraf Design,Fit-Out & Marble Works Samples
Arch Ahmed Ashraf Design,Fit-Out & Marble Works Samples
 
PresentationInclusionDr.Cole
PresentationInclusionDr.ColePresentationInclusionDr.Cole
PresentationInclusionDr.Cole
 
Photos+spectaculaires+. +23+05+2012
Photos+spectaculaires+. +23+05+2012Photos+spectaculaires+. +23+05+2012
Photos+spectaculaires+. +23+05+2012
 
Manuela caro 8.2
Manuela caro 8.2Manuela caro 8.2
Manuela caro 8.2
 
фгос в условиях инклюзивного образования. вводная лекция.
фгос в условиях инклюзивного образования. вводная лекция.фгос в условиях инклюзивного образования. вводная лекция.
фгос в условиях инклюзивного образования. вводная лекция.
 
Differences in faa vs icao procedures
Differences in faa vs icao proceduresDifferences in faa vs icao procedures
Differences in faa vs icao procedures
 
KKykerEmotionalDisabilities
KKykerEmotionalDisabilitiesKKykerEmotionalDisabilities
KKykerEmotionalDisabilities
 
санпин для до
санпин для досанпин для до
санпин для до
 
Mejoramiento calidad
Mejoramiento calidadMejoramiento calidad
Mejoramiento calidad
 
60116829 jean-tech-pack
60116829 jean-tech-pack60116829 jean-tech-pack
60116829 jean-tech-pack
 
Як запобігти інтернет – залежності вашої дитини
Як запобігти інтернет – залежності вашої дитиниЯк запобігти інтернет – залежності вашої дитини
Як запобігти інтернет – залежності вашої дитини
 

Similar to Seawell_Exam

Sample Size Determination
Sample Size DeterminationSample Size Determination
Between Black and White Population1. Comparing annual percent .docx
Between Black and White Population1. Comparing annual percent .docxBetween Black and White Population1. Comparing annual percent .docx
Between Black and White Population1. Comparing annual percent .docx
jasoninnes20
 
Spss software
Spss softwareSpss software
Spss software
ManonmaniA3
 
Need a nonplagiarised paper and a form completed by 1006015 before.docx
Need a nonplagiarised paper and a form completed by 1006015 before.docxNeed a nonplagiarised paper and a form completed by 1006015 before.docx
Need a nonplagiarised paper and a form completed by 1006015 before.docx
lea6nklmattu
 
Research Critique GuidelinesQuantitative StudyBackground of .docx
Research Critique GuidelinesQuantitative StudyBackground of .docxResearch Critique GuidelinesQuantitative StudyBackground of .docx
Research Critique GuidelinesQuantitative StudyBackground of .docx
verad6
 
BUS308 – Week 5 Lecture 1 A Different View Expected Ou.docx
BUS308 – Week 5 Lecture 1 A Different View Expected Ou.docxBUS308 – Week 5 Lecture 1 A Different View Expected Ou.docx
BUS308 – Week 5 Lecture 1 A Different View Expected Ou.docx
curwenmichaela
 
Statistical ProcessesCan descriptive statistical processes b.docx
Statistical ProcessesCan descriptive statistical processes b.docxStatistical ProcessesCan descriptive statistical processes b.docx
Statistical ProcessesCan descriptive statistical processes b.docx
darwinming1
 
Statistics  What you Need to KnowIntroductionOften, when peop.docx
Statistics  What you Need to KnowIntroductionOften, when peop.docxStatistics  What you Need to KnowIntroductionOften, when peop.docx
Statistics  What you Need to KnowIntroductionOften, when peop.docx
dessiechisomjj4
 
Week 6 DQ1. What is your research questionIs there a differen.docx
Week 6 DQ1. What is your research questionIs there a differen.docxWeek 6 DQ1. What is your research questionIs there a differen.docx
Week 6 DQ1. What is your research questionIs there a differen.docx
cockekeshia
 
Research metholodogy report
Research metholodogy reportResearch metholodogy report
Research metholodogy report
Harjas Singh
 
Executive Program Practical Connection Assignment - 100 poin
Executive Program Practical Connection Assignment - 100 poinExecutive Program Practical Connection Assignment - 100 poin
Executive Program Practical Connection Assignment - 100 poin
BetseyCalderon89
 
When you are working on the Inferential Statistics Paper I want yo.docx
When you are working on the Inferential Statistics Paper I want yo.docxWhen you are working on the Inferential Statistics Paper I want yo.docx
When you are working on the Inferential Statistics Paper I want yo.docx
alanfhall8953
 
You clearly understand the concepts of this assignment. You’ve don.docx
You clearly understand the concepts of this assignment. You’ve don.docxYou clearly understand the concepts of this assignment. You’ve don.docx
You clearly understand the concepts of this assignment. You’ve don.docx
jeffevans62972
 
MELJUN CORTES research designing_research_methodology
MELJUN CORTES research designing_research_methodologyMELJUN CORTES research designing_research_methodology
MELJUN CORTES research designing_research_methodology
MELJUN CORTES
 
DESCRIPTIVE ANALYSIS1DESCRIPTIVE ANALYSIS8Examining .docx
DESCRIPTIVE ANALYSIS1DESCRIPTIVE ANALYSIS8Examining .docxDESCRIPTIVE ANALYSIS1DESCRIPTIVE ANALYSIS8Examining .docx
DESCRIPTIVE ANALYSIS1DESCRIPTIVE ANALYSIS8Examining .docx
donaldp2
 
DESCRIPTIVE ANALYSIS1DESCRIPTIVE ANALYSIS8Examining .docx
DESCRIPTIVE ANALYSIS1DESCRIPTIVE ANALYSIS8Examining .docxDESCRIPTIVE ANALYSIS1DESCRIPTIVE ANALYSIS8Examining .docx
DESCRIPTIVE ANALYSIS1DESCRIPTIVE ANALYSIS8Examining .docx
carolinef5
 
Running head BUSN311 - Quantitative Methods and Analysis 1.docx
Running head  BUSN311 - Quantitative Methods and Analysis 1.docxRunning head  BUSN311 - Quantitative Methods and Analysis 1.docx
Running head BUSN311 - Quantitative Methods and Analysis 1.docx
joellemurphey
 
2016 Symposium Poster - statistics - Final
2016 Symposium Poster - statistics - Final2016 Symposium Poster - statistics - Final
2016 Symposium Poster - statistics - FinalBrian Lin
 
Data Analysis for Graduate Studies Summary
Data Analysis for Graduate Studies SummaryData Analysis for Graduate Studies Summary
Data Analysis for Graduate Studies Summary
KelvinNMhina
 

Similar to Seawell_Exam (20)

Sample Size Determination
Sample Size DeterminationSample Size Determination
Sample Size Determination
 
Between Black and White Population1. Comparing annual percent .docx
Between Black and White Population1. Comparing annual percent .docxBetween Black and White Population1. Comparing annual percent .docx
Between Black and White Population1. Comparing annual percent .docx
 
Spss software
Spss softwareSpss software
Spss software
 
Need a nonplagiarised paper and a form completed by 1006015 before.docx
Need a nonplagiarised paper and a form completed by 1006015 before.docxNeed a nonplagiarised paper and a form completed by 1006015 before.docx
Need a nonplagiarised paper and a form completed by 1006015 before.docx
 
Research Critique GuidelinesQuantitative StudyBackground of .docx
Research Critique GuidelinesQuantitative StudyBackground of .docxResearch Critique GuidelinesQuantitative StudyBackground of .docx
Research Critique GuidelinesQuantitative StudyBackground of .docx
 
BUS308 – Week 5 Lecture 1 A Different View Expected Ou.docx
BUS308 – Week 5 Lecture 1 A Different View Expected Ou.docxBUS308 – Week 5 Lecture 1 A Different View Expected Ou.docx
BUS308 – Week 5 Lecture 1 A Different View Expected Ou.docx
 
Statistical ProcessesCan descriptive statistical processes b.docx
Statistical ProcessesCan descriptive statistical processes b.docxStatistical ProcessesCan descriptive statistical processes b.docx
Statistical ProcessesCan descriptive statistical processes b.docx
 
Statistics  What you Need to KnowIntroductionOften, when peop.docx
Statistics  What you Need to KnowIntroductionOften, when peop.docxStatistics  What you Need to KnowIntroductionOften, when peop.docx
Statistics  What you Need to KnowIntroductionOften, when peop.docx
 
Week 6 DQ1. What is your research questionIs there a differen.docx
Week 6 DQ1. What is your research questionIs there a differen.docxWeek 6 DQ1. What is your research questionIs there a differen.docx
Week 6 DQ1. What is your research questionIs there a differen.docx
 
Research metholodogy report
Research metholodogy reportResearch metholodogy report
Research metholodogy report
 
Executive Program Practical Connection Assignment - 100 poin
Executive Program Practical Connection Assignment - 100 poinExecutive Program Practical Connection Assignment - 100 poin
Executive Program Practical Connection Assignment - 100 poin
 
When you are working on the Inferential Statistics Paper I want yo.docx
When you are working on the Inferential Statistics Paper I want yo.docxWhen you are working on the Inferential Statistics Paper I want yo.docx
When you are working on the Inferential Statistics Paper I want yo.docx
 
You clearly understand the concepts of this assignment. You’ve don.docx
You clearly understand the concepts of this assignment. You’ve don.docxYou clearly understand the concepts of this assignment. You’ve don.docx
You clearly understand the concepts of this assignment. You’ve don.docx
 
MELJUN CORTES research designing_research_methodology
MELJUN CORTES research designing_research_methodologyMELJUN CORTES research designing_research_methodology
MELJUN CORTES research designing_research_methodology
 
DESCRIPTIVE ANALYSIS1DESCRIPTIVE ANALYSIS8Examining .docx
DESCRIPTIVE ANALYSIS1DESCRIPTIVE ANALYSIS8Examining .docxDESCRIPTIVE ANALYSIS1DESCRIPTIVE ANALYSIS8Examining .docx
DESCRIPTIVE ANALYSIS1DESCRIPTIVE ANALYSIS8Examining .docx
 
DESCRIPTIVE ANALYSIS1DESCRIPTIVE ANALYSIS8Examining .docx
DESCRIPTIVE ANALYSIS1DESCRIPTIVE ANALYSIS8Examining .docxDESCRIPTIVE ANALYSIS1DESCRIPTIVE ANALYSIS8Examining .docx
DESCRIPTIVE ANALYSIS1DESCRIPTIVE ANALYSIS8Examining .docx
 
Running head BUSN311 - Quantitative Methods and Analysis 1.docx
Running head  BUSN311 - Quantitative Methods and Analysis 1.docxRunning head  BUSN311 - Quantitative Methods and Analysis 1.docx
Running head BUSN311 - Quantitative Methods and Analysis 1.docx
 
2016 Symposium Poster - statistics - Final
2016 Symposium Poster - statistics - Final2016 Symposium Poster - statistics - Final
2016 Symposium Poster - statistics - Final
 
Spring 2014 chapter 1
Spring 2014 chapter 1Spring 2014 chapter 1
Spring 2014 chapter 1
 
Data Analysis for Graduate Studies Summary
Data Analysis for Graduate Studies SummaryData Analysis for Graduate Studies Summary
Data Analysis for Graduate Studies Summary
 

Seawell_Exam

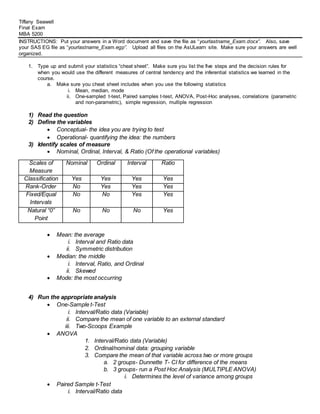
  • 1. Tiffany Seawell Final Exam MBA 5200 INSTRUCTIONS: Put your answers in a Word document and save the file as “yourlastname_Exam.docx”. Also, save your SAS EG file as “yourlastname_Exam.egp”. Upload all files on the AsULearn site. Make sure your answers are well organized. 1. Type up and submit your statistics “cheat sheet”. Make sure you list the five steps and the decision rules for when you would use the different measures of central tendency and the inferential statistics we learned in the course. a. Make sure you cheat sheet includes when you use the following statistics i. Mean, median, mode ii. One-sampled t-test, Paired samples t-test, ANOVA, Post-Hoc analyses, correlations (parametric and non-parametric), simple regression, multiple regression 1) Read the question 2) Define the variables  Conceptual- the idea you are trying to test  Operational- quantifying the idea: the numbers 3) Identify scales of measure  Nominal, Ordinal, Interval, & Ratio (Of the operational variables) Scales of Measure Nominal Ordinal Interval Ratio Classification Yes Yes Yes Yes Rank-Order No Yes Yes Yes Fixed/Equal Intervals No No Yes Yes Natural “0” Point No No No Yes  Mean: the average i. Interval and Ratio data ii. Symmetric distribution  Median: the middle i. Interval, Ratio, and Ordinal ii. Skewed  Mode: the most occurring 4) Run the appropriate analysis  One-Sample t-Test i. Interval/Ratio data (Variable) ii. Compare the mean of one variable to an external standard iii. Two-Scoops Example  ANOVA 1. Interval/Ratio data (Variable) 2. Ordinal/nominal data: grouping variable 3. Compare the mean of that variable across two or more groups a. 2 groups- Dunnette T- CI for difference of the means b. 3 groups- run a Post Hoc Analysis (MULTIPLE ANOVA) i. Determines the level of variance among groups  Paired Sample t-Test i. Interval/Ratio data
  • 2. ii. Compare the mean of two variables on the same metric (within the same group) iii. Before & After  Correlation Coefficient i. Interval/Ratio data (Pearson’s) ii. Ordinal data (Kendall or Spearman) iii. Linear relationship between two variables NOT on the same metric  Simple Regression i. One independent variable and one dependent variable ii. Must be continuous iii. Allows us to make a prediction  Multiple Regression i. Same as simple regression, but with two or more predictors. 5) Report the results 2. Why is statistical power more than just looking at the p-value? a. Make sure your answer includes a thorough discussion of effect size, confidence intervals, and what additional or redundant information effect size measures and confidence intervals provide to traditional ‘null hypothesis testing’ (i.e., p-values). b. Make sure your answer also includes a discussion of what a power analysis tell you, how statistical power and sample size are related (both conceptually and empirically), and why it is important to conduct a power analysis when conducting an inferential test. There are four ways to find statistical power: p-value, confidence intervals, effect size, and power. P-value is a measure that suggests whether or not it is possible that the mean of whatever variable relationship being examined could be 0. If the p-value is less than .05, then the mean is not 0 and I can reject the null hypothesis. If it is greater than .05, then the mean could be 0 and this means that there could be no relationship, and I cannot reject the null hypothesis. This is why statistical power important, because the p-value is not a great enough test to determine whether or not something is statistically significant. There are many cases in which a p-value could say that the relationship is significant, when it is not, because the p-value is extremely sensitive towards sample size. If the sample size is large enough, the p-value could show a relationship between anything. Vice versa, if a sample size is too small, an obvious relationship could be seen as not statistically significant if only the p-value is examined. The confidence intervals show the range that I can be 95% percent confident that the mean falls between. If this interval contains 0, then the information is not statistically significant. If the range is too wide, my confidence in the model would not be high because of the large amounts of options for the mean. If the interval is small, and there are a small amount of options for what the mean number could be, I am more confident in the significance. The effect size shows how much variance can be explained in the model. This is a standardized measure, so I can tell how well one population can be compared to another. If the effect size is small then there’s a small magnitude of difference between the variables, and if it is large (0.08), then there is a larger magnitude of difference. Finally, the power is the probably that I found a difference if one exists. It is extremely important to conduct a power analysis when conducting an inferential test so that one can a difference in the model, if one exists. Not being able to find an existing difference when there is one, or finding a difference when one does not exist, results in a failed experiment. INSTRUCTIONS: Use the “Exam.xlsx” file on AsuLearn and SAS EG to answer questions 3 to 5. See Exam Codebook for survey questions and responses. 3. The famous researcher, Dr. Doowutchalike, is looking to determine what factors influence students’ satisfaction with their college social life. She is proposing that the ability to manage stress and course difficulty will significantly relate to students’ report of their satisfaction with their college social life. Additionally, Dr. Doowutchalike is predicting that student’s level of social involvement will add to the prediction of satisfaction with their college social life. Is she correct?
  • 3. a. Assume that ratings scales (e.g., Not Satisfied to Extremely Satisfied; Not at all difficult to Extremely difficult; Very Poor to Very Good) are interval and write a short analysis plan (i.e., one sentence to one paragraph) that describes which statistical analysis or analyses you will use to answer the question and provide the rationale for why that statistic or those statistics are appropriate. The statistical analysis plan that was used to answer this question was Multiple Regression. This was the chosen plan because there are two or more predictors being used, manage stress and course difficulty, and then later there are three predictors once social involvement is added. This is also the ideal model because the data used is continuous, as each variable is a rating scale and therefore interval data. H0: Ability to manage stress and course difficulty will not significantly related to student’s satisfaction with their college life. HA: Ability to manage stress and course difficulty will significantly related to student’s satisfaction with their college life. b. Provide a write-up of your statistical results (include effect size and CIs) and a non-technical interpretation. Manage Stress M=3.45, SD=0.92, 95% CI [3.34, 3.55] Course Difficulty M=3.67, SD=0.92, 95% CI [3.57, 3.78] Social Life Satisfaction M=4.55, SD=1.32, 95% CI [4.40, 4.71] Social Involvement M=3.17, SD=0.99, 95% CI [3.06, 3.29] Regression Model F(2,289) = 11.13, p < .0001, R2 = 0.072 Mang_Stress= 0.19, p <.0008, 95% CI [0.08, 0.30], sr2=0.04 Class_Dif= 0.13, p <.0007, 95% CI [0.057, 0.21], sr2=0.04 Regression Model (After Adding Social Involvement) F(3,288) = 14.41, p < .0001, R2 = .13 Mang_Stress= 0.15, p <.0092, 95% CI [0.36, 0.25], sr2=0.03 Class_Dif= 0.12, p <.0015, 95% CI [0.47, 0.20], sr2=0.03 Social_Inv= 0.22, p <.0001, 95% CI [0.13, 0.33], sr2=0.06 The ability to manage stress and course difficulty does significantly relate to students’ report of their satisfaction with their college social life. After cleaning out some variables from the model that seemed to be outliers, I found that the removal did not make the model much better because there was no large mean difference when comparing the two models. However, since I removed them and no large difference was made either way, I decided to use the model without the outliers. According to the model, as social life satisfaction goes up by 1, manage stress goes up by 0.19, and class difficulty goes up by 0.13. While these numbers do not seem that large, they do make a difference for social life satisfaction. This can be supported by the fact that both variables are also statistically significant according to the p-values, which are both less than .05. This proves that the means of both are not 0, and makes me more confident in the model. The confidence intervals are both reassuring to me also, because the ranges are not that large. I am 95% confident that the mean for manage stress is between 0.08 and 0.30, and that the mean for class difficulty is between 0.057 and 0.21. This does not give much room for the mean to be different from what the model suggests. Since my r2 is 0.072, I know that my model explains 7.2% of the variance while the F-value of 11.13 suggests that there is 11 times more variance explained than not explained. The sr2 also shows that removing these predictors would change the r2 value by 0.04. These are not large, but they are a good amount of security for my model.
  • 4. Next, I ran a model where social involvement was added as a predictor. According to the model, as a report of satisfaction goes up by 1, social involvement goes up by 0.22, manage stress goes up by 0.15, and class difficulty goes up by 0.12. These are pretty significant numbers, and seem to have a decent effect on college social life satisfaction. This can be supported in multiple ways, one of which is that the p-value is less than .05 for each of the variables, meaning that mean is not 0 and that the numbers are significant. I can also be 95% confident that the mean of social involvement is somewhere between 0.13 and 0.33, manage stress mean between 0.36 and 0.25, and class difficulty between 0.47 and 0.20. These are important ranges because they are not very wide. If they were wide, I would not be as confident in the prediction because the mean could be many different numbers. Since these ranges are small, I am more confident that the predicted means are correct. The F-value shows that the model can also explain 14 times more variance than it leaves behind, and the r2 of 0.13 shows that 13% of variance can be explained. The sr2 for manage stress and class difference is 0.03, and 0.06 for social involvement. This tells me that the r2 will change by 0.03 and 0.06 if these predictors are removed. Compared to the last model, it is clear that social involvement does make a difference in the social life satisfaction as almost all of the numbers I have used to prove whether or not there is a relationship between the predictors and social life satisfaction were made better. After analyzing both models, I am choosing to reject the null hypothesis and accept the alternative hypothesis. By doing so, I am agreeing with Dr. Doowutchalike, that manage stress and course difficulty do significantly relate to students’ report of their satisfaction with their college social life and also that the student’s level of social involvement does add to the prediction of satisfaction with their college social life. c. Are you concerned about the redundancy of the predictors? Make sure your answer is supported by empirical evidence. I am not concerned with redundancy in my predictors, because there is not any. In my first model, the VIF (Variance Inflation) is 1.00 for both manage stress and class difficulty. This means that there is no overlap between the two groups, and overlap would represent redundancy. In the second model, the one that included social involvement, the variables social involvement and manage stress had VIF scores of 1.04, and class difficulty had a VIF score of 1.00. Once again, these scores show that there is no overlap and therefore no redundancies. d. Which predictor is contributing most to the prediction of the outcome? Make sure your answer is supported by empirical evidence. The predictor that is contributing the most to the prediction of the outcome of social life satisfaction is social involvement. The sr2 for social involvement was 0.06, meaning that since it was added to the prediction model, the r2 value was improved by 6%, and removing this predictor would worsen the r2 by 6%. This is the highest sr2 of any predictor from both models, making social involvement the variable that is contributing the most. 4. Do students in the sample spend more nights during the school year studying or partying? a. Write a short analysis plan (i.e., one sentence to one paragraph) that describes which statistical analysis or analyses you will use to answer the question and provide the rationale for why that statistic or those statistics are appropriate. The statistical analysis that I used to answer this question was the Paired Sample t-Test. I chose this analysis because I need to compare the mean of two variables, study and party, and they are on the same metric of data, ratio. These meet the qualifications of using a Paired Sample t-Test where one must be comparing the means, before and after, of two variables on the same metric and within the same group of either interval or ratio data. H0: Students do not spend more nights of the school year partying or studying HA: Students spend more nights of the school year partying than studying Students spend more nights of the school year studying than partying
  • 5. b. Provide a write-up of your statistical results (include effect size and CIs) and a non-technical interpretation. Study: M=3.77; SD=2.33; 95% CI [3.51; 4.04] Party: M=3.34; SD=2.37; 95% CI [3.08; 3.61] MDiff T1-T2 = -0.44; 95% CI [0.04; 0.85] Inferential Stats: t(299)= -2.11, p=0.04, d=0.18, power=0.61 c. How much do you trust the results of your analyses? That is, could you have made a Type I or Type II error? How strong are the effects that you found? To decide whether or not students spend more time studying or partying, or that there is no difference in the times spent doing both, I first looked at the p-value. This value was less than .05, showing that the mean is not 0 and that the data is significant. However, since it was .04, and this is so close to .05, I do believe that it is significant, but not as significant as it should be for me to have a high amount of confidence that the mean is not 0. The numbers for the variables of study and party are extremely similar. The mean of study is 3.77, and the mean of party is 3.34. The standard deviations of the variables study and party are 2.33 and 2.37. Both of these sets of numbers are so close, it is hard to say that students spend more time doing one or the other. The confidence intervals are also a small range and close. I am 95% confident that the mean of study falls somewhere between 3.51 and 4.04, and that the mean of party falls somewhere between 3.08 and 3.61. In both of these intervals, there is not a large option of means because the numbers are so close. Also, in both of the intervals, it is possible for the mean of both groups to be somewhere between 3.51 and 3.61, meaning that the groups could potentially have the same mean. Although there is a mean difference of -0.44 (the fact that this number is negative is not significant, it is only negative because of the order the variables are in my model,) this is not large enough for me to believe that there is a significant difference between the two means, especially after exploring the confidence intervals. Also, since the effect size is so small, only 0.18, I can see that there is a small magnitude of difference between the two groups. With a power of 0.61, there is a 39% chance that I made a type II error. Therefore, I cannot trust my results. For all of these reasons, I will have to accept the null hypothesis, that students do not spend any more time studying than they do partying, and vice versa. There is no difference between the amount of time that students spend partying and studying. 5. Dr. Acula wants to examine if students’ year in school is related to how students report the average amount of negative emotions they have. He believes that seniors will experience more negative emotions compared to sophomore and juniors, but fewer than freshmen. He also believe that sophomore and juniors will have the same amount of negative compared to one another. Is. Dr. Acula correct? a. Write a short analysis plan (i.e., one sentence to one paragraph) that describes which statistical analysis or analyses you will use to answer the question and provide the rationale for why that statistic or those statistics are appropriate. i. Hint: You will have to compute a new variable to answer this question To answer this question, I ran a One-Way ANOVA with Post Hoc analysis. I chose this analysis plan because I am comparing the means of the new variable of negative emotions is interval data, and that is being grouped by students’ year in college, ordinal data. H0= There is no difference in negative emotions amongst the different years in college. HA= There is a difference in the negative emotions between the different years in college. b. Provide a write-up of your statistical results (include effect size and CIs) and a non-technical interpretation. Negative Emotions: M=2.14, SD=0.65, 95% CI [2.07, 2.22]
  • 6. Freshman: M=2.10, SD=0.53, 95% CI [1.95, 2.26] Sophomore: M=2.28, SD=0.72, 95% CI [2.14, 2.42] Junior: M=2.04, SD=0.56, 95% CI [1.93, 2.15] Senior: M=2.10, SD=0.74, 95% CI [1.91, 2.30] F(3,296)= 2.49, p= 0.06, R2= 0.02 When trying to decide where or not a students’ year in school is related to how students report the average amount of negative emotions they have, I had to analyze the statistical results from the One-Way ANOVA. The p-value shows that there is a possibility that the mean could be 0, because it is not less than 0.05, meaning that there is most likely no difference between the groups. The r2 value was also extremely small, only 0.02. This small of a r2 value suggests that only 2% of the variances in the model can be explained. This leaves 98% of unexplained variances, which is an extremely large amount. The f-value is also small, 2.49, meaning that the model can explain 2.49 times the amount of variance than it cannot explain. This is also a very small number. With this analysis, I do not believe that the information is statistically significant and therefore, cannot be trusted. This information allows me to come to the conclusion that I must accept the null hypothesis that there is no difference between the students’ college year and how many negative emotions they have. When running a One-Way ANOVA, I would usually run a Post Hoc to find the differences between the groups; but after evaluating the One-Way ANOVA results, and finding that I was unable to reject the null hypothesis, I was also concluding that there is no difference in the relationship between years and negative emotions. Because of this, any information found on a Post Hoc analysis would be useless because the model cannot be trusted.