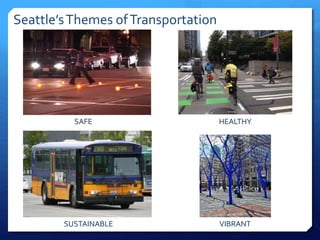
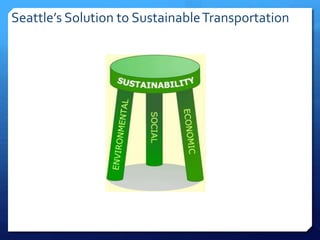
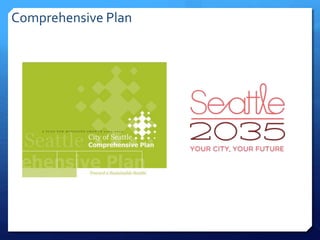
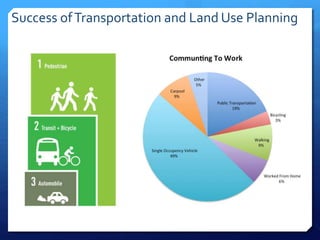
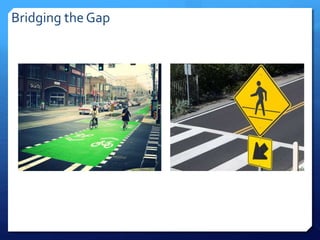
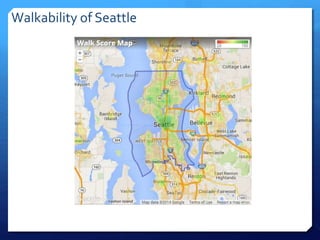
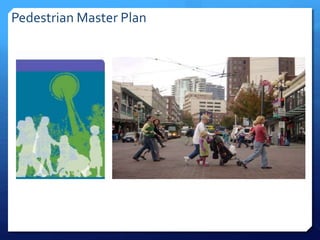
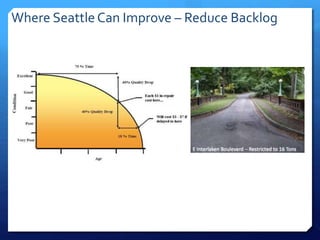
Emily Pearl
Kaitlin Seidensticker
Ryan Hawkins
Conor Search
Nicholas McNulty
Seattle’sThemes ofTransportation
SAFE HEALTHY
SUSTAINABLE VIBRANT
Seattle’s Solution to SustainableTransportation
Comprehensive Plan
Protecting the Biosphere
ClimateAction Plan
Success ofTransportation and Land Use Planning
Seattle Is Not Auto-dependent
In Motion Program
One Less Car Challenge
Bridging the Gap
Walkability of Seattle
Pedestrian Master Plan
Bicycle Master Plan
Neighborhood Greenways
Accessibility
Proposed Mixed-use street
design
Downtown Seattle
TransitTunnel
Connectivity
Every 15 Minutes (or Less)
Failures – Seattle Monorail Project
TransportationValue
Where SeattleCan Improve – Reduce Backlog
Where SeattleCan Improve – Bridge Repair
• http://www.seattle.gov/council/issues/carbon_neutrality.htm
• http://conlin.seattle.gov/2011/12/13/carbon-neutral-blog-post-15-it’s-
technically-possible/
• http://www.citylab.com/commute/2014/04/cutting-car-reliance-one-trip-
time-seattle/8822/
• http://www.census.gov/newsroom/press-releases/2014/cb14-r10.html#
• http://www.seattle.gov/dpd/cityplanning/completeprojectslist/comprehen
siveplan/whatwhy/default.htm
• http://www.seattle.gov/transportation/sdot_can.htm#
• http://www.seattle.gov/environment/
• http://realchangenews.org/index.php/site/archives/8045
Works Cited

Seattle 3

Editor's Notes

  • #3 State themes and goals to create an effective transportation and land use system Themes             -Safe             -Healthy             -Sustainable             -Vibrant Core principles: keeping Seattle safe, building healthy communities, support a thriving economy, provide great service, and focus on the basics in order to connect people, places and products
  • #4 Seattle’s solution to sustainable transportation system is based on the three legged stool model which is made up of a triad of economic, social, and environmental sustainability Through this model Seattle aims to … - create livable and walk-able communities through effective land use planning - provide transportation choices to limit the number of vehicles on the road - encourage people to use those transportation choices, and to be part of the solution
  • #5 Seattle’s Comprehensive Plan Is a 20 year vision plan and roadmap towards building a sustainable Seattle Serves as a guide for deciding where to build new jobs and houses, as well as how to improve their transportation system This plan Focuses on how to grow while preserving and improving neighborhoods, the quality of life, and economic development, while also protecting the environment
  • #6 Protecting the biosphere is the bottom-line for sustainability Seattle is protecting the biosphere through their goal of becoming Carbon Neutral by 2050 (which means that they would remove as much carbon dioxide from the atmosphere as they put in to it) the climate action plan is Seattle’s first step towards reaching this goal
  • #7 Climate Action Plan follows the Green Agenda by focusing on how urban-based production, consumption, and waste generation contributes to global climate change and resource depletion. Deals mainly with road transportation, building energy and waste The emission targets Seattle has set are some of the most aggressive targets amongst cities in the world Some of these objectives include .. Reduce automobile travel by 50% through implementing strategies to develop and promote ride sharing, transit, walking and bicycling Reduce energy use in buildings and vehicles by 50% per occupant in residential buildings, per square foot in commercial buildings and per mile in vehicles Use less carbon sources for homes, businesses, and vehicles and using renewable generated electricity or hydrogen with biofuels which increases Seattle’s fuel efficiency
  • #8 Seattle has already proven to be successful towards reaching their sustainability goals for transportation and land use planning through the climate action plan by implementing strategies to improve access. There has been already been a … 27% inc in pedestrians and 64% inc in biking since 2011 In 2014 it was reported that for workers in Seattle… 18.5% took public transportation 3.4% biked 9.1% walked 6.3% worked from home 49% commute to work in a single occupancy vehicle (goal is 42% by 2020) 9% Carpool Single occupancy vehicles have decreased while the other means of transportation have increased
  • #9 In 2014 the average travel time to work was 25.1 minutes, which shows that Seattle is not Auto-dependent based on Peter Newman’s definition of auto-dependency -definition is that a city is auto dependent if a thirty minute average journey to work is attainable only by car Seattle has been implementing different programs to continue to reduce the amount of cars on the road
  • #10 In Motion Program - The purpose of this program is to help promote residents to try sustainable forms of transportation in place of driving Ask people to reduce their drive-alone trips by 20% for an average of twelve weeks Incentives are given to participants such as fare passes, discounts on car-share memberships or bike shop purchases and special offers from local businesses As a result, other forms of transportation such as busing, biking, ridesharing and walking increase Since the program began, vehicle travel has been reduced by 2.4 million miles, saved 117,037 gallons of gas and saved 1,029 tons of CO2 Per in Motion Participant, 182 miles, saved 9 gallons of gas and saved 1,175 pounds of CO2
  • #11 One Less Car Challenge Encourages drivers to try life with one less car Level 1 – participants park their car for a month Level 2 – sell or donate their vehicle, agreeing not to replace it for a full year Incentives for this program include flexcar credits, which is similar to the zipcar Level 1 participants can ear up to $100 in flexcar credits and level 2 participants can earn up to $600 in flexcar credits In 2007 Level 2 participants grew from 30 to 146 with 10-20 people applying every week
  • #12 16% of Seattle households do not have a motor vehicle for their use. Providing transportation options for these people may include walking, riding a bike, taking transit or carpooling.
  • #13 Walk Score 71 8th among US Cities Pedestrian Master Plan Goal: Become the most walkable city Safe for pedestrians Pedestrian Lighting Plan/Crosswalks and Signage
  • #15 Bike Score: 64 7th among US Cities 2007 Seattle adopted the Bicycle Master Plan Encourage and accommodate more people to ride bikes
  • #17 -King County Metro alone has 209 bus routes with 8521 stops throughout king county -In addition, Light rail and RapidRide lines it makes Seattle’s transit system the 8th largest in the nation -Seattle has adhered to Walkers 7 principles to excellent transportation -This illustrates “It takes me where I want to go” (location/frequency of stops)
  • #18 -Seattle’s been focusing on connectivity between different transit systems -Implementing mixed use street designs -Gives people ability to transfer between modes of transit -DSTT another good example of this -Incorporates both bus and light rail -This gives the rider the freedom to change plans without having to worry about transportation
  • #19 -In 2012 Seattle redesigned transit map to focus more on frequency -Map showing which bus and rail routes have service every 15 minutes or less -These services run from 6am to 6pm on weekdays, with selective service on weekends -”It takes me when I want to go”
  • #20 -Proposed 5 line extension to Seattle Center Monorail -Planning for the project took place from 1997-2005 -Project was to be funded by an annual motor-vehicle excise tax -Revenue from taxes was 30% under projections while cost rose 10% -Project was abandoned in 2008 costing Seattle taxpayers $124.7 million
  • #26 References