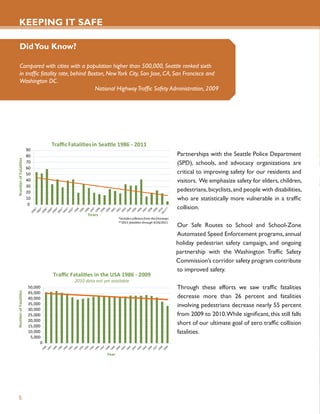
The Seattle Department of Transportation aims to improve safety for all users of the transportation system. SDOT's policies and actions focus on engineering safer infrastructure, educating travelers, and enforcing traffic laws. Specific strategies include implementing road designs and traffic controls proven to reduce collisions, conducting safety reviews at high-collision locations, supporting lower speed limits, and continuing the recommendations from the 2011 Road Safety Summit to achieve the goal of zero traffic fatalities and serious injuries. SDOT measures success based on reductions in collisions, fatalities, and speeds above the limit. Partnerships with other organizations are important to safety education and enforcement efforts.
3. TABLE of CONTENTS
Message from the Mayor i
Message from the Director ii
Introduction 1
Keeping it Safe 3
Focusing on the Basics 13
Building Healthy Communities 21
Supporting a Thriving Economy 29
Providing Great Service 37
Organizational Chart 44
By the Numbers 45
MISSION STATEMENT
To deliver a safe, reliable, efficient, and socially equitable
transportation system that enhances Seattle’s environment
and economic vitality.
4. MESSAGE from the
MAYOR
Dear friends,
Our streets are more than a transportation system. They are the canvas on which we build a great
place to live. Streets provide mobility and access to homes, jobs, education, and services. They also
reflect our values, allowing us to support our neighborhoods, address global warming, and build
healthy communities.
Seattle’s transportation policies should support those priorities. To do that, the Seattle Department
of Transportation (SDOT) has developed this Action Agenda. It lays out a clear set of policies and
actions the department will advance over the next two years. In a time of tight budgets, we have to
focus our efforts on actions that yield the biggest returns. We want you to know what we’re working
on, what we prioritize, and how we will get it done.
Our transportation system has to help the city accomplish a variety of goals – providing
safe, affordable, and efficient means of travel; improving the transit connections between our
neighborhoods; offering healthy choices like walking and biking; reducing our environmental impact;
and supporting economic development and sustainable growth. Successful stewardship of the system
requires thoughtful, deliberate, and strategic action.
I look forward to working with SDOT, the City Council, and the public to achieve our goals. I
encourage you to read the Action Agenda and share your comments with me and SDOT. Together,
we will protect what makes Seattle great and build a safe, healthy, thriving community.
Sincerely,
Mike McGinn
Mayor of Seattle
i
5. MESSAGE from the
DIRECTOR
Dear fellow Seattleites,
The Seattle Department of Transportation is charged with the responsibility for keeping the
transportation system working for all who live, work, and visit this great city. This Action Agenda
describes how SDOT intends to carry out this responsibility.
Making the transportation system work for everyone is a complex job that becomes even more of a
challenge in times of financial hardship.
In addition, SDOT is part of a larger community working to improve the transportation system and
affect public behavior. We rely on strong partnerships with transit agencies and state entities to
enact change. For example, while we can help make buses run more reliably by improving streets and
signals, it is King County Metro that ultimately delivers the service. There are many factors at play,
and while we are not always in full control of the transportation network, we will continue to work
with our partners.
We must keep our city moving, and we are up for the challenge. The Action Agenda makes our work
easy to understand and lets you know what we intend to accomplish over the next two years.
With a shrinking budget, we’ve worked hard to adjust to our lower revenues and to focus on what
is most vital to keep our streets safe, our infrastructure in shape, to enhance our communities and
businesses, to involve the public and to spend your money wisely.
This document reflects my best thinking and that of my staff. It demonstrates the values of our
mayor and council and what we have consistently heard from residents and businesses at many
venues. I welcome your thoughts and ideas as we go forward.
Sincerely,
Peter Hahn
Director, Seattle Department of Transportation
ii
6. INTRODUCTION
Every day, people count on Seattle’s transportation system to get to places for work, shopping, play, or learning
– and then to get them home again. While connecting people, places, and products is the core mission of a
transportation system, it provides so much more than just mobility. A robust transportation system can:
• Enable people to pursue opportunities by providing ready and affordable access to jobs, education,
housing, and cultural activities
• Power our economy by moving goods and enhancing the attractiveness of business districts
• Improve health by making it easier to walk, bike, and ride transit
• Build community by inviting people to linger and enjoy places that contribute to neighborhood
character
• Empower people by offering safe, efficient, and equitable choices for how and when to travel
• Improve our environment and address climate change through low-carbon travel options and the
nurturing of trees, greenery, and urban wildlife in street rights of ways
In Seattle, we want people of all abilities – from our 5-year old kids to our 80-year old grandparents – to be
comfortable moving about the city, whether on foot, by bike, riding transit, or driving a car.
In addition to relying on roads, sidewalks, and trails for our travel paths, we can make efficient, affordable, and
safe travel choices available through programs that educate, encourage, and provide timely information. We
ensure that quality services and facilities won’t be limited to those who can afford and choose to own a car.
Of course, there are challenges. Transportation rights of way comprise nearly 27 percent of Seattle’s land area,
and pedestrians, bicycles, buses, cars, and trucks all compete for that limited space. Vehicles moving within this
street space account for 40 percent of Seattle’s greenhouse gas emissions, making transportation the primary
climate change culprit.
Luckily, the transportation system also provides us with the opportunity to address these challenges head on.
By offering people more choices, we can decrease the demand on our streets and reduce our impact on the
environment. In doing so, we can build a network that supports healthy and sustainable communities, keeps
more money in people’s pockets, increases economic competitiveness, and adds to the character of our great
city.
All of these conditions require significant investments and new solutions to meet our current and future
transportation needs. The challenge is to do so in a manner that meets our residents’ expectations for
physical and economic well-being, while dealing with finite spaces and limited financial resources.
1
7. This document outlines a set of policies, actions, and measures of success that SDOT will use to achieve these
ends. It is organized around five core principles:
1. Keeping it Safe: Safety is SDOT’s number one priority. We are committed to improving safety for all
users of the transportation system and reducing the number of fatalities and injuries.
2. Focusing on the Basics: Making sure our streets, sidewalks, and bridges are in good condition is vital
to the success and safety of our city. We’re focused on maintaining and enhancing infrastructure in a way
that promotes long-term fiscal and environmental stewardship.
3. Building Healthy Communities: Neighborhoods are the core of our city. SDOT is dedicated to
developing an equitable transportation system that offers healthy travel choices and great public spaces.
4. Supporting a Thriving Economy: The efficient movement of people and goods is essential to economic
vitality. A robust transportation network can reduce household transportation costs by providing efficient
and practical alternatives to driving, enhance our quality of life, and draw new businesses and visitors to
our city.
5. Providing Great Service: A solid workforce is essential to carrying out the first four principles. We
strive to be good financial stewards, deliver services equitably, and engage all parts of the community in
our work.
2
8. Laying the Groundwork for
KEEPING
IT SAFE Engineer, educate, enforce, and evaluate.
Safety is SDOT’s most important priority.
Our long-term goal is a city with zero
traffic fatalities and serious injuries.
3
9. As one of the leading causes of death for younger people (ages 5 to 34), road safety is a public health concern.
This is one of the reasons that safety is our number one priority.
People also expect to feel safe and comfortable as they are out and about on Seattle’s streets, sidewalks, and
trails. Well-placed investments that improve safety for our most vulnerable road users can encourage more
people to try getting around on people power, especially for short trips. Additionally, safer streets are efficient
streets. They have fewer and less severe collisions, allowing everyone to get where they are going safely and with
less hassle.
Seattle has made substantial progress toward improving safety for the traveling public. The number of traffic
collisions is steadily decreasing, a trend that is much more pronounced here than in national figures. Something
good is happening in our city – it may be a combination of improved engineering, smart investments, alert
travelers, and better enforcement.
Seattle has long been a leader in innovative transportation and traffic engineering, including the kinds of things
that make our streets safer and more efficient for everyone. We were one of the first cities in the country to
routinely deploy pedestrian countdown signals, bicycle sharrows, green bike lanes, and bike boxes. These newer
methods make it easier and safer for people to get around in Seattle. We’ve found, however, that not everyone
knows how these newer tools work, nor is everyone following the rules.To that end, we’re working on educating
the public and improving overall awareness.
Our 30-year old neighborhood traffic calming program has served as the model for programs in other cities.We
have built thousands of traffic circles, speed humps, and other traffic calming measures that have made reported
residential street collisions a rarity. SDOT also recently deployed a small-scale social marketing tool kit for
neighborhoods that want to raise awareness about speed on their streets, including yard signs and intersection
repair. As part of our continuous improvement efforts, we are committed to evaluating physical changes in our
street and safety programs to learn more about what works to reduce collisions.
Keeping residents and visitors safe also means we must be prepared to respond to emergencies. SDOT’s Winter
Weather Plan is one example of our efforts to ensure we’re ready for inclement weather incidents.
4
10. KEEPING IT SAFE
Did You Know?
Compared with cities with a population higher than 500,000, Seattle ranked sixth
in traffic fatality rate, behind Boston, New York City, San Jose, CA, San Francisco and
Washington DC.
National Highway Traffic Safety Administration, 2009
90
80 Partnerships with the Seattle Police Department
70 (SPD), schools, and advocacy organizations are
60
50 critical to improving safety for our residents and
40 visitors. We emphasize safety for elders, children,
30
20 pedestrians, bicyclists, and people with disabilities,
10 who are statistically more vulnerable in a traffic
0
collision.
Years
Our Safe Routes to School and School-Zone
Automated Speed Enforcement programs, annual
holiday pedestrian safety campaign, and ongoing
partnership with the Washington Traffic Safety
Commission’s corridor safety program contribute
to improved safety.
50,000 Through these efforts we saw traffic fatalities
45,000
40,000 decrease more than 26 percent and fatalities
35,000 involving pedestrians decrease nearly 55 percent
30,000
25,000 from 2009 to 2010. While significant, this still falls
20,000
15,000
short of our ultimate goal of zero traffic collision
10,000 fatalities.
5,000
0
Year
5
11. Road Safety Summit
In late 2011, Mayor McGinn and members of the Seattle City Council convened a Road Safety Summit to collect
public input and review data about the safety of our streets.They assembled a working group made up of elected
offi cials, major employers, advocates, business leaders, and community leaders to help determine next steps for
road safety in Seattle. Through public meetings and an online survey, the city received over 3,000 comments and
suggestions.
Using these comments and their expertise, the working group recommended that the city and community
partners develop a long-term, sustained campaign with the long-term vision of zero traffi c fatalities and serious
injuries on our roads.
The city is currently developing strategies to achieve these goals using a multi-pronged approach consisting of
education, enforcement, engineering, evaluation, and empathy. In order to be successful, this effort will rely on a
larger community of people that are committed to creating a lasting change on Seattle roads.
The policies and actions listed in sections one through three of “Keeping it Safe” are all supportive of the Road
Safety Summit effort. Later in 2012, more actions will be identified citywide (not just through SDOT) that will
help get us move closer toward our long-term goal of zero traffic fatalities and serious injuries.
Keeping it Safe 6
12. POLICIES and ACTIONS
Reduce collisions for all modes and work
toward zero fatalities and serious injuries
• Perform engineering reviews at all traffic fatality and high collision
locations
• Implement roadway design features and traffic controls that have been
demonstrated to reduce collisions and their severity
• Implement measures to calm traffic and reduce speeds on streets where
excessive volumes and speeds warrant traffic calming
• Support changes to lower non-arterial speed limits and increase penalties
for motorists who cause a collision with pedestrians or bicyclists
• Use intelligent transportation system (ITS) technology to provide
real-time information that alerts roadway users of traffic incidents
• Implement safety spot improvements as funds support
• Continue to develop and implement the recommendations from the
Road Safety Summit
Fatalities on Seattle Streets by Mode
60
Bicyclist
50 Pedestrian
Motorcyclist
40
Motorist
30
20
Thru
10 9/20
0
Year
7 Keeping it Safe
13. Improving Safety on Nickerson Street
In August 2010, we reconfigured the travel lanes
on Nickerson Street (from 13th Avenue West
to Florentia Street) to improve pedestrian
safety and increase driver compliance with
the speed limit. We added two new marked
crosswalks and monitored traffic speeds over the
next year.
The year following the rechannelization saw a
23 percent reduction in collisions over the
preceding five-year average. The project
improved traffic safety by dramatically reducing
the percent of drivers traveling more than 10
miles per hour over the speed limit. The percent
of drivers traveling over the speed limit has been
reduced by more than 60 percent, and top-end
speeders have fallen by 90 percent. Meanwhile,
traffic volume remains roughly the same as it was
before the rechannelization, with no evidence of
traffic diversion.
MEASURE 2010 BASELINE 2014 GOAL
Collisions per 1M vehicle miles traveled 60 56
Number of collisions 11,913 <11,000
Number of fatalities 19 <10
Pedestrian collisions per 100,000 residents 87 <75
Keeping it Safe 8
14. POLICIES and ACTIONS
Educate the traveling public to respect
and protect one another
• Invest in education measures that increase mutual awareness
among motorists, pedestrians, and bicyclists
• Continue to work with Seattle Police Department to use
enforcement measures that keep traffic at or below the speed
limit
• Replace all pedestrian signal heads with countdown-style heads
• Continue SDOT’s Holiday Pedestrian Safety Campaign
• Continue to implement the Safe Routes to Schools program
• Continue to develop and implement the recommendations from
the Road Safety Summit
MEASURE 2010 BASELINE 2014 GOAL
Percent of elementary schools participating in 30% 56%
Safe Routes to School
Percent of identified corridors where 85th 30% 40%
percentile speeds are at or below speed limit*
Percent of signals with countdown-style heads 24%** 35%
*Identified corridors include Aurora Ave N, Stone Way N, 24th Ave NW, Rainier Ave S, and Fauntleroy Way SW. 85th percentile
refers to the speed at which 85 percent of motorists are traveling at, or below.
**2011 baseline
11
9 Keeping it Safe
15. POLICIES and ACTIONS
Minimize conflicts in the right of way to
accommodate all travelers
• Coordinate use of the right of way for all major activities and
permitted uses
• Inspect all permitted work to ensure safety and accessibility
standards are met
• Encourage private contractors and partner agencies to achieve
permit compliance by providing a process that is more efficient
and predictable
• Work with the Department of Planning and Development to
enforce code-required clearances for privately maintained trees
and other encroachments in the sidewalk and right of way
• Maintain code-required clearances over roadways and sidewalks
on all SDOT-owned trees
MEASURE 2010 BASELINE 2014 GOAL
Percent of Street Improvement Plans 70% 70%
reviewed within 6 weeks
Average wait times for walk-in customers
for over-the-counter Street Use permits <15 <15
(minutes)
Number of SDOT-owned street trees 1,000 1,215
pruned to address height clearances
Aurora Traffic Safety Corridor
Between April 2005 and March 2008, there were 1,581 collisions on Aurora Avenue – that’s more than 40
per month. SDOT began a two-year safety corridor project in June 2009. Washington Traffic Safety Commission
provided funding for the public education component of the project, managed the Seattle Police Department and
Washington State Patrol overtime funds, and are the main drivers of the Corridor Safety Program. The goal was
to reduce collisions by 25 percent.
We installed new curb ramps, radar speed signs, reflective pavement markers, and crosswalks and launched an
education campaign. Collisions have decreased 20 percent.
Keeping it Safe 10
16. POLICIES and ACTIONS
Be ready to respond to emergencies
• Conduct regular and ongoing training for all Incident Management
Team staff and crews
• Ensure that resources are in place to meet anticipated incident
demands, such as wind, snow, downed trees and ice events
• Participate in regional emergency preparedness exercises and
drills
• Perform seismic upgrades to bridges and roadway structures
• Analyze landslide prone areas and develop mitigation projects
• Expand the intelligent transportation systems network to respond
to emergencies and incidents
• Increase public awareness of the Winter Weather plan
MEASURE 2010 BASELINE 2014 GOAL
Percent of incident management staff 70% 75%
completing 24 hours of annual training
Percent of high-priority bridges that
have undergone seismic retrofits 40% 53%
Number of Winter Weather brochures
distributed and downloaded 47,700* 52,600
*2011 baseline
11 Keeping it Safe
17. Winter Weather Plan
Here in Seattle, some winters bring heavy snowfall and other years see no snow accumulation at all. A weather
phenomenon called the Puget Sound Convergence Zone causes some parts of the city to get inches of snow,
while other parts get rain or even sun.
Steep topography, like the Queen Anne Counterbalance, First Hill and the intersection of 35th Avenue SW and
Avalon Way, add to the complexity of snow fighting in Seattle. Hills can consume lots of time and effort and still
not be drivable. A few stuck cars can tie up an important arterial for hours. SDOT commits to clearing snow
from identified routes throughout the city within a specified time frame.We’ve developed a map that shows what
streets we’ll plow first - our top priority is to maintain emergency vehicle access.
We commit to using all the tools at our disposal to make sure that the people of Seattle as well as our interagency
partners are fully informed and involved in our snow response. SDOT and King County Metro have worked
together to ensure that bus routes will be clear. People will be able to get around the city by bus, making it easier
to leave their cars at home. Property owners, both in residential and business areas, are responsible for shoveling
their sidewalks and steps.
Did You Know?
Throughout the January 2012 snow storm, SDOT dispatched 22 pedestrian crews to downtown and
various business districts to apply deicer and shovel snow and ice from over 2,000 sidewalk landings and
public stairs.
In total, over 55,000 gallons of anti-icing magnesium chloride was applied, 3,373 tons of rock salt was
used, and 5,015 labor hours clocked.
Keeping it Safe 12
18. Laying the Groundwork for
FOCUSING ON
THE BASICS
Maintain, protect, preserve, and enhance our capital assets.
The public trusts SDOT to be the steward of the
right of way. Being a good steward means that we
must have reliable information, make wise decisions
about how limited resources are spent, and get the
best value from the public’s transportation dollars.
13
19. SDOT manages and maintains over $13 billion in transportation assets. From substantial and long-lasting structures
such as bridges, roadway pavement and sidewalks, to smaller, more frequently maintained assets like signs, street
trees, traffic signals, bike racks, and marked crosswalks – we are responsible for it all.
Focusing on the basics is about maintaining, preserving, and protecting our transportation infrastructure. It’s also
about looking for opportunities to enhance, expand, and improve our system. For example, SDOT is focused on
repairing existing sidewalks and building new sidewalks to make it easier for more people to walk.
And as we build new or repair existing assets, we look for ways to reduce our impact on the planet, especially
because the transportation sector is the primary contributor to local greenhouse gas emissions. Reducing
greenhouse gas emissions is a basic underpinning of the work we do as a transportation agency to help the city
reach its commitment of carbon neutrality by 2050. Through our internal environmental management system,
GreenDOT, we can maximize the environmental benefits of our projects and contribute to a healthier city.
In 2011, we filled over 25,000 potholes, repaired 25 blocks of sidewalk, planted over 800 street trees, restriped
1,100 lanes miles of pavement. and installed 15 miles of bike lanes and sharrows. We also issued nearly 19,000
permits – for sidewalk cafes and new street improvements projects – to ensure that work in the right of way
was done safely and that projects were built sustainably.
To keep infrastructure in the best condition possible and prolong its useful life, we must make regular investments
in preventive maintenance. Over the years, a backlog of deferred maintenance has amassed, and the inventory
has grown. Even though Seattle is in better financial shape than many cities in the nation—especially due to the
voter-approved Bridging the Gap transportation levy—the needs far outweigh available dollars.
When simple repair is no longer an option and full reconstruction is necessary, costs escalate substantially. With
regular maintenance, a well-built road can easily last nearly a century, while one deprived of maintenance will
have one-third the lifetime.
To make the best investments possible, SDOT has an asset management program—an industry “best practice”
that enables us to assess, maintain and track the quality, costs and value of our infrastructure. This information
allows us to make informed decisions on the highest priorities for maintenance before the asset requires high
cost reconstruction or full replacement.
SDOT continues to focus on the basics by maintaining what we have and planning for the future. We are fine
tuning our systems to address backlogs while building new infrastructure to keep people and goods moving,
and to enhance the overall built environment of the city. As we do so, we’re also improving our work through
programs that utilize new technologies, encourage community interaction, and celebrate creativity. We take
our stewardship role seriously and are dedicated to creating and maintaining a truly sustainable transportation
system.
14
20. POLICIES and ACTIONS
Build and maintain transportation
infrastructure to meet the latest standards
• Continue to invest in street paving projects and major maintenance
programs
• Respond to pothole and sidewalk shim requests in a timely manner
• Maximize the life cycle of new construction projects
• Regularly maintain crosswalk markings
• Regularly inspect bridges and roadway structures and prioritize
maintenance operations
• Remove graffiti on signs, traffic signals, and parking pay stations
• Ensure accountability for timely and high-quality repair of street
restorations
• Optimize traffic signal corridors, taking into account the needs of all
modes
• Continue replacing street signs
• Continue replacing roadside safety devices, such as guard rails and crash
cushions
Did You Know?
You can report a pothole online or by calling (206) 684-ROAD, and track the status of
your request on SDOT’s Pothole Map at http://www.seattle.gov/transportation/potholes.
15 Focusing on the Basics
21. 15th Ave NE Paving Project
In 2011, we rebuilt 15th Avenue NE between NE Pacific
and NE 50th streets with new concrete pavement and
resurfaced the roadway between NE 50th and NE 55th
streets with asphalt.
The project team also installed 52 curb ramps to improve
accessibility, placed 6 new bus shelters, installed 4 new
pedestrian lights, 7 new street light poles, and 16 new
stormwater catch basins to improve water quality, and
rebuilt nearly 6,500 linear feet of sidewalk.
MEASURE 2010 BASELINE 2014 GOAL
Percent of pothole repair and sidewalk 59% 80%
shim requests responded to within
3 business days
Percent of street name sign replacement 67% 95%
program completed
Percent of reported graffiti removed 95% 95%
within 6 business days
Focusing on the Basics 16
22. POLICIES and ACTIONS
Maximize the environmental benefits of
the transportation system
• Work to reduce greenhouse gas emissions
• Continue to support and implement SDOT’s environmental
management system, GreenDOT
• Reuse and reduce construction materials whenever possible
• Increase the use of “green” concrete and asphalt for roadway and
sidewalk projects
• Reduce vehicle idling at bridges, schools, and loading zones
• Improve water quality by enhancing and expanding the Street
Sweeping/ Vacuuming for Water Quality Program partnership with
Seattle Public Utilities (SPU)
• Develop and implement standards for green stormwater
infrastructure (GSI) projects in partnership with SPU
• Reduce electricity used to operate bridges and lighting
MEASURE 2010 BASELINE 2014 GOAL
Percent of capital projects reviewed to 34%* 75%
maximize the use of “green” concrete
and asphalt
Percent of lane miles swept for water 60%* 71%
quality (out of total lane miles swept) (9,758/15,998 miles)
*2011 baseline
17 Focusing on the Basics
23. Elliott Bay Seawall Project
The Elliott Bay Seawall is the foundation for Seattle’s future waterfront. It runs from South Washington Street
to Broad Street along Elliott Bay and was built between 1916 and 1934. Over the last 70 years, the seawall
has deteriorated significantly and could fail in the event of an earthquake or even a large storm. Replacing the
seawall is a critical public safety issue and is a top priority for the City of Seattle. The need to replace the sea-
wall and the removal of the Alaskan Way Viaduct also presents Seattle with an opportunity to enhance critical
marine habitat along the shoreline.
Failing to replace the seawall puts our local economy at risk of major disruptions. Major transportation facili-
ties—ferries, railways, and roads—provide commuters access to work, freight access to markets, and visitors
access to the waterfront. Seattle’s front porch, which includes historic piers, tourist activities, passenger cruise
lines, office buildings, and residential buildings, is supported by this important structure.
The project team has completed 35% design of a staff-recommended alternative and is actively seeking per-
mits and environmental approvals for the project. The project will move into final design this spring, maintain-
ing a very aggressive schedule in order to address this critical safety project as quickly as possible.
Construction of the seawall is planned to occur in two phases, beginning as early as September 2013. The goal
is to complete the first phase of seawall construction—from Washington to Virginia streets—prior to the
demolition of the Alaskan Way Viaduct’s central waterfront section in early 2016.
Focusing on the Basics 18
24. POLICIES and ACTIONS
Manage Seattle’s public street trees and
landscapes
• Plant, prune, and care for street trees to increase tree canopy,
improve neighborhood streetscapes, and address public safety
concerns
• Update the Street Tree list to ensure the right tree is planted in
the right place and to reduce maintenance needs
• Maintain trees and vegetation around intersections, crosswalks,
regulatory signs, etc. to increase visibility
• Maintain tree pits to meet the dual goals of tree health and
pedestrian safety
• Educate the public and tree service providers on proper planting
and extended care, and on reporting illegal pruning or removals
• Enforce regulation related to tree retention and protection
MEASURE 2010 BASELINE 2014 GOAL
Percent of tree canopy coverage within the 16% 18%
right of way
Percent of customer inquiries on 684-TREE 90% 95%
hotline responded to within 2 business days
Tree maintenance pruning cycle 13.4 13.4*
(number of years)
*Maintaining the 13.4 yearly cyle is an increase, as inventory continues to grow each year
19 Focusing on the Basics
25. Community Tree Program
When it comes to reducing the impacts of climate change, there is no substitute for responsible behavior.
Planting trees can help lessen some of the problems that face us today, while providing benefits that enhance
our neighborhoods and our lives.
Trees reabsorb carbon dioxide out of the air. They can reduce energy needs, by cooling homes in the summer
and blocking cold winds in the winter. They capture storm water and filter dust and dirt from the sky. They
beautify our neighborhoods, encourage song birds, and help increase property values.
Thanks to the voter-supported Bridging the Gap initiative, SDOT is planting over 800 street trees per year.
We’re interested in finding neighborhoods where we can plant about 100 trees within about a 4- to 5-square
block area. These trees will be planted, watered through establishment, and maintained by SDOT.
Did You Know?
You can request free street trees for your neighborhood.
Check out http://www.seattle.gov/transportation/
btg_streettrees for guidelines, or call (206) 684-TREE.
Focusing on the Basics 20
26. Laying the Groundwork for
BUILDING HEALTHY
COMMUNITIES
Support sustainability, livability, and equitable growth.
Streets and sidewalks provide pathways to get us from point
A to point B. But if we look closer, we can also see them as
opportunities for making community connections, supporting
active lifestyles, and contributing to vibrant neighborhoods.
21
23
27. A key ingredient to a great city is public space that encourages people to linger, enjoy, and connect with neighbors
and strangers. SDOT sees placemaking as an essential part of sustainability, livability, and equitable growth. We
are rethinking how to use the right of way and how the transportation system contributes to the overall physical
feel of the city. We’re prioritizing transit, building more sidewalks, making more space available for bicycles, and
creating hubs where people can connect between modes.
In addition to making streets friendlier for all travelers, we are calming neighborhood streets to increase safety,
reduce vehicle speeds, and re-route auto traffic from neighborhoods onto arterial streets. We are designing
neighborhood greenways that promote bike and pedestrian travel on streets with low volumes and speeds. And,
we are making buses and rail a real option for many trips from our neighborhoods to major destinations. In
doing so, SDOT develops streetscape designs that consider the function, form, and feel of a space and its place
within the larger community.
By making it easier to ride transit and offering non-motorized options, people can choose to lead more active
and environmentally sustainable lifestyles. These choices often influence our decisions about where we live, shop,
go to school, work, and recreate. They can affect stress levels, finances, our sense of independence, and the time
we spend with our friends and family.
Although many people wouldn’t consider it a determinant to health, the way our transportation system is
planned, designed, and built has far-reaching implications for our risk of obesity, diabetes and injuries. This is
significant considering that over half of adult residents and 30 percent of school-aged children are overweight or
obese in King County. And the prevalence of obesity among African American adults is 60 percent higher than
for whites, which makes achieving equity a serious challenge.
We have an opportunity to provide healthy, affordable choices and create great places that encourage people to
get out and enjoy streets on foot or by bike. In doing so, we can also reduce greenhouse gas emissions, smog and
soot. We can also improve the health of our residents, support environmental sustainability, and bring people
together in places where they want to be.
22
28. BUILDING HEALTHY COMMUNITIES
WALK BIKE RIDE
We’re at a turning point in transportation. We can’t sustain the financial, environmental, and health costs of a
transportation system that is overly reliant on automobiles. We need a new path forward that enables people
to make healthy, affordable, and convenient choices.
Launched in 2010, the Mayor’s Walk Bike Ride initiative encourages a balanced approach to how we use our
streets, how we spend our transportation dollars, and how we collaborate with partner agencies. It commits
us to giving people better transit choices and safer routes for walking and biking. In doing so, we can build
a transportation system that supports safe and healthy communities, creates a dependable, connected, and
equitable network, and promotes placemaking. Walk Bike Ride is about making the healthy choice the easy
choice.
Our neighborhoods and the way they’re designed affect the way we get around in the city. Our lifestyles and
activities have changed, and the obesity trend has hit an alarming trajectory in a very short time period. By
designing our communities in the context of health and equity trends, and by providing better walking, biking,
and transit opportunities for all Seattleites, we can begin to reverse these negative impacts.
In 2011, over 1,800 people signed up for the Walk Bike Ride Challenge and pledged to convert at least two
car trips per week. This resulted in over 300,000 miles of driving converted to walking, biking, and transit, and
prevented over 300,000 pounds of greenhouse gases from entering our atmosphere. We aim to increase the
number of participants by 5 percent each year.
23
29. POLICIES and ACTIONS
Increase mobility and access for everyone
• Use equity criteria for prioritizing transportation investments and
maintenance activities
• Respond to curb ramp requests and continue to install them through
other projects
• Continue to install accessible pedestrian signals
• Minimize obstacles in the right of way that interfere with pedestrian and
bicycle access
• Ensure that SDOT capital projects consider the needs of all modes,
consistent with the city’s Complete Streets ordinance
• Use real-time and static maps to provide information to all travelers
MEASURE 2010 BASELINE 2014 GOAL
Percent of crossing improvements
completed in high priority areas 63% 75%
(defined in Pedestrian Master Plan)
Percent of requested curb ramps 65% 80%
completed to date
Building Healthy Communities 24
30. POLICIES and ACTIONS
Make transit the efficient, affordable
choice for a variety of trips
• Implement the recommendations of the Transit Master Plan
• Use transit infrastructure and facilities to create public spaces that
attract people and connect walking, biking, and transit
• Partner with transit agencies to implement programs that
encourage riding transit
• Work with Metro to further enhance RapidRide bus rapid transit
corridors
• Work with Metro to ensure that route planning and service hour
allocations best serve the city’s transit priorities
• Install real-time bus schedule technology at stops on high
ridership bus routes
MEASURE 2010 BASELINE 2014 GOAL
Miles of operating streetcar lines 1.3 3.8
Citywide bus ridership (average
weekday boardings) 282,000 303,000
Miles of completed bus corridor
projects 9 30
Transit Priority Corridors
SDOT is building better public transportation infrastructure
through projects that improve corridors and connections.
The goals of these projects are to:
• Help transit run faster and more reliably
• Improve overall capacity to move people around
the region
• Improve transit connections and rider experience
25 Building Healthy Communities
31. POLICIES and ACTIONS
Make healthy travel choices the easy
choices
• Implement the recommendations of the Pedestrian and Bicycle
Master Plans in collaboration with the Pedestrian and Bicycle
Advisory Boards
• Complete the update to the Bicycle Master Plan
• Partner with agencies, non-profits, and private organizations to
promote walking and biking
• Expand pedestrian and bicycle wayfinding signage to encompass
more destinations
• Add more bike parking in urban centers and villages
MEASURE 2010 BASELINE 2014 GOAL
Pedestrian volumes* 25,700 ** 26,500
Bicycle volumes* 3,900 ** 4,000
Percent of Bicycle Master Plan on-street
bike facility network (bike lanes and 45% 69%
sharrows) completed
* These are an average quarterly aggregate of evening peak-hour counts conducted at 50 locations throughout the city
** 2011 baseline
Building Healthy Communities 26
32. POLICIES and ACTIONS
Activate public spaces
• Designate pedestrian plazas and festival streets in the right of
way
• Improve public access to shoreline street ends
• Continue issuing permits for festival streets, mobile food vending,
farmers markets, and block parties
MEASURE 2010 BASELINE 2014 GOAL
Number of street food vending carts
and trucks, sidewalk cafes, and farmer’s 311 326
market permits issued
Did You Know?
In July 2011, the city passed legislation that created new rules for mobile vending on city
streets.The new permit type helps activate the street and supports local businesses.
27 Building Healthy Communities
33. Painted Intersections
Mobile Vending
Painted intersections lend a sense of place to a community and are a great way to organize your neighborhood
around a common goal. SDOT allows painted intersections on residential (non-arterial) streets. Our Street
Use Division made it easier for neighborhoods to create street murals by developing step-by-step instructions
for painted intersections. Our Neighborhood Traffic team works with the community to make their design a
reality while meeting SDOT standards.
Building Healthy Communities 28
34. Laying the Groundwork for
SUPPORTING A
THRIVING ECONOMY
Keep people and goods moving and create great places
that attract businesses.
33
29
35. Seattle has a rich history of industry, ingenuity, and entrepreneurialism – from manufacturing and trade activities
to new technologies and start-ups. Transportation plays a critical role across this spectrum, as it moves goods
and people into and around the city.
Freight and goods make up a significant sector of our local economy. In 2010, our manufacturing and maritime
sectors supported more than 90,000 jobs, generated $6 billion each year in taxable retail sales, and contributed
to over $37 million annually in business and occupation taxes. Container ships, trains, trucks, airplanes, and
delivery vehicles all play a role in what we consume and what we export to the world. Moving goods safely and
efficiently is vital to our city’s economic success.
People also rely on a solid transportation network to get around. Transportation is the second largest expense
for American households – accounting for nearly 20 cents of every dollar spent – more than food, clothing, and
health care. Research shows that a two-person household that uses public transportation saves an average of
$6,251 annually compared to a household with two cars and no public transportation accessibility. By providing
convenient and affordable transportation choices, we can move people efficiently and keep money in their
pockets. Every dollar saved means more money retained in the local economy.
In addition to saving money, an efficient transportation network saves time. Consider all the time spent in traffic
back-ups that could have gone toward developing and implementing new ideas. Or circling the block in search of
a parking space when you could have been shopping or dining. A thriving city is one in which people can access
jobs, educational opportunities, retail districts, and community services quickly and easily.
Lastly, a high-quality transportation network contributes to a thriving economy by adding to the vibrancy of our
city. A well-designed transportation network, pleasant streetscapes, and great public spaces attract people and
spur economic development. To maintain this competitive advantage, we must continue to grow intelligently and
recognize the vital role that transportation plays, not only in moving goods and people, but also in attracting new
economic opportunities.
30
36. POLICIES and ACTIONS
Keep freight and goods moving efficiently
• Continue the freight spot improvement program to reduce bottlenecks
and improve safety
• Work with the Seattle Freight Advisory Board and other stakeholders to
plan for current and emerging freight needs
• Develop travel time guidelines along Major Truck Streets and other
arterials
• Collect truck volume data on the arterial network to inform decision
making
• Use intelligent transportation system (ITS) technology to alert drivers of
delays at traffic bottlenecks
• Partner with Washington State Ferries to improve access at ferry terminals
MEASURE 2010 BASELINE 2014 GOAL
Number of annual spot 11 15
improvements for freight
mobility
Did You Know?
Every billion dollars spent on public transportation creates over 10,000 jobs.
Center for Neighborhood Technology, 2009
31 Supporting a Thriving Economy
37. POLICIES and ACTIONS
Increase efficient and affordable access to
jobs and education
• Prioritize transportation investments that serve major
employment and education centers
• Increase the speed and reliability of priority bus corridors that
connect people to major employment and education centers
• Leverage transportation investments with private development
opportunities
• Implement programs that inform employees and students about
travel options
MEASURE 2010 BASELINE 2014 GOAL
Percent of commute trips to Center City 65% 68%
using non-drive alone modes
Number of Walk Bike Ride Challenge 1,886* 2,100
participants
*2011 baseline
Mercer Corridor Project
The Mercer Corridor project will widen Mercer Street
to create a two-way boulevard, reconstruct Valley Street
as a local access street, provide new and wider sidewalks,
improve connections to transit, and add bicycle lanes. The
project replaces major utility infrastructure and integrates
many environmentally-friendly and sustainable design
features.
In addition to improving mobility for over 100,000 people
each day, the project will create 600 direct construction
jobs, support 22,000 new jobs in South Lake Union, and
improve links to Port facilities, industry and research/
development uses.
Supporting a Thriving Economy 32
38. POLICIES and ACTIONS
Build great streetscapes to promote
economic vitality
• Work with business districts to design streetscapes that address
the needs of the retail community
• Utilize public art to promote street activation
• Finalize the Pedestrian Lighting Plan
• Maintain trees and landscapes in business districts and the Center
City to encourage and attract customers
• Work with the Department of Planning and Development to
designate and develop Green Streets projects
MEASURE 2010 BASELINE 2014 GOAL
Number of annual SDOT-sponsored art 7 8
projects
Number of annual pedestrian lighting 7 5
projects completed
33 Supporting a Thriving Economy
39. Waterfront Seattle
Waterfront Seattle is a partnership between the City of Seattle and the entire community to create a
dynamic public waterfront along 26 city blocks from Pioneer Square to the Olympic Sculpture Park. With the
Alaskan Way Viaduct coming down and the replacement of the Elliott Bay Seawall, Seattle has a unique oppor-
tunity to make a range of improvements to our waterfront, creating an exciting destination with vibrant public
and cultural spaces, access to the water and a new urban street that will accommodate all modes of travel
and provide an important connection in the City’s transportation system.
This effort is led by Seattle’s Department of Planning and Development, SDOT, and the Department of Parks
and Recreation. The project’s guiding principles are to create a waterfront for all, put the shoreline and sus-
tainable design at the forefront, reconnect the city to its waterfront, embrace and celebrate Seattle’s past,
present and future, improve access and mobility for people and goods, create a bold vision that is adaptable
over time, and develop consistent leadership – from concept to construction to operations.
Supporting a Thriving Economy 34
40. POLICIES and ACTIONS
Support Center City and neighborhood
business district access
• Partner with business districts to improve loading and customer
access and educate the public about on-street parking rules
• Adjust parking rates and hours based on annual data collected to
improve parking access
• Guide Center City visitors to short-term off-street parking
through the e-Park electronic parking guidance system
• Prioritize pedestrian, bicycle, and transit investments that serve
urban villages and centers
• Minimize construction impacts on business districts
• Integrate pay-by-cellphone technology into on-street parking pay
stations
MEASURE 2010 BASELINE 2014 GOAL
Number of parking facilities in e-Park 6 10-15
Percent of paid parking areas with occupancies within
the range of 1-2 available spaces per block face 32% 60%
Percent of new bike parking spaces installed that are
in urban villages and centers 70% 70%
e-Park
Downtown Seattle shines with world-class arts, shopping,
dining, and entertainment. e-Park signs let you know space
availability in six garages throughout the Downtown Retail
Core and Pike Place Market.
Look for dynamic signs at key points to guide you to
participating garages. The signs show how many spaces are
currently available in each garage. Real-time information
takes the guesswork out of parking and helps reduce
congestion.
35 Supporting a Thriving Economy
41. Did You Know?
In 2010,Washington and Oregon combined paid about $16.6 billion for oil imports—
over $1,550 per person, or more than $6,200 on average for a family of four.The
increase in oil prices in the first part of 2011 has put the region on track for its highest
level of petroleum spending ever.
Sightline Institute, 2011
Supporting a Thriving Economy 36
42. Laying the Groundwork for
PROVIDING
GREAT SERVICE
Help people access transportation services and information.
Customer service is at the core of what we do. Designing safe streets, paving
roads and filling potholes, keeping people and goods moving, and making it
easier to walk, bike, and ride transit – we do all of these things for the public’s
benefit.The way in which we deliver services and communicate our projects
is a critical component of our work.
37
43. Behind all of our projects is a quality workforce that strives to implement innovative, cost-effective, and sustainable
solutions to Seattle’s transportation challenges. SDOT continues to invest in building the skills and expertise of
our staff to meet the complex demands of an urban transportation system.
Seattle is a diverse community with a broad range of transportation needs and concerns. We strive to create a
workforce whose composition reflects the diversity of the community we serve. And we have a responsibility to
ensure services we provide are equitably delivered.
To provide great service, we need to understand constituent needs.To do this, we must listen to the community,
and communicate our work clearly and through a variety of inclusive outreach methods. Participating in
community meetings, going door-to-door to share project information, and responding to letters, phone calls,
and emails will continue to be central elements of our strategy.
We also recognize the increasing reliance on technology and are actively using Twitter, Facebook, Flickr, online
surveys, and a blog to update our customers, take input, and answer questions. With a few clicks of the mouse,
people can go online and find the latest traffic alerts, construction and event street closures, and a map of on-
street and off-street parking. We’re working hard to maintain and upgrade SDOT’s technology to help people
travel smarter.
And, we’re exploring creative methods of community outreach that connect with different audiences, including
those who don’t speak English as a first language or who might not normally attend a public meeting. Our
transportation system must serve everyone.
Lastly, it is our goal to deliver quality projects and service in a timely and financially-responsible manner. The
public entrusts us with its purse, and this is a relationship we take seriously. Incorporating performance measures,
gathering feedback, and continually evaluating our work will strengthen SDOT as an organization and improve
our ability to meet community needs. It’s our job to serve the public, and we intend to do just that.
38
44. PROVIDING GREAT SERVICE
Did You Know?
Every year, SDOT responds to over
1,200 email inquiries and 2,580 phone calls
on the 684-ROAD line.
Public Engagement
In late 2011, SDOT partnered with other city departments to engage eight different language groups about long-
range city planning. We used an interactive voting tool to get immediate feedback around a series of questions
about growth, transportation, and climate change. Participants enjoyed using this new tool and seeing live results.
39 Providing Great Service
45. POLICIES and ACTIONS
Ensure a quality department workforce
• Provide on-going training opportunities at all occupational levels
• Reduce incidents of on-the-job accidental injuries and vehicle collisions
• Recognize employees who perform “above and beyond”
• Explore the development of apprenticeship programs and vehicle
operations training programs
• Establish preferred training levels for technical employees
MEASURE 2010 BASELINE 2014 GOAL
Percent of employees completing Race 96% 100%
and Social Justice Intiative training
Percent of employees injured per 12.4% 9%
100 workers
Providing Great Service 40
46. POLICIES and ACTIONS
Be inclusive and transparent in public
engagement
• Use social networking tools to share information and engage the
public
• Reduce response time for customer requests and inquiries
• Keep all project websites udpated, accessible, accurate, and easy
to navigate
• Improve community connections and outreach tools to work
effectively with Seattle’s diverse population
• Work with neighborhoods on the selection, design, and
implementation of Neighborhood Street Fund projects
• Make more SDOT data available on Data.seattle.gov
MEASURE 2010 BASELINE 2014 GOAL
Number of SDOT Facebook page followers 457* 1,000
Percent of large capital projects using RSJI** n/a 100%
public engagement toolkit checklist
*2011 baseline
**Race and Social Justice Initiative
Did You Know?
You can connect with SDOT on Facebook,Twitter, Flickr, and our blog
at http://www.seattle.gov/transportation/interactive.
41 Providing Great Service
47. POLICIES and ACTIONS
Ensure equity in service delivery, hiring,
and contracting
• Deliver transportation projects based upon objective criteria and
demonstrated need
• Provide information and technical assistance to women and
minority-owned business enterprises (WMBEs)
• Strive to make SDOT workforce reflect regional demographics
• Provide internships and training opportunities for high-school and
college students
MEASURE 2010 BASELINE 2014 GOAL
Number of information meetings held 3* 4
for WMBEs
Number of Summer Youth Employment 12 12
Program interns
*2011 baseline
Race and Social Justice Intiative (RSJI)
SDOT employees are becoming more engaged and better aware of the City’s
Race and Social Justice Initiative (RSJI) – an effort to end institutionalized racism
and race-based disparities in our communities. SDOT’s RSJI Change team has
developed and implemented a comprehensive workplan. One of our priorities
is to increase Women and Minority-Owned Enterprise (WMBE) contracting,
which not only raises awareness of issues of race, but also helps us connect
with our community. The King Street Station Project is exceeding goals of 6
percent Disadvantaged Business Enterprise (DBE) and 10 percent WMBE set
for this project by achieving 7 percent DBE participation and 21 percent WMBE
participation.
Our workforce is becoming more empowered and better able to understand RSJI because of our ongoing
efforts through Lunch & Learns, newsletters, and increased conversations about race and equity with senior
leadership. These efforts equip employees to engage the public on issues of race and social justice and provide
equitable service to our customers.
Providing Great Service 42
48. POLICIES and ACTIONS
Demonstrate strong financial stewardship
• Meet Bridging the Gap (BTG) levy and $20 Vehicle License Fee
(VLF) objectives and deliverables
• Complete all construction projects within engineer’s estimated
budgets
• Manage all projects within respective lines of budget control as
adopted by the city and resolve financial issues in a timely
manner
• Secure grants to help fund the city’s transportation priorities
• Use documented objective criteria to prioritize transportation
projects and programs
• Work with city departments and other governmental agencies to
make the most of capital investments
MEASURE 2010 BASELINE 2014 GOAL
BTG and VLF projects delivered 100% 100%
on time and on budget
Grant funding secured $24M $19M
43 Providing Great Service
49. ORGANIZATIONAL CHART
Capital Projects
and Roadway
Structures
SDOT Policy
Director’s Office and
Planning
Major
Resource Projects
Management
Street
Maintenance
Traffic Street Use and
Management Urban Forestry
Communications
Human
Resources
44
52
50. BY THE NUMBERS
At a time when belt-tightening is the norm, we have been fortunate to have the voter-approved Bridging the
Gap transportation levy, as well as other grant and partnership funding. These dedicated funds have allowed
us to implement transportation improvements despite declining revenues.
In 2011, revenues and expenditure budgets decreased by
approximately $3.8 million from 2010. This decrease reflected
continued economic weakness, with stagnant General Fund
and Gas Tax support losing ground against inflation, as well as
decreased capital funding.
2011Revenue: $306 million
General: Fund $39M (13%) BTG: $63M (20%)
Gas Tax: $14M (4%) Charges for Service: $66M (22%)
Debt: $66M (22%) Grants & Other: $51M (17%)
CRF: %5m (1%) Fund Balance: $4M (1%)
In 2011, SDOT’s expenditure budget decreased with substantial
reductions in major maintenance, partially offset by increased
spending on major projects such as the First Hill Streetcar, Alaskan
Way Viaduct and Seawall replacement, and Spokane Street Viaduct.
2011Budget: $306 million
Bridges & Structures: $8M (2%) Mobility-Capital: $33M (11%)
Department Management: $1M (0%) Mobility-Operations $37M (12%)
Engineering Services: $2M (1%) ROW Management: $12M (4%)
General Expense: $23M (7%) Street Maintenance: $30M ((10%)
Major Maint/Replacement: $53M (17%) Urban Forestry: $4M (1%)
Major Projects: $105M (34%)
45
51. Here’s a snapshot of our 2011 accomplishments, by the numbers. In many cases, this list goes into more
detail than the information provided in the performance measures, and it adds another level of detail on
how we’re providing core services to the community. The orange text signifies work that was funded in part
or entirely with Bridging the Gap levy revenues.
BIKES AND PEDESTRIANS 2011
Bike lanes and sharrows installed (miles) 15
Bike route signs installed (miles) 31
Pedestrian/bike trails built (segments) 0
Bike parking spaces installed 210
Bike maps issued 34,366
New sidewalks built by Sidewalk Development Program (blocks) 10
Sidewalk blocks rehabilitated 25
Crosswalks remarked 306
Curb ramps constructed 295
Stairways retrofitted 3
Walking routes to schools improved for safety 6
Signage of school zones improved 10
Pedestrian crossings improved 51
BRIDGES
Bridge repairs completed 230
Bridges painted 1
Guardrail replaced (feet) 1,891
46
52. PARKING 2011
Pay station inquiries resolved 9,660
Pay station transactions processed 10.5 million
PAVEMENT
52
Lane-miles paved
Potholes filled 25,110
TRAFFIC
Construction and Special Event Traffic Control Plans Approved 2,436
Lane - miles of pavement restriped 1,151
Regulatory traffic signs replaced 5,065
Street name signs replaced (number of intersections) 1,156
Radar speed signs installed 12
Speed watch trailers deployed 51
TRAFFIC SIGNALS
107
Traffic Signals Optimized
New traffic signals installed 3
Traffic signals maintained 1,055
Pedestrian countdown signals installed 26
URBAN FORESTRY
Street trees planted* 822
Street trees pruned 3,385
Landscape maintained (square feet) 912
47 By the Numbers
53. OTHER 2011
Transit hours secured 44,000
SDOT public website visits 5,630,023
Grants/appropriations/authorizations received $23,649,000
Grants/appropriations/authorizations submitted for future funding $44,240,000
Percentage of contracts issued to women and minority business 8.2%
enterprises for Goods and Services**
Percentage of Completed Construction Projects by Women and 11.25%
Minority-Owned Business Enterprises (WMBE) contracts **
* SDOT either plans or facilitates
** Dollars expended with WMBE vendors are reported based on actual payments in the current year
By the Numbers 48
54. making a DIFFERENCE
To minimize printing costs and reduce paper use,
a limited number of copies were printed on recycled paper.
The document is available to view at
http://www.seattle.gov/transportation/sdotreports.htm
The Seattle Department of Transportation
700 Fifth Avenue, Suite 3800
PO Box 34996
Seattle, WA 98124-4996
(206) 684-ROAD
www.seattle.gov/transportation