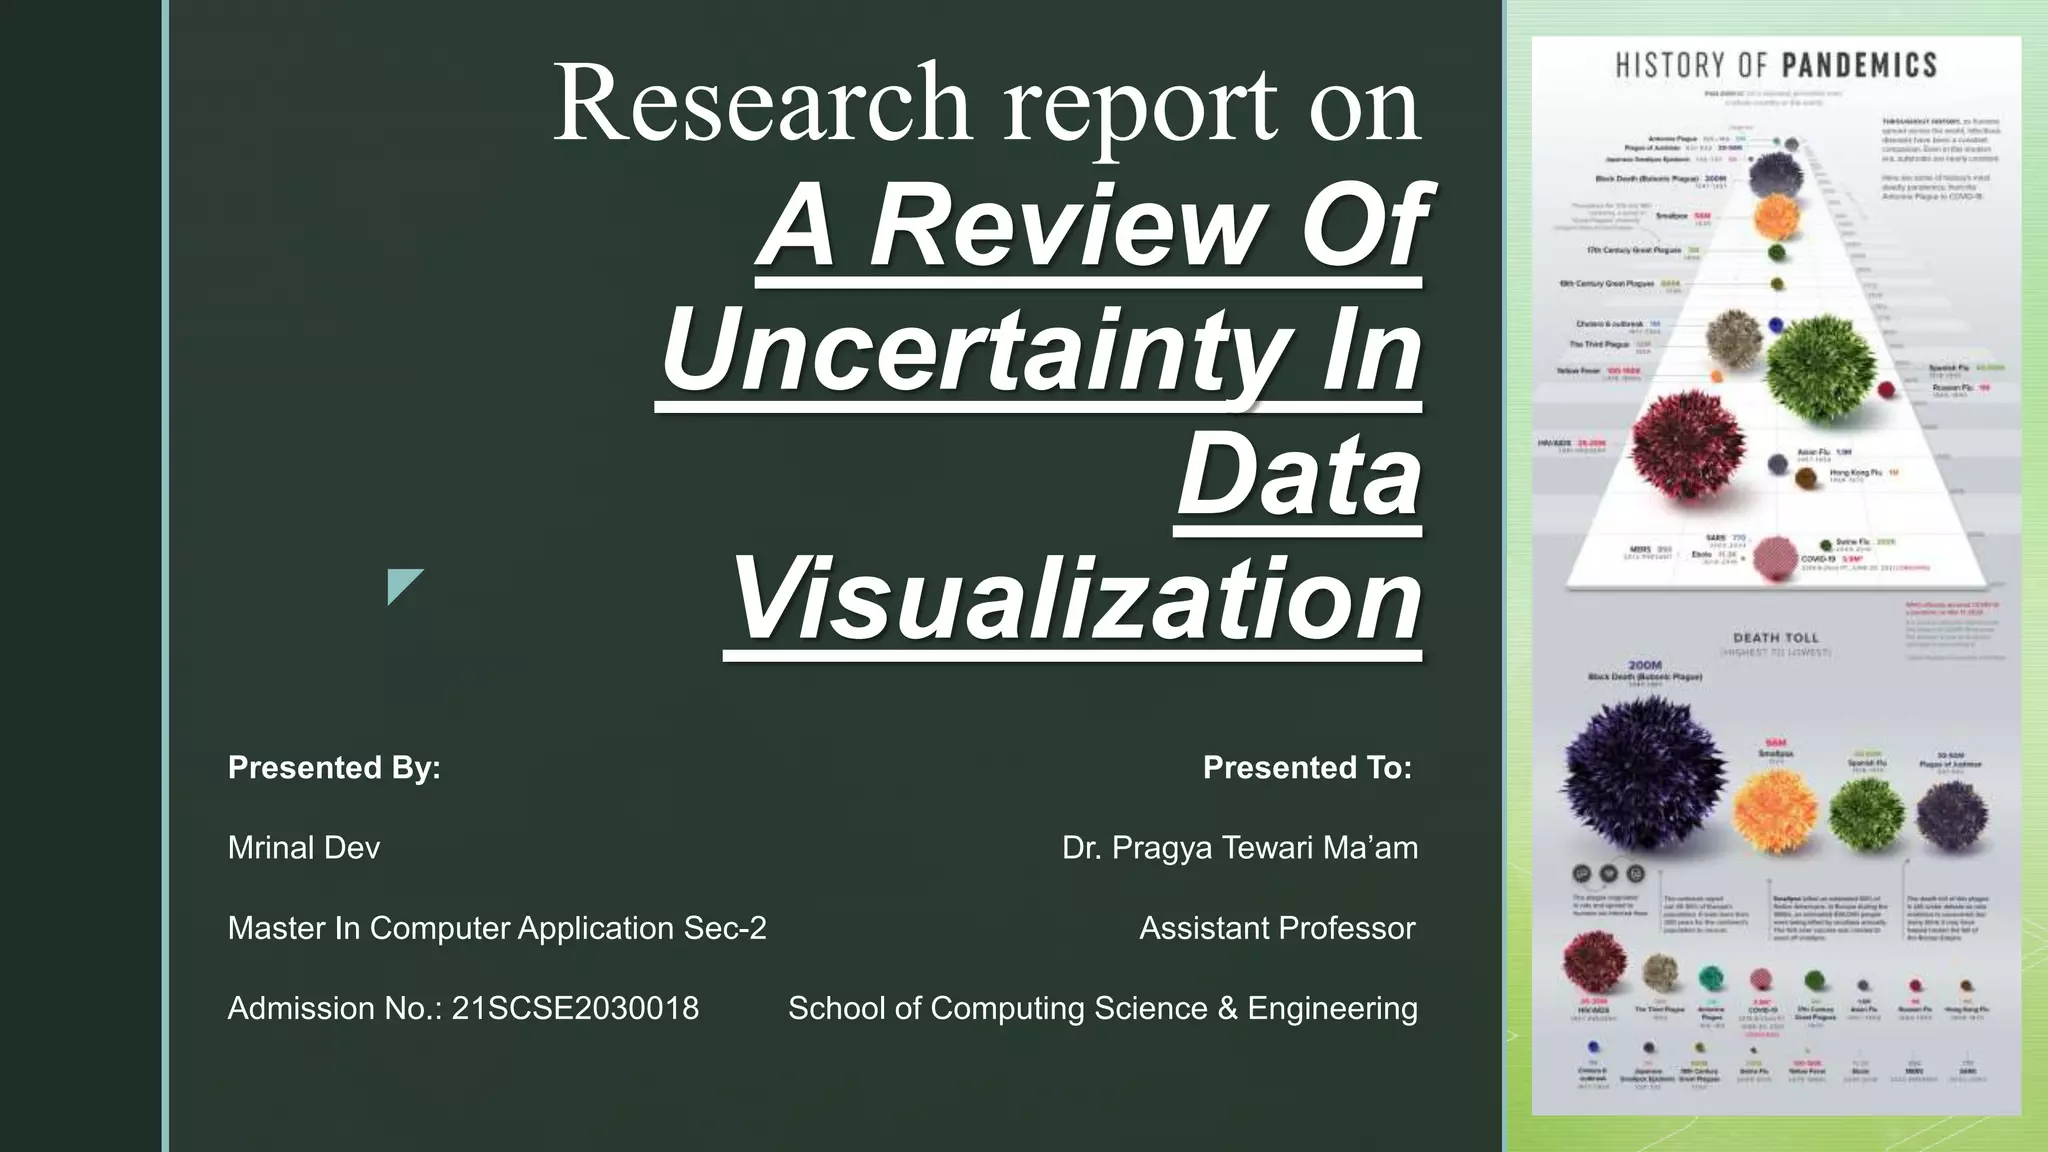
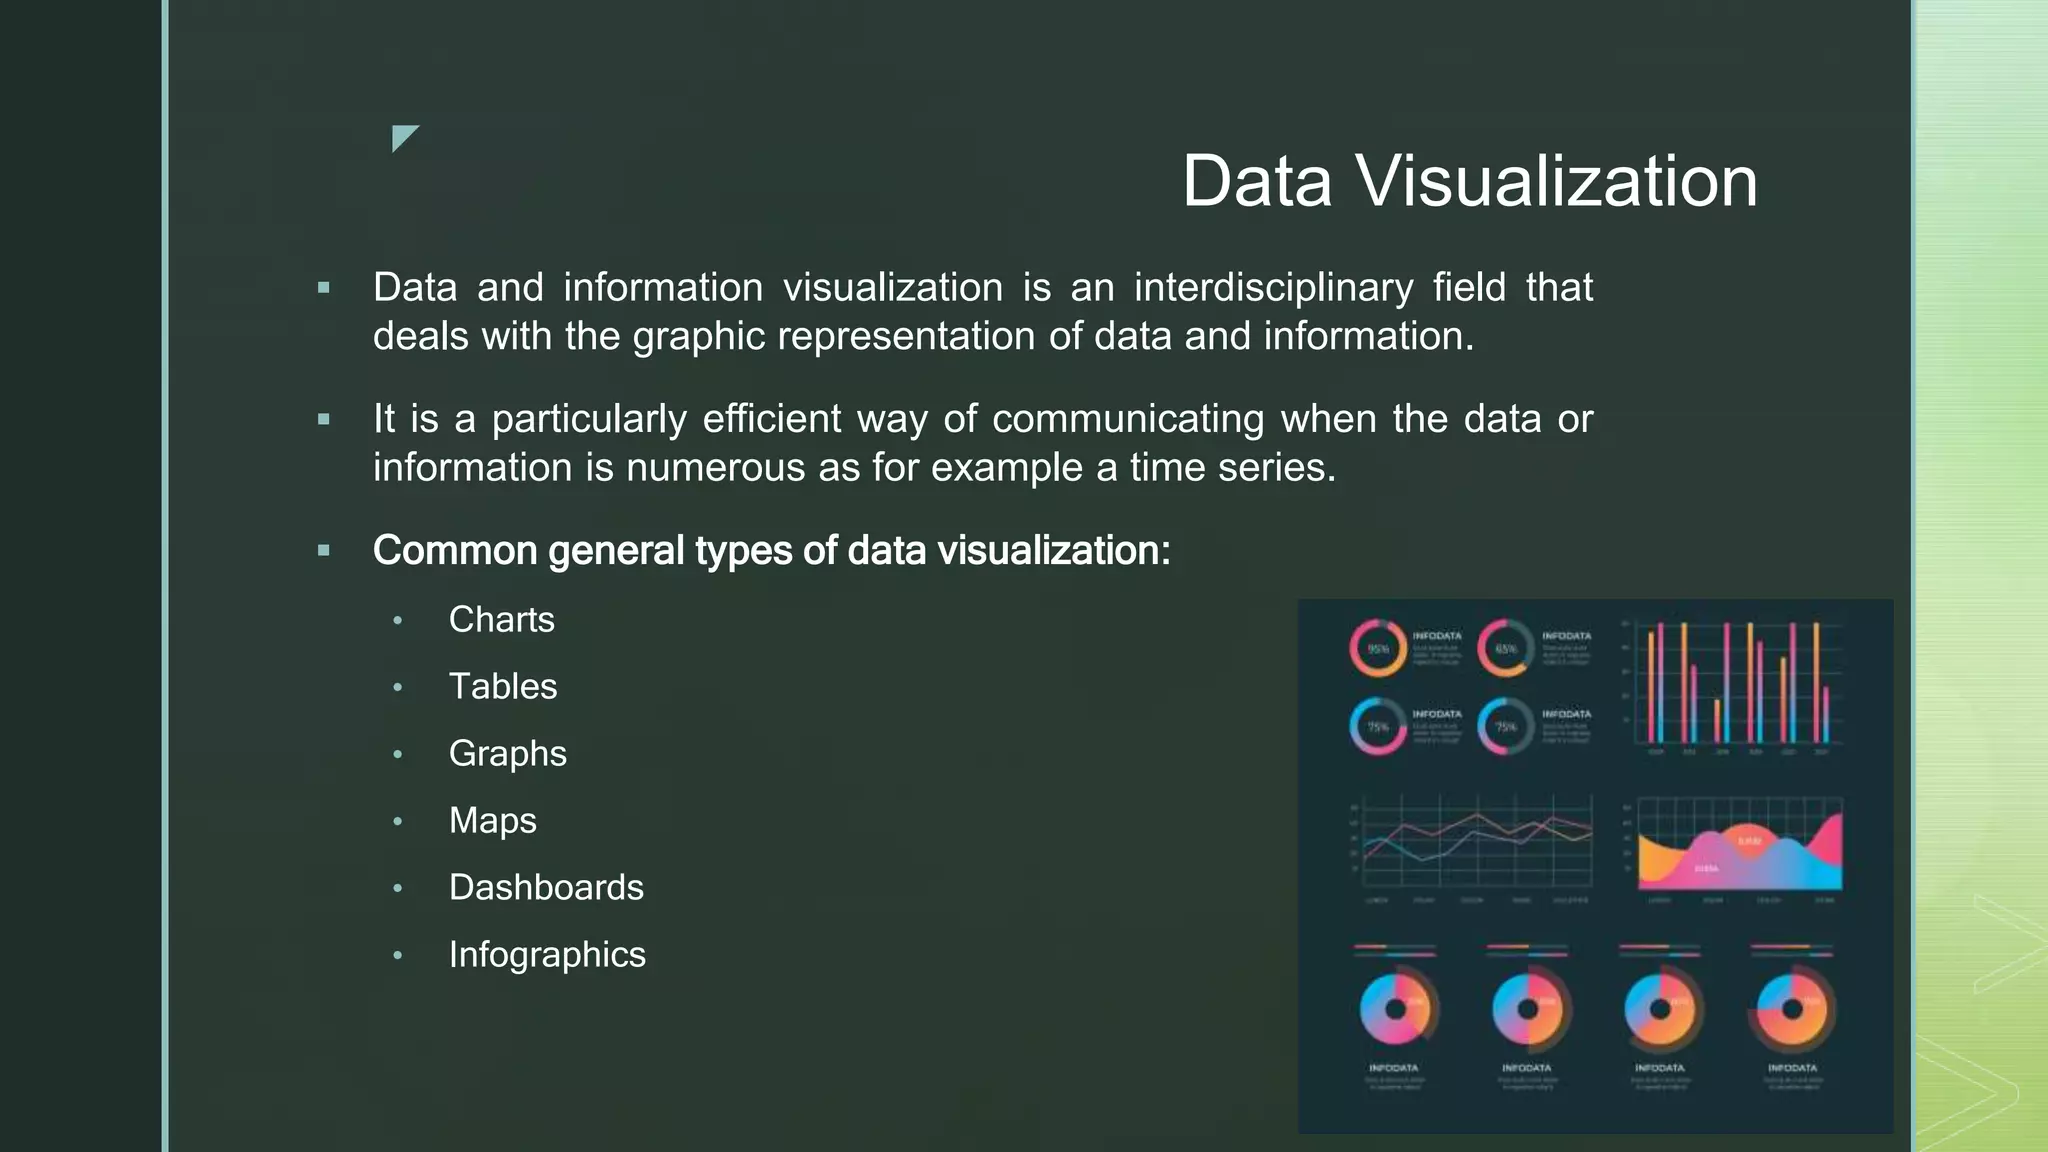
z
Research report on
A Review Of
Uncertainty In
Data
Visualization
Presented By: Presented To:
Mrinal Dev Dr. Pragya Tewari Ma’am
Master In Computer Application Sec-2 Assistant Professor
Admission No.: 21SCSE2030018 School of Computing Science & Engineering
z
Chapters
 Introduction
 Uncertainty
 Data Visualization
 Uncertainty In Data Visualization
 Why is it so difficult to Deal with Uncertainty
 Theories of Uncertainty in Visual Analytics
z
Introduction
 Visual analytics is both an art and a science.
 The challenge is to master the art without losing sight of the
science, and vice versa. First and foremost, a data visualization
must accurately convey the data.
 If a figure contains jarring color schemes, unbalanced visual
elements, or other distracting elements, the viewer will find it
difficult to inspect and interpret the figure correctly.
z
Uncertainty
 Uncertainty refers to epistemic situations involving imperfect or
unknown information.
 It applies to predictions of future events, to physical
measurements that are already made, or to the unknown.
Uncertainty arises in partially observable or stochastic
environments, as well as due to ignorance, indolence, or both.
z
Data Visualization
 Data and information visualization is an interdisciplinary field that
deals with the graphic representation of data and information.
 It is a particularly efficient way of communicating when the data or
information is numerous as for example a time series.
 Common general types of data visualization:
• Charts
• Tables
• Graphs
• Maps
• Dashboards
• Infographics
z
Why is it so difficult to Deal with
Uncertainty
 Data visualizations are not as easy to create as they look. There
is a lot of work and effort that goes into it.
 There needs to be the right balance between all the visual
elements. If you do too little or too much, your visualization will
never create an impact.
 For nearly any visualization we may have, we can add some
indication of uncertainty by adding error bars.
z
Uncertainty In Data Visualization
 One of the most challenging aspects of data visualization is the
visualization of uncertainty. When we see a data point drawn
in a specific location, we tend to interpret it as a precise
representation of the true data value.
 Uncertainties are almost always quoted to one significant
digit (example: ±0.05 s). If the uncertainty starts with a one,
some scientists quote the uncertainty to two significant digits
(example: ±0.0012 kg). Always round the experimental
measurement or result to the same decimal place as the
uncertainty.
z
Theories of Uncertainty in Visual Analytics
 It is difficult to conduct empirical research on uncertainty
representation.
 Several user experiences goals and performance metrics may be
considered when examining uncertainty representations.
 There are basically 4 methodologies are there in the Uncertainty in
Visual Analytics:
 Visual Semiotics
 Visual Boundaries
 Frequency Farming
 Attribute Substitution Deter mistic Construal Error
z
 Visual Semiotics : Some encryption techniques have been designed to
naturally translate onto uncertainty.
 Visual Boundaries : When ranges are represented by boundaries, people
feel that information both within and without limits are categorically separate.
 Frequency Farming : Ambiguity is much more naturally comprehended
(1/10) in a frequencies frame than in a probabilistic frame (10%).
 Attribute Substitution Deterministic Construal Error : Viewers will
mentally swap unclear information for more comprehensible data if given the
option.
z

Review on Uncertainty in Data Visualization.pptx

  • 1.
    z Research report on AReview Of Uncertainty In Data Visualization Presented By: Presented To: Mrinal Dev Dr. Pragya Tewari Ma’am Master In Computer Application Sec-2 Assistant Professor Admission No.: 21SCSE2030018 School of Computing Science & Engineering
  • 2.
    z Chapters  Introduction  Uncertainty Data Visualization  Uncertainty In Data Visualization  Why is it so difficult to Deal with Uncertainty  Theories of Uncertainty in Visual Analytics
  • 3.
    z Introduction  Visual analyticsis both an art and a science.  The challenge is to master the art without losing sight of the science, and vice versa. First and foremost, a data visualization must accurately convey the data.  If a figure contains jarring color schemes, unbalanced visual elements, or other distracting elements, the viewer will find it difficult to inspect and interpret the figure correctly.
  • 4.
    z Uncertainty  Uncertainty refersto epistemic situations involving imperfect or unknown information.  It applies to predictions of future events, to physical measurements that are already made, or to the unknown. Uncertainty arises in partially observable or stochastic environments, as well as due to ignorance, indolence, or both.
  • 5.
    z Data Visualization  Dataand information visualization is an interdisciplinary field that deals with the graphic representation of data and information.  It is a particularly efficient way of communicating when the data or information is numerous as for example a time series.  Common general types of data visualization: • Charts • Tables • Graphs • Maps • Dashboards • Infographics
  • 6.
    z Why is itso difficult to Deal with Uncertainty  Data visualizations are not as easy to create as they look. There is a lot of work and effort that goes into it.  There needs to be the right balance between all the visual elements. If you do too little or too much, your visualization will never create an impact.  For nearly any visualization we may have, we can add some indication of uncertainty by adding error bars.
  • 7.
    z Uncertainty In DataVisualization  One of the most challenging aspects of data visualization is the visualization of uncertainty. When we see a data point drawn in a specific location, we tend to interpret it as a precise representation of the true data value.  Uncertainties are almost always quoted to one significant digit (example: ±0.05 s). If the uncertainty starts with a one, some scientists quote the uncertainty to two significant digits (example: ±0.0012 kg). Always round the experimental measurement or result to the same decimal place as the uncertainty.
  • 8.
    z Theories of Uncertaintyin Visual Analytics  It is difficult to conduct empirical research on uncertainty representation.  Several user experiences goals and performance metrics may be considered when examining uncertainty representations.  There are basically 4 methodologies are there in the Uncertainty in Visual Analytics:  Visual Semiotics  Visual Boundaries  Frequency Farming  Attribute Substitution Deter mistic Construal Error
  • 9.
    z  Visual Semiotics: Some encryption techniques have been designed to naturally translate onto uncertainty.  Visual Boundaries : When ranges are represented by boundaries, people feel that information both within and without limits are categorically separate.  Frequency Farming : Ambiguity is much more naturally comprehended (1/10) in a frequencies frame than in a probabilistic frame (10%).  Attribute Substitution Deterministic Construal Error : Viewers will mentally swap unclear information for more comprehensible data if given the option.
  • 10.