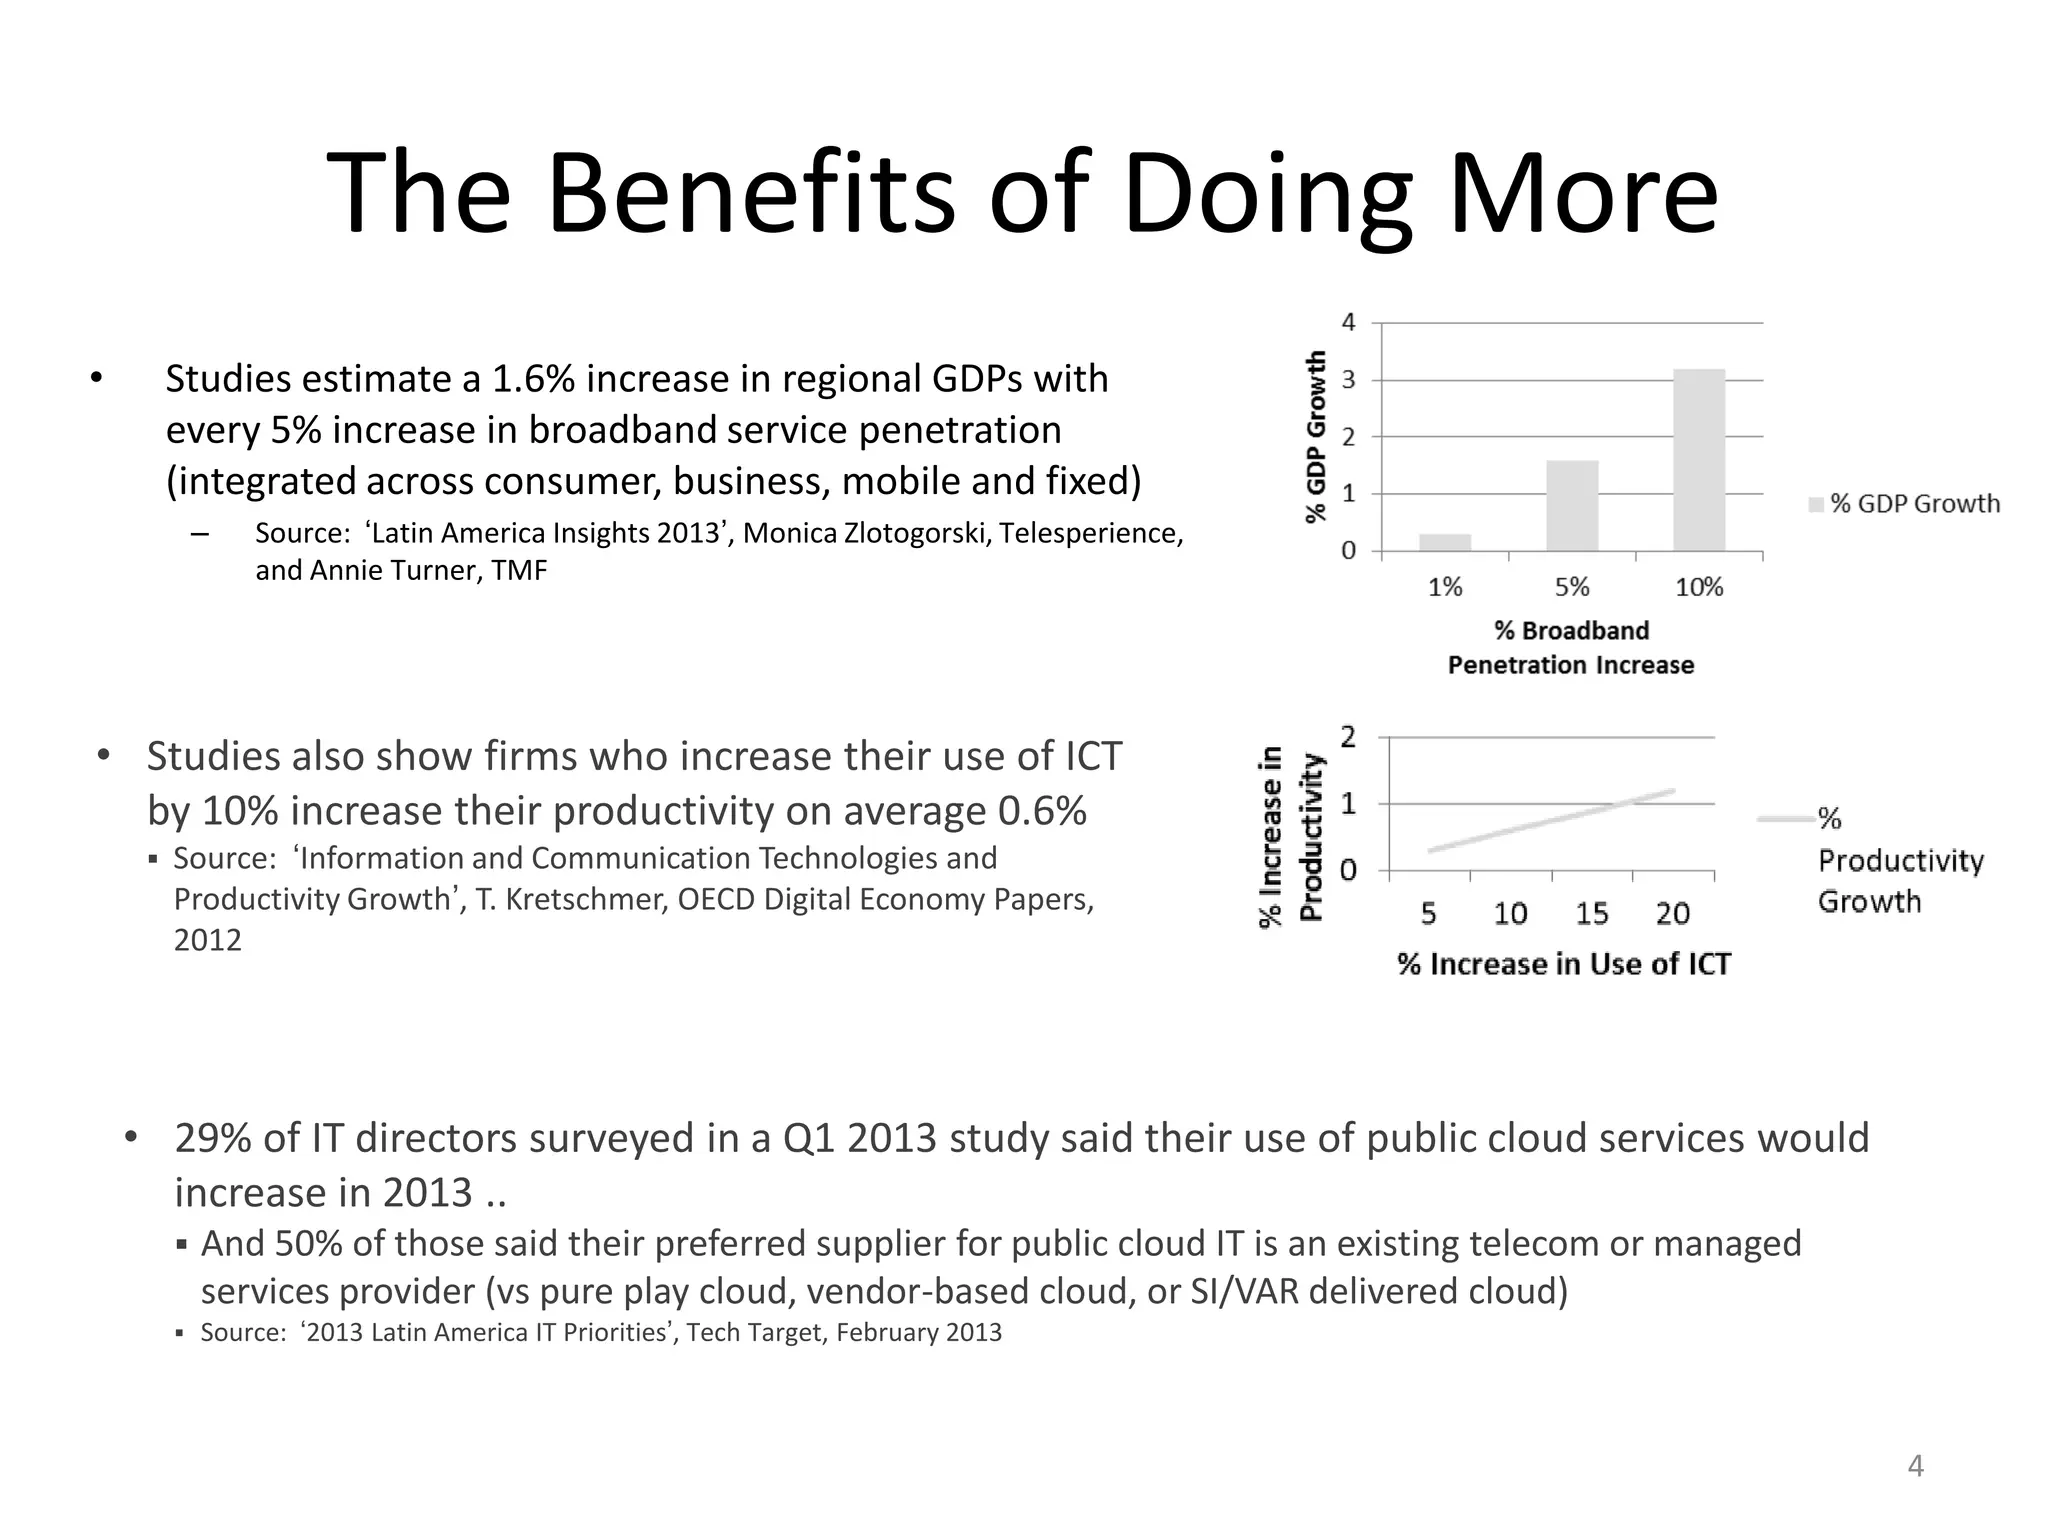
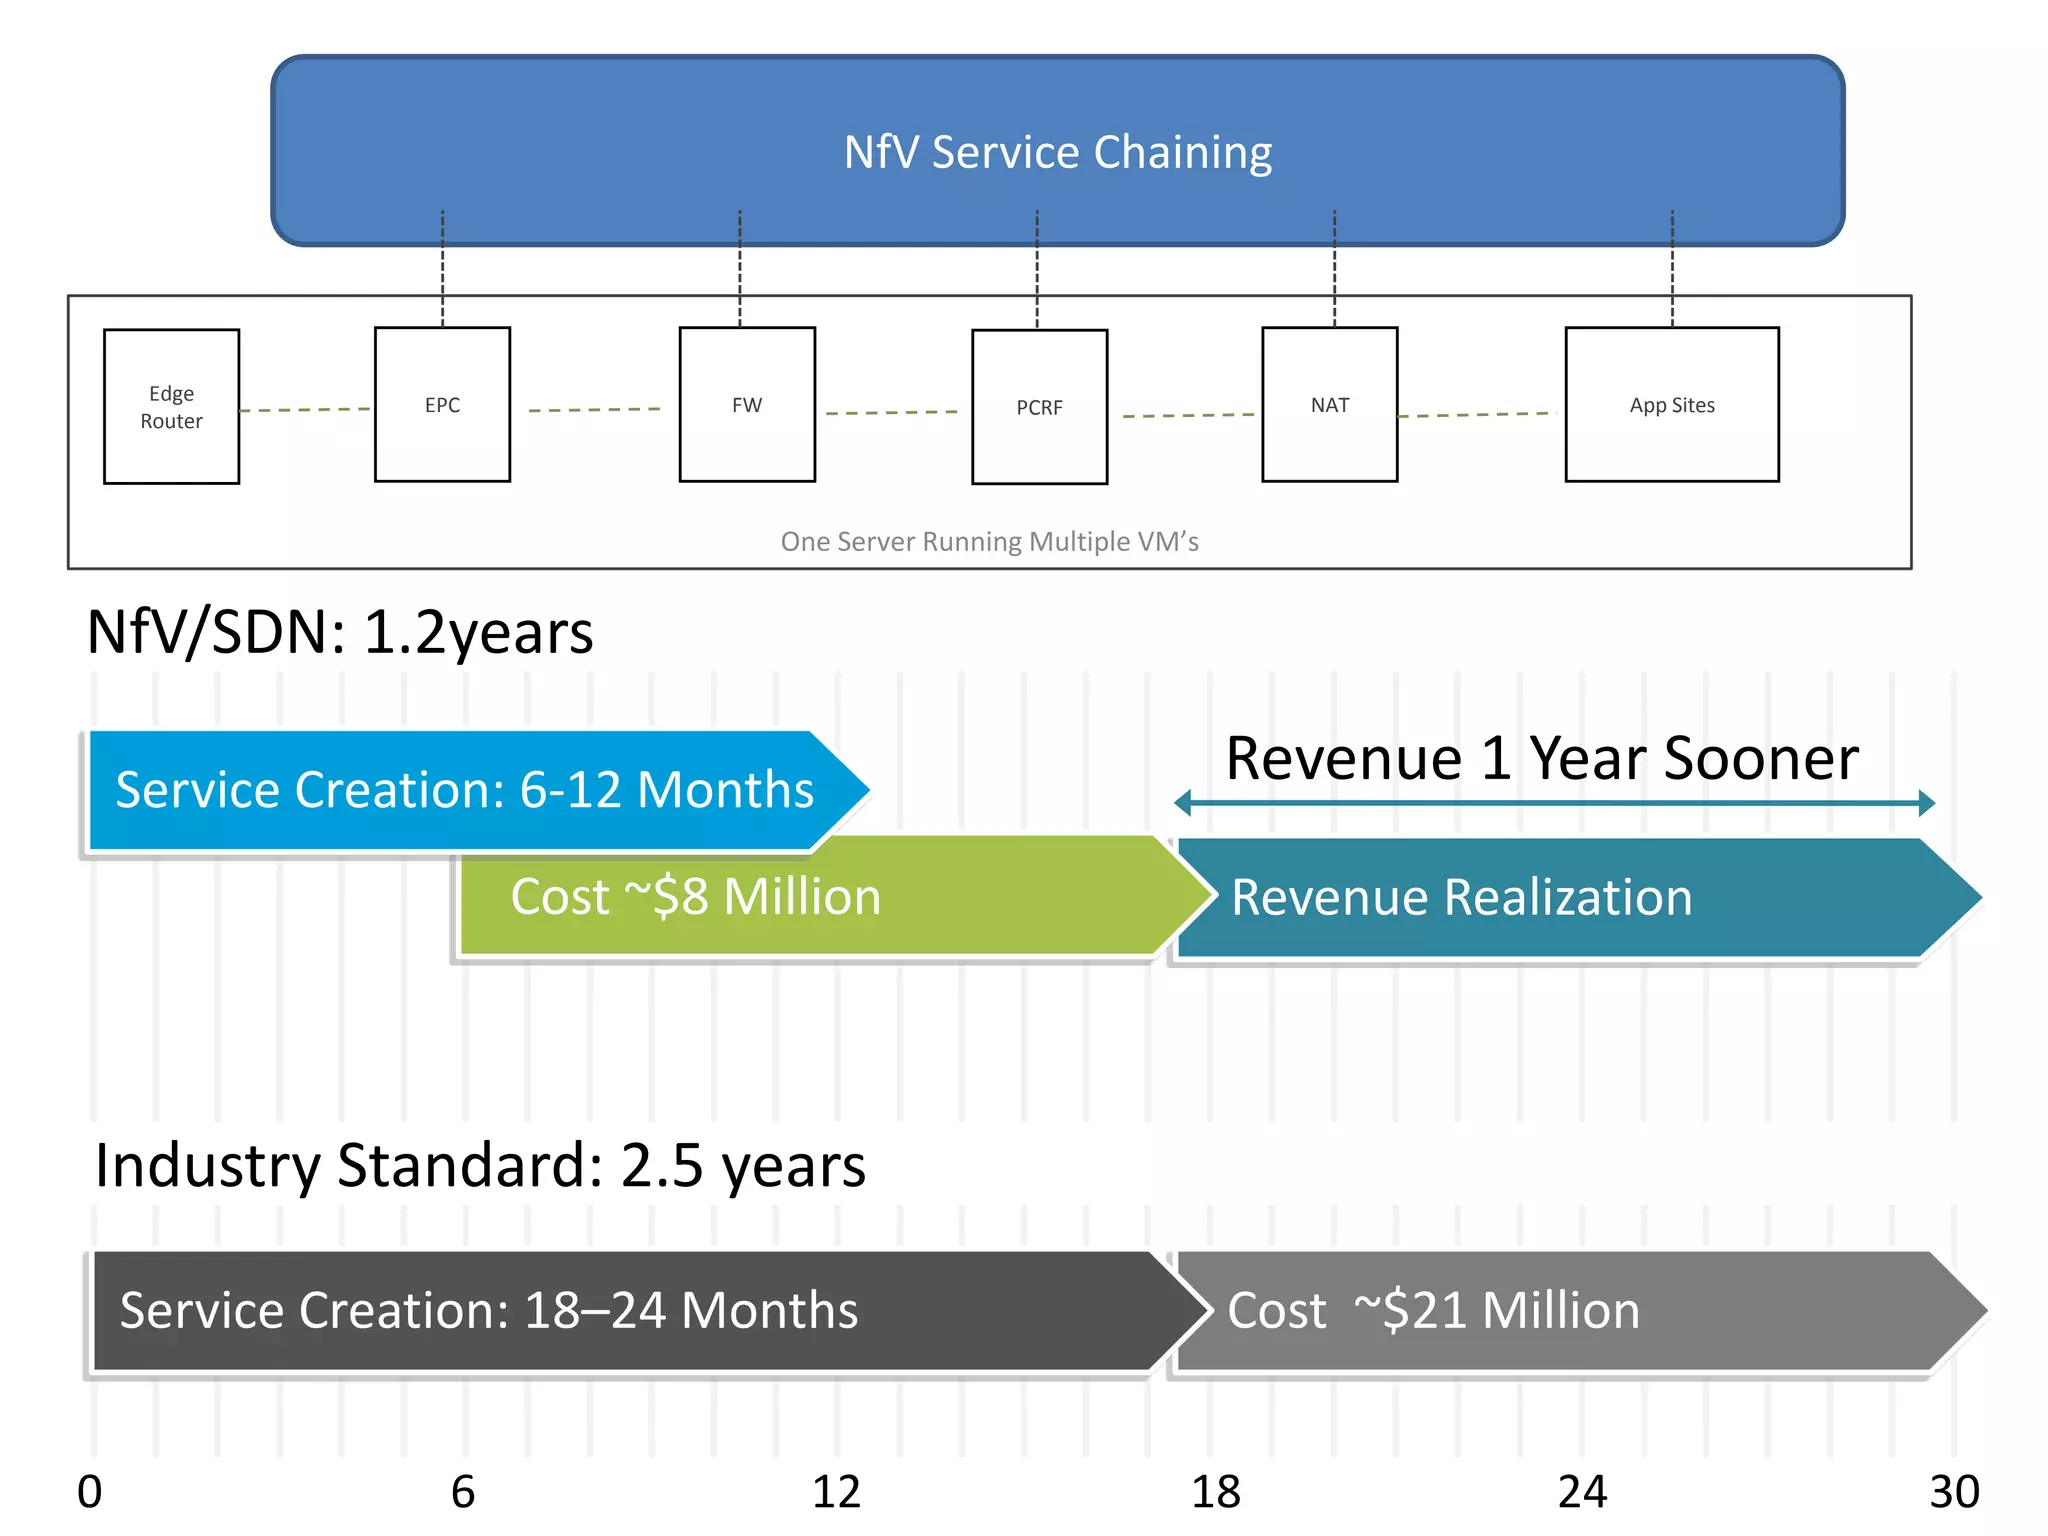
Powering Opportunity Everywhere:
Embracing New Service Models in a Mobile, Virtual
World
Ray Mota
rmota@acgresearch.net
Twitter: @rmota
World GDP growth of 4.0% in 2011 fell to 3.2% in 2012. The IMF
sees 3.3% growth in 2013
Economic Uncertainty
US
Europe
• Studies estimate a 1.6% increase in regional GDPs with
every 5% increase in broadband service penetration
(integrated across consumer, business, mobile and fixed)
– Source: ‘Latin America Insights 2013’, Monica Zlotogorski, Telesperience,
and Annie Turner, TMF
4
The Benefits of Doing More
• 29% of IT directors surveyed in a Q1 2013 study said their use of public cloud services would
increase in 2013 ..
 And 50% of those said their preferred supplier for public cloud IT is an existing telecom or managed
services provider (vs pure play cloud, vendor-based cloud, or SI/VAR delivered cloud)
 Source: ‘2013 Latin America IT Priorities’, Tech Target, February 2013
• Studies also show firms who increase their use of ICT
by 10% increase their productivity on average 0.6%
 Source: ‘Information and Communication Technologies and
Productivity Growth’, T. Kretschmer, OECD Digital Economy Papers,
2012
$-
$20,000
$40,000
$60,000
$80,000
$100,000
$120,000
$140,000
Domestic International Total
Global Capex Trends
2013 Seasonal Trend
1H 2H-E
-15.0%
-10.0%
-5.0%
0.0%
5.0%
10.0%
15.0%
20.0%
25.0%
2009 2010 2011 2012 2013E
Capex Yr/Yr Growth
Domestic International Total
$-
$10,000
$20,000
$30,000
$40,000
$50,000
$60,000
$70,000
$80,000
$90,000
$100,000
EMEA APAC CALA Total
International Capex Trends by Region
2013 Seasonal Trend
1H 2H-E
-20.0%
-10.0%
0.0%
10.0%
20.0%
30.0%
40.0%
2009 2010 2011 2012 2013E
Capex Yr/Yr Growth
EMEA APAC CALA Total
Service Provider - ARPU
Fixed Data
Fixed Voice
Mobile Voice
Mobile Data
$0
2009
$45
2013
Think APPU
Service Provider – Cost and Profits
0%
2009
75%
2013
15%
65% OPEX/Revenue
CAPEX/Revenue
DC Virtualization WAN Virtualization Traffic Steering - SP & Ent
Network Performance
Improvement
Enterprise campus
Private DC interconnect - R&S
between DC's by assigning
VM's, looks like single DC Security steering into FW - by customer Latency Computation
SP networks
Is a use case where you can use
OpenFlow to provide dynamic
traffic steering between
datacenters over the WAN via
centralized traffic engineering
with an OpenFlow Conroller. Network Analytics
Optimized video traffic
management
SP mobile access Network monitoring-virtual patch panel Bandwidth on Demand
Cloud gateway for VPN services SP wired WAN Data mining
Multilayer Optimization - Packet
Optical
Campus network slicing - private
networks on one full network
R&E - meteorology, physics, film
VGI, Offline TE and planning Self service provisioning
Enterprise private cloud CALEA tool Flexible fabric for OTT services
Enterprise private security Probe traffic collection
Enterprise private access Application delivery/load balancing
Enterprise private WAN - inter DC SLA management
Parental control
14
Use Case: Open Online Marketplace for
Applications, Programming, and Business Development
(European Operator)
• Operator’s software provides open interfaces + transactions for both consumer and business markets (TV, fixed +
mobile broadband formats for consumer; platform, sector + supply chain formats for business)
• Subscriber self-service and multi-screen delivery provide easy access + uptake
• Steady multi-double digit growth in IP TV subscriptions, IP TV add-on apps, mobile phone subscriptions + add-on
apps, and business apps subscriptions and advertising revenues has resulted
• Overall footprint (broadband uptake), breadth of catalogue, and mix of revenue sources for the operator have
increased ..
• .. nearly all software-driven!
IP TV
Consumer Web + Data
Business Virtual IT
App and Business Ecosystem
Collaboration Platform
Internet Capable TV
Home Wireless
Consumer Mobile User
Business Mobile User
Application Providers
Entertainment / Program Suppliers
Advertisers
Suppliers / Partners
Ecosystem
Open Software + APIs
LoB Transactions + Relationships
NfV Service Chaining
One Server Running Multiple VM’s
Edge
Router
EPC FW PCRF NAT App Sites
Revenue Realization
6 12 18 24 300
Industry Standard: 2.5 years
Cost ~$21 MillionService Creation: 18–24 Months
NfV/SDN: 1.2years
Cost ~$8 Million
Service Creation: 6-12 Months Revenue 1 Year Sooner
Five-Year Cumulative Operations Expense Comparison
Market in Transition: Cloud/Virtual CPE
APPU +32%

Sdn nf v_cala_slides

  • 1.
    Powering Opportunity Everywhere: EmbracingNew Service Models in a Mobile, Virtual World Ray Mota rmota@acgresearch.net Twitter: @rmota
  • 2.
    World GDP growthof 4.0% in 2011 fell to 3.2% in 2012. The IMF sees 3.3% growth in 2013 Economic Uncertainty US Europe
  • 4.
    • Studies estimatea 1.6% increase in regional GDPs with every 5% increase in broadband service penetration (integrated across consumer, business, mobile and fixed) – Source: ‘Latin America Insights 2013’, Monica Zlotogorski, Telesperience, and Annie Turner, TMF 4 The Benefits of Doing More • 29% of IT directors surveyed in a Q1 2013 study said their use of public cloud services would increase in 2013 ..  And 50% of those said their preferred supplier for public cloud IT is an existing telecom or managed services provider (vs pure play cloud, vendor-based cloud, or SI/VAR delivered cloud)  Source: ‘2013 Latin America IT Priorities’, Tech Target, February 2013 • Studies also show firms who increase their use of ICT by 10% increase their productivity on average 0.6%  Source: ‘Information and Communication Technologies and Productivity Growth’, T. Kretschmer, OECD Digital Economy Papers, 2012
  • 5.
    $- $20,000 $40,000 $60,000 $80,000 $100,000 $120,000 $140,000 Domestic International Total GlobalCapex Trends 2013 Seasonal Trend 1H 2H-E -15.0% -10.0% -5.0% 0.0% 5.0% 10.0% 15.0% 20.0% 25.0% 2009 2010 2011 2012 2013E Capex Yr/Yr Growth Domestic International Total
  • 6.
    $- $10,000 $20,000 $30,000 $40,000 $50,000 $60,000 $70,000 $80,000 $90,000 $100,000 EMEA APAC CALATotal International Capex Trends by Region 2013 Seasonal Trend 1H 2H-E -20.0% -10.0% 0.0% 10.0% 20.0% 30.0% 40.0% 2009 2010 2011 2012 2013E Capex Yr/Yr Growth EMEA APAC CALA Total
  • 10.
    Service Provider -ARPU Fixed Data Fixed Voice Mobile Voice Mobile Data $0 2009 $45 2013 Think APPU
  • 11.
    Service Provider –Cost and Profits 0% 2009 75% 2013 15% 65% OPEX/Revenue CAPEX/Revenue
  • 13.
    DC Virtualization WANVirtualization Traffic Steering - SP & Ent Network Performance Improvement Enterprise campus Private DC interconnect - R&S between DC's by assigning VM's, looks like single DC Security steering into FW - by customer Latency Computation SP networks Is a use case where you can use OpenFlow to provide dynamic traffic steering between datacenters over the WAN via centralized traffic engineering with an OpenFlow Conroller. Network Analytics Optimized video traffic management SP mobile access Network monitoring-virtual patch panel Bandwidth on Demand Cloud gateway for VPN services SP wired WAN Data mining Multilayer Optimization - Packet Optical Campus network slicing - private networks on one full network R&E - meteorology, physics, film VGI, Offline TE and planning Self service provisioning Enterprise private cloud CALEA tool Flexible fabric for OTT services Enterprise private security Probe traffic collection Enterprise private access Application delivery/load balancing Enterprise private WAN - inter DC SLA management Parental control
  • 14.
    14 Use Case: OpenOnline Marketplace for Applications, Programming, and Business Development (European Operator) • Operator’s software provides open interfaces + transactions for both consumer and business markets (TV, fixed + mobile broadband formats for consumer; platform, sector + supply chain formats for business) • Subscriber self-service and multi-screen delivery provide easy access + uptake • Steady multi-double digit growth in IP TV subscriptions, IP TV add-on apps, mobile phone subscriptions + add-on apps, and business apps subscriptions and advertising revenues has resulted • Overall footprint (broadband uptake), breadth of catalogue, and mix of revenue sources for the operator have increased .. • .. nearly all software-driven! IP TV Consumer Web + Data Business Virtual IT App and Business Ecosystem Collaboration Platform Internet Capable TV Home Wireless Consumer Mobile User Business Mobile User Application Providers Entertainment / Program Suppliers Advertisers Suppliers / Partners Ecosystem Open Software + APIs LoB Transactions + Relationships
  • 15.
    NfV Service Chaining OneServer Running Multiple VM’s Edge Router EPC FW PCRF NAT App Sites Revenue Realization 6 12 18 24 300 Industry Standard: 2.5 years Cost ~$21 MillionService Creation: 18–24 Months NfV/SDN: 1.2years Cost ~$8 Million Service Creation: 6-12 Months Revenue 1 Year Sooner
  • 16.
  • 17.
    Market in Transition:Cloud/Virtual CPE APPU +32%

Editor's Notes

  • #15 TMF QI Enterprise Services p 9