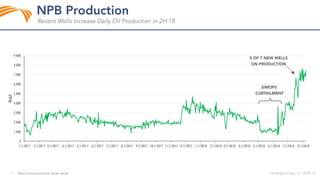
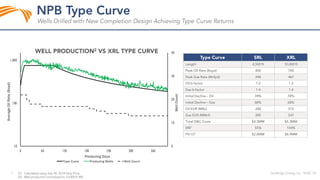
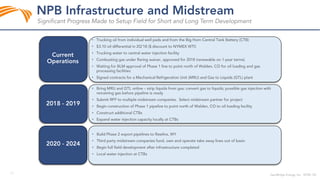
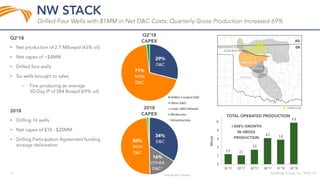
This presentation includes "forward-looking statements" within the meaning of Section 27A of the Securities Act of 1933, as amended, and Section 21E of the Securities
Exchange Act of 1934, as amended. These statements express a belief, expectation or intention and are generally accompanied by words that convey projected future
events or outcomes. The forward-looking statements include projections and statements about the company’s corporate strategies, future operations, development
plans and appraisal programs, projected acreage position, drilling inventory and locations, estimated oil, and natural gas and natural gas liquids production, rates of
return, reserves, price realizations and differentials, hedging program, projected operating, general and administrative and other costs, projected capital expenditures,
tax rates, efficiency and cost reduction initiative outcomes, liquidity and capital structure and infrastructure assessment and investment. We have based these forward-
looking statements on our current expectations and assumptions and analyses made by us in light of our experience and our perception of historical trends, current
conditions and expected future developments, as well as other factors we believe are appropriate under the circumstances. However, whether actual results and
developments will conform with our expectations and predictions is subject to a number of risks and uncertainties, including the volatility of oil and natural gas prices,
our success in discovering, estimating, developing and replacing oil and natural gas reserves, actual decline curves and the actual effect of adding compression to
natural gas wells, the availability and terms of capital, the ability of counterparties to transactions with us to meet their obligations, our timely execution of hedge
transactions, credit conditions of global capital markets, changes in economic conditions, the amount and timing of future development costs, the availability and
demand for alternative energy sources, regulatory changes, including those related to carbon dioxide and greenhouse gas emissions, and other factors, many of which
are beyond our control.
We refer you to the discussion of risk factors in Part I, Item 1A – “Risk Factors” of our Annual Report on Form 10-K and in comparable “Risk Factors” sections of our
Quarterly Reports on Form 10-Q filed after such Form 10-K. All of the forward-looking statements made in this presentation are qualified by these cautionary
statements. The actual results or developments anticipated may not be realized or, even if substantially realized, they may not have the expected consequences to or
effects on our company or our business or operations. Such statements are not guarantees of future performance and actual results or developments may differ
materially from those projected in the forward-looking statements. We undertake no obligation to update or revise any forward-looking statements.
The SEC permits oil and natural gas companies, in their filings with the SEC, to disclose only proved, probable and possible reserves, as each is defined by the SEC. At
times we use the term "EUR" (estimated ultimate recovery) that the SEC’s guidelines prohibit us from including in filings with the SEC. These estimates are by their
nature more speculative than estimates of proved, probable or possible reserves and, accordingly, are subject to substantially greater risk of being actually realized by
the company. For a discussion of the company’s proved reserves, as calculated under current SEC rules, we refer you to the company’s amended Annual Report on Form
10-K referenced above, which is available on our website at www.sandridgeenergy.com and at the SEC’s website at www.sec.gov
•
•
•
•
•
•
35.6
32.4
31.0 - 32.6
0.0
10.0
20.0
30.0
40.0
Q1 '18 Q2 '18 2018 Guidance
•
•
•
•
•
•
•
•
•
•
•
•
•
•
•
$25.7 $24.7
$20.8
$13.9
$11.1
$9.8
2017 Quarterly Average Q1 '18 Q2 '18
LOE Adj. G&A
$39.5
$35.8
$30.6
•
–
–
–
•
–
–
–
•
•
•
•
•
•
–
•
–
•
–
–
–
•
•
•
•
•
•
•
•
•
•
•
•
•
0
500
1,000
1,500
2,000
0 30 60
OilRate(Bopd)
Producing Days
0
1,000
2,000
3,000
4,000
5,000
6,000
7,000
8,000
9,000
1/1/2017 2/1/2017 3/1/2017 4/1/2017 5/1/2017 6/1/2017 7/1/2017 8/1/2017 9/1/2017 10/1/2017 11/1/2017 12/1/2017 1/1/2018 2/1/2018 3/1/2018 4/1/2018 5/1/2018 6/1/2018 7/1/2018 8/1/2018
Bopd
•
•
•
•
•
•
0
10
20
30
40
10
100
1,000
0 60 120 180 240 300 360
WellCount
AverageOilRate(Bopd)
Producing Days
Type Curve Producing Wells Well Count
•
•
•
•
•
•
•
•
•
•
•
•
•
•
•
•
•
•
•
•
•
•
39
%
Oil
2.4 2.1
3.4
6.2 5.8
9.8
0
2
4
6
8
10
Q1 '17 Q2 '17 Q3 '17 Q4 '17 Q1 '18 Q2 '18
MBoepd
•
–
62
36
27 28 26
18
0
20
40
60
80
Q1'17 Q2'17 Q3'17 Q4'17 Q1'18 Q2'18
310
518
582 548
629
837
0
250
500
750
1000
Q1 '17 Q2 '17 Q3 '17 Q4 '17 Q1 '18 Q2 '18
•
–
$279
$190 $179 $182 $169
$137
$0
$100
$200
$300
Q1'17 Q2'17 Q3'17 Q4'17 Q1'18 Q2'18
•
–
•
•
•
•
0
10
20
30
40
50
60
70
80
90
100
10
100
1,000
0 60 120 180 240 300 360
WellCount
AverageBoepd
Producing Days
Average Boe Type Curve Well Count
•
•
•
•
•
•
•
•
•
•
•
•
•
•
•
•
•
•
–
–
–
–
•
–
Sd investor presentation q2'18

Sd investor presentation q2'18

  • 2.
    This presentation includes"forward-looking statements" within the meaning of Section 27A of the Securities Act of 1933, as amended, and Section 21E of the Securities Exchange Act of 1934, as amended. These statements express a belief, expectation or intention and are generally accompanied by words that convey projected future events or outcomes. The forward-looking statements include projections and statements about the company’s corporate strategies, future operations, development plans and appraisal programs, projected acreage position, drilling inventory and locations, estimated oil, and natural gas and natural gas liquids production, rates of return, reserves, price realizations and differentials, hedging program, projected operating, general and administrative and other costs, projected capital expenditures, tax rates, efficiency and cost reduction initiative outcomes, liquidity and capital structure and infrastructure assessment and investment. We have based these forward- looking statements on our current expectations and assumptions and analyses made by us in light of our experience and our perception of historical trends, current conditions and expected future developments, as well as other factors we believe are appropriate under the circumstances. However, whether actual results and developments will conform with our expectations and predictions is subject to a number of risks and uncertainties, including the volatility of oil and natural gas prices, our success in discovering, estimating, developing and replacing oil and natural gas reserves, actual decline curves and the actual effect of adding compression to natural gas wells, the availability and terms of capital, the ability of counterparties to transactions with us to meet their obligations, our timely execution of hedge transactions, credit conditions of global capital markets, changes in economic conditions, the amount and timing of future development costs, the availability and demand for alternative energy sources, regulatory changes, including those related to carbon dioxide and greenhouse gas emissions, and other factors, many of which are beyond our control. We refer you to the discussion of risk factors in Part I, Item 1A – “Risk Factors” of our Annual Report on Form 10-K and in comparable “Risk Factors” sections of our Quarterly Reports on Form 10-Q filed after such Form 10-K. All of the forward-looking statements made in this presentation are qualified by these cautionary statements. The actual results or developments anticipated may not be realized or, even if substantially realized, they may not have the expected consequences to or effects on our company or our business or operations. Such statements are not guarantees of future performance and actual results or developments may differ materially from those projected in the forward-looking statements. We undertake no obligation to update or revise any forward-looking statements. The SEC permits oil and natural gas companies, in their filings with the SEC, to disclose only proved, probable and possible reserves, as each is defined by the SEC. At times we use the term "EUR" (estimated ultimate recovery) that the SEC’s guidelines prohibit us from including in filings with the SEC. These estimates are by their nature more speculative than estimates of proved, probable or possible reserves and, accordingly, are subject to substantially greater risk of being actually realized by the company. For a discussion of the company’s proved reserves, as calculated under current SEC rules, we refer you to the company’s amended Annual Report on Form 10-K referenced above, which is available on our website at www.sandridgeenergy.com and at the SEC’s website at www.sec.gov
  • 3.
  • 4.
    35.6 32.4 31.0 - 32.6 0.0 10.0 20.0 30.0 40.0 Q1'18 Q2 '18 2018 Guidance • • • • • • • •
  • 5.
    • • • • • • • $25.7 $24.7 $20.8 $13.9 $11.1 $9.8 2017 QuarterlyAverage Q1 '18 Q2 '18 LOE Adj. G&A $39.5 $35.8 $30.6
  • 6.
  • 7.
  • 9.
  • 10.
    0 1,000 2,000 3,000 4,000 5,000 6,000 7,000 8,000 9,000 1/1/2017 2/1/2017 3/1/20174/1/2017 5/1/2017 6/1/2017 7/1/2017 8/1/2017 9/1/2017 10/1/2017 11/1/2017 12/1/2017 1/1/2018 2/1/2018 3/1/2018 4/1/2018 5/1/2018 6/1/2018 7/1/2018 8/1/2018 Bopd
  • 11.
  • 12.
    0 10 20 30 40 10 100 1,000 0 60 120180 240 300 360 WellCount AverageOilRate(Bopd) Producing Days Type Curve Producing Wells Well Count
  • 13.
  • 14.
  • 15.
    • – 62 36 27 28 26 18 0 20 40 60 80 Q1'17Q2'17 Q3'17 Q4'17 Q1'18 Q2'18 310 518 582 548 629 837 0 250 500 750 1000 Q1 '17 Q2 '17 Q3 '17 Q4 '17 Q1 '18 Q2 '18 • – $279 $190 $179 $182 $169 $137 $0 $100 $200 $300 Q1'17 Q2'17 Q3'17 Q4'17 Q1'18 Q2'18 • –
  • 16.
  • 19.
    0 10 20 30 40 50 60 70 80 90 100 10 100 1,000 0 60 120180 240 300 360 WellCount AverageBoepd Producing Days Average Boe Type Curve Well Count
  • 20.
  • 21.
  • 23.