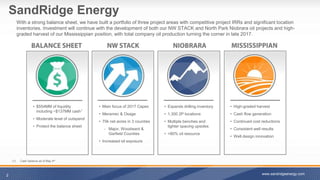
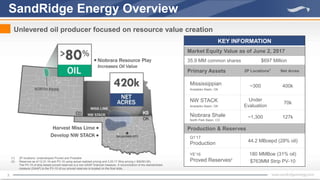
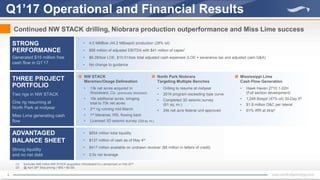
INVESTOR
PRESENTATION
JUNE 2017
Cautionary Statements
This presentation includes "forward-looking statements" within the meaning of Section 27A of the Securities Act of 1933, as amended, and Section 21E of the
Securities Exchange Act of 1934, as amended. These statements express a belief, expectation or intention and are generally accompanied by words that convey
projected future events or outcomes. The forward-looking statements include statements about the company’s corporate strategies, future operations, development
plans and appraisal programs, our drilling inventory and locations, estimated production, rates of return, reserves, projected capital expenditures, projected operating
and other costs, operational optimization initiatives, anticipated efficiency improvements and cost reductions, liquidity and capital structure. We have based these
forward-looking statements on our current expectations and assumptions and analyses made by us in light of our experience and our perception of historical trends,
current conditions and expected future developments, as well as other factors we believe are appropriate under the circumstances. However, whether actual results
and developments will conform with our expectations and predictions is subject to a number of risks and uncertainties, including the volatility of oil and natural gas
prices, our success in discovering, estimating, and developing oil and natural gas reserves, the availability and terms of capital, our timely execution of hedge
transactions, credit conditions of global capital markets, changes in economic conditions, regulatory changes and other factors, many of which are beyond our
control.
We refer you to the discussion of risk factors in Part I, Item 1A – “Risk Factors” of our Annual Report on Form 10-K for the year ended December 31, 2016 and in
comparable “Risk Factors” sections of our Quarterly Reports on Form 10-Q filed after such Form 10-K. All of the forward-looking statements made in this
presentation are qualified by these cautionary statements. The actual results or developments anticipated may not be realized or, even if substantially realized, they
may not have the expected consequences to or effects on our company or our business or operations. Such statements are not guarantees of future performance
and actual results or developments may differ materially from those projected in the forward-looking statements. We undertake no obligation to update or revise any
forward-looking statements.
The SEC permits oil and natural gas companies, in their filings with the SEC, to disclose only proved, probable and possible reserves, as each is defined by the SEC.
At times we use the terms "EUR" (estimated ultimate recovery) and “recoverable reserves” that the SEC’s guidelines prohibit us from including in filings with the SEC.
These estimates are by their nature more speculative than estimates of proved, probable or possible reserves and, accordingly, are subject to substantially greater
risk of being actually realized by the company. For a discussion of the company’s proved reserves, as calculated under current SEC rules, we refer you to the
company’s amended Annual Report on Form 10-K referenced above, which is available on our website at www.sandridgeenergy.com and at the SEC’s website at
www.sec.gov.
1
Forward Looking Statement
www.sandridgeenergy.com
SandRidge Energy
With a strong balance sheet, we have built a portfolio of three project areas with competitive project IRRs and significant location
inventories. Investment will continue with the development of both our NW STACK and North Park Niobrara oil projects and high-
graded harvest of our Mississippian position, with total company oil production turning the corner in late 2017.
2 www.sandridgeenergy.com
• $554MM of liquidity
including ~$137MM cash1
• Moderate level of outspend
• Protect the balance sheet
• High-graded harvest
• Cash flow generation
• Continued cost reductions
• Consistent well results
• Well design innovation
• Expands drilling inventory
• 1,300 2P locations
• Multiple benches and
tighter spacing upsides
• >80% oil resource
• Main focus of 2017 Capex
• Meramec & Osage
• 70k net acres in 3 counties
‐ Major, Woodward &
Garfield Counties
• Increased oil exposure
(1) Cash balance as of May 4th
3
SandRidge Energy Overview
Unlevered oil producer focused on resource value creation
KEY INFORMATION
Market Equity Value as of June 2, 2017
35.9 MM common shares $697 Million
Primary Assets 2P Locations1
Net Acres
Mississippian
Anadarko Basin, OK
~300 400k
NW STACK
Anadarko Basin, OK
Under
Evaluation
70k
Niobrara Shale
North Park Basin, CO
~1,300 127k
Production & Reserves
Q1’17
Production 44.2 MBoepd (28% oil)
YE’16
Proved Reserves2
180 MMBoe (31% oil)
$763MM Strip PV-10
(1) 2P locations: Undeveloped Proved and Probable
(2) Reserves as of 12.31.16 and PV-10 using actual realized pricing and 3.20.17 Strip pricing (~$50/$3.00).
The PV-10 of strip-based proved reserves is a non-GAAP financial measure. A reconciliation of the standardized
measure (GAAP) to the PV-10 of our proved reserves is located on the final slide.
NW STACK
Meramec/Osage Delineation
• 13k net acres acquired in
Woodward, Co. (previously disclosed)
• 10k additional acres, bringing
total to 70k net acres
• 2nd rig running mid-March
• 1st Meramec XRL flowing back
• Licensed 3D seismic survey (329 sq. mi.)
4
Q1’17 Operational and Financial Results
• 4.0 MMBoe (44.2 MBoepd) production (28% oil)
• $56 million of adjusted EBITDA with $41 million of capex1
• $6.28/boe LOE, $10.51/boe total adjusted cash expenses (LOE + severance tax and adjusted cash G&A)
• No change to guidance
• $554 million total liquidity
• $137 million of cash as of May 4th
• $417 million available on undrawn revolver ($8 million in letters of credit)
• 0.0x net leverage
STRONG
PERFORMANCE
Generated $15 million free
cash flow in Q1’17
Mississippi Lime
Cash Flow Generation
• Hawk Haven 2710 1-22H
(Full section development)
• 1,248 Boepd (47% oil) 30-Day IP
• $1.8 million D&C per lateral
• 61% IRR at strip2
ADVANTAGED
BALANCE SHEET
Strong liquidity
and no net debt
North Park Niobrara
Targeting Multiple Benches
• Drilling to resume at midyear
• 2016 program exceeding type curve
• Completed 3D seismic survey
(61 sq. mi.)
• 24k net acre federal unit approved
(1) Excludes $48 million NW STACK acquisition (Woodward Co.) announced on Feb 22nd
(2) @ April 26th Strip pricing (~$50 /~$3.00)
Continued NW STACK drilling, Niobrara production outperformance and Miss Lime success
THREE PROJECT
PORTFOLIO
Two rigs in NW STACK
One rig resuming at
North Park at midyear
Miss Lime generating cash
flow
5
NW STACK Industry Activity
SD currently running 2 rigs across 70k acres in NW STACK (Major, Woodward and Garfield Co.)
• Multiple operators with NW STACK
Meramec and Osage results
• 20 rigs currently running
• Over 100 Meramec and Osage wells
producing in NW STACK
INDUSTRY ACTIVITY ADJACENT TO SD ACREAGE Industry activity has been converging
on existing SD acreage with prominent
operators seeing encouraging results:
6
NW STACK Primary Targets
NW STACK Meramec and Osage same productive formation as in STACK
Structurally deepens from northeast to southwest
Meramec 5,800’-12,400’ TVD
• Below the Chester (where present)
• Interbedded shales, sands, and
carbonates
• Thickness from 50’-160’
• Matrix porosity development in limey-sand
zones with some secondary fracturing
Lower Osage 5,900’-12,500’ TVD
• Dense limestone and cherts
• Thickness from 450’-1,300’
• Natural fracturing enhances productivity
7
SandRidge NW STACK Delineation
2 Rigs currently running across three counties
2017 D&C capex of $65-70MM
• 22 gross laterals (17 net laterals)
• Major, Woodward, and Garfield Co.
• Targeting the Meramec
• Drilling mostly XRLs
Currently completing
• Campbell 2015 1-26H 23H (Major Co. XRL)
Currently drilling
• Jack Samuel 2012 1-20H 29H (Major Co. XRL)
• Landrum 2305 1-30 31H (Garfield Co. XRL)
70K NET ACRES IN NW STACK
8
Industry Meramec Results
Meramec initial production has averaged 700-800 Boepd and ~60% oil on wells
surrounding SD’s NW STACK acreage position
9
Industry Osage Results
Osage initial production has averaged 700-800 Boepd and ~40% oil on wells
surrounding SD’s NW STACK acreage position
10
• Ten wells drilled in 2016 including one XRL and
one “C” bench producer with production
outperforming type curve
• Targeting sub-$3.5MM per lateral in 2017 with
projected 600 MBoe total EUR
• Drill Niobrara “B”, “C” & “D” bench XRLs
• Drill an XRL to hold 24k net acre Rabbit Ears
Federal Unit
• Process and interpret new 3D seismic survey;
acquire a full core across the Niobrara
North Park Niobrara Asset Overview
Drilling in 2017 focuses on XRLs, multiple benches and establishes new federal unit
• 1,300 2P Locations
• 127k Net acres
2017 activity will help optimize full
development planning
11
Targeting Multiple Niobrara Benches
Similar geologic characteristics to the DJ Basin Niobrara but higher oil cut
NORTH PARK
BASIN
DJ
BASIN
Oil EUR % >80% ~35%
Depth 5,500 – 9,000 ft. 6,000 – 8,000 ft.
Reservoir Storage Capacity
Gross Thickness
Porosity
450 – 480 ft.
6 – 9%
150 – 300 ft.
6 – 10%
OOIP per Section 63.8 MMBo 41.3 MMBo
Thermal Maturity (Ro) 0.75 – 1.0% 0.5 – 1.4+%
Reservoir Production
Potential
Reservoir Pressure
Gas-oil Ratio (GOR)
Total Organic Content
> 0.55 psi/ft
600 – 700 scf/stb
3%
0.41 - 0.60 psi/ft
Up to 10,000+ scf/stb
3%
12
2016 Niobrara Program Success
11 laterals drilled in 2016, outperforming type curve
Lowered costs, optimized completions, drilled first XRL and “C” bench wells
First XRL in the basin
• 2-mile lateral (Castle 1-17H 20) drilled and completed
completed for $3.4MM per lateral with a 30-Day IP of
of 901 Boepd (91% oil)
First “C” bench well
• Niobrara “C” bench test (Hebron 4-18H) resulted in
second highest per lateral 30-Day IP of 539 Boepd (92%
(92% oil)
Advanced drilling and completion designs
• Reduced cycle times, confirmed preference for cross-
cross-linked gel (vs slickwater) fracs
2016 DRILLING RESULTS
Note: 30-Day IP rates shown above
13
First SandRidge Niobrara C Bench Lateral
Hebron 4-18H cumulative oil production exceeds type curve by 32%
539 Boepd (92% oil) 30-Day IP
DAILY OIL RATE CUMULATIVE OIL
Jet Pump Installed
14
901 Boepd (91% oil) 30-Day IP
First SandRidge Niobrara XRL
Castle 1-17H exceeding type curve, drilled and completed for $3.4MM per lateral
DAILY OIL RATE CUMULATIVE OIL
Jet Pump Installed
Jet Pump Installed
15
Current year program to feature XRLs with crosslinked completions
2016 DRILLING PROGRAM
2016 Niobrara Oil Production Above Type Curve
2016 CROSSLINKED COMPLETIONS ONLY
RABBIT
EARS UNIT
24k Net Acres
SURPRISE UNIT
22k Net Acres
PETERSON
RIDGE UNIT
22k Net Acres
BEAVER CREEK UNIT
11k Net Acres
(Proposed)
16
• Peterson Ridge Unit: 22k net acres
• Surprise Unit: 22k net acres
• Rabbit Ears Unit: 24k net acres
– Planned XRL to be drilled in Rabbit Ears Unit
will hold the 24k net acres
• (Proposed) Beaver Creek Unit: 11k net acres
Large Contiguous North Park Acreage Position
2017 drilling increases acreage held by production or by unit
to ~75% of existing 127k net acre position
71k net acres currently held by production or
unit (56% of 127k net acre position).
Three existing and one proposed Federal Unit:
17
North Park Basin Oil and Gas Takeaway
Favorable oil marketing and gas processing will create additional revenue
Current Marketing andTakeaway Short term in-field gas processing
may include:
 Mechanical Refrigeration Units (MRU) for NGL
extraction
 Gas-to-liquids (GTL)
 Gas injection
 Potential to generate additional revenue, reduce
emissions and augment longer term
pipeline plans
 Oil trucked to market (up to 40 MBopd)
 Low ~$3.15 oil differential to WTI through 2018
 Gas combusted under appropriate permits
 Building out field gathering infrastructure; centralized
tank battery used for processing, storage and export
APPENDIX
18
19
2017 Project EURs, Economics, & Inventory
EURs &
ECONOMICS
MERAMEC NIOBRARA MISSISSIPPIAN
XRL* SINGLE XRL FSD* SINGLE
EUR, MBoe
% Oil
800 – 1,000
40%+
500 – 600
40%+
600
80%+
1,350
20%
550
20%
D&C per lateral ($MM) $3.1 $4.2 $3.4 $2.0 $2.4
IRR(a)
20 - 35% 15 - 25% 27% 52% 14%
PV-10(a) ($MM) $1.8 - $3.9 $0.6 - $1.6 $2.9 $4.7 $0.4
YE’16 INVENTORY NW STACK NIOBRARA MISSISSIPPIAN
PUDs (laterals) 6 106 51(b)
Probables (laterals) Under evaluation
(4-8 per section)
~1,180 ~180(b)
Net acres 70k 127k 400k
HBP or HBU 33% 56% 78%
a) @ Apr 26th Strip avg pricing (~$50 /~$3.00) at 100% Working Interest
b) Excluding ~70 Proven + Probable Chester locations
Diverse and material location inventory in three areas
*FSD = “Full Section Development”, equivalent to 3 laterals
*XRL = “Extended Reach Lateral”, 2-mile lateral
Year End 2016 Reserves and PV-10
20
PROVED RESERVES
OIL
MBBLS
NGLS
MBBLS
GAS
MMCF
EQUIVALENT
MBOE1
PV-102
$MM
Proved Reserves as of Dec 31, 2015
@ SEC Pricing ($50.28 / $2.59)
77,911 61,075 1,113,840 324,626 $1,315_
Production (5,529) (4,357) (56,895) (19,369)
Sale of assets (387) 0 (145,267) (24,598)
Change in accounting for trusts (6,971) (3,695) (50,508) (19,084)
Performance revisions (14,796) (21,717) (349,244) (94,720)
Pricing revisions (1,510) 876 (68,865) (12,112)
Extensions & additions 4,166 1,425 21,720 9,210
Proved Reserves as of Dec 31, 2016
@ SEC Pricing ($42.75 / $2.48)
52,884 33,607 464,782 163,955 $438_
Proved Reserves as of Dec 31, 2016
@ NYMEX Pricing (~$50 / ~$3)
55,686 37,687 521,173 180,235 $763_
(1) Equivalent Boe are calculated using an energy equivalent ratio of six Mcf of natural gas to one Bbl of crude oil. Using an energy-equivalent ratio does not factor in price differences and energy-equivalent prices may differ
significantly among produced products.
(2) PV-10 is a non-GAAP financial measure and generally differs from Standardized Measure, the most directly comparable GAAP financial measure, because it does not include the effect of income taxes on discounted future net
cash flows.
www.sandridgeenergy.com
Four Quarters of Trailing Actuals
21
ACTUALS
PRODUCTION Q2’16 Q3’16 Q4’16 Q1’17
Oil (MMBbls) 1.4 1.3 1.2 1.1
Natural Gas Liquids (MMBbls) 1.1 1.1 1.0 0.9
Total Liquids (MMBbls) 2.5 2.4 2.2 2.0
Natural Gas (Bcf) 14.5 13.1 12.8 11.8
Total (MMBoe) 5.0 4.6 4.3 4.0
Daily Oil Equivalent (MBoepd) 54.7 49.6 47.2 44.2
PRICING REALIZATIONS
Oil (differential below WTI) $3.86 $2.11 $2.28 $2.71
NGLs (realized % of WTI) 29% 31% 30% 32%
Gas (differential below Henry Hub)1
$0.47 $0.54 $0.93 $0.96
COSTS PER BOE
LOE1
$8.58 $8.68 $5.76 $6.28
Adj. G&A – Cash2
$2.88 $3.88 $3.08 $3.43
% OF NET REVENUE
Severance Taxes 2.2% 2.3% 2.7% 3.2%
(1) Q4’16 marks beginning of accounting policy change to book gas transportation fee as a net from revenue, rather than a lease operating expense
(2) Adjusted G&A - Cash is a non-GAAP financial measure as it excludes from G&A non-cash compensation, severance, bad debt allowance, and other non-recurring items. The most directly comparable GAAP measure for Adjusted
G&A - cash is General and Administrative Expense. Information to reconcile this non-GAAP financial measure to the most directly comparable GAAP financial measure is not available at this time, as management is unable to
forecast the excluded items for future periods.
www.sandridgeenergy.com
2017 Capital Expenditures Guidance
22
CAPEX GUIDANCE DETAIL $MM
Mid-Continent D&C $65 - $70
North Park D&C 20 - 25
Other - D&C1 24
Total Drilling & Completion $109 - $119
OTHER E&P
Land, G&G and Seismic $40
Infrastructure2 7
Workovers 37
Capitalized G&A and Interest 15
Total Other E&P $99
NON E&P
General Corporate 2
Total Capital Expenditures
_(excl. A&D and P&A)
$210 - $220
CAPEX GUIDANCE $MM
D&C $109 - $119
Other E&P 99
Total Exploration and Production $208 - $218
General Corporate 2
Total Capital Expenditures $210 - $220
LATERAL SPUDS GROSS NET
Mid-Continent 22 17
North Park 6 6
Total Laterals 28 23
(1) 2016 Carryover, Coring, and Non-Op
(2) Facilities - Electrical, SWD, Gathering, Pipeline ROW
www.sandridgeenergy.com
2017 Operational Guidance
23
TOTAL COMPANY PRODUCTION
Oil (MMBbls) 4.0 – 4.2
Natural Gas Liquids (MMBbls) 3.0 – 3.2
Total Liquids (MMBbls) 7.0 – 7.4
Natural Gas (Bcf) 42.0 – 43.5
Total (MMBoe) 14.0 - 14.7
PRICING REALIZATIONS
Oil (differential below WTI) $2.75
NGLs (realized % of WTI) 26%
Gas (differential below Henry Hub) $1.00
COSTS PER BOE
LOE $8.00 - $9.00
Adj. G&A – Cash1 $4.25 - $4.50
% OF NET REVENUE
Severance Taxes 2.75% - 3.00%
(1) Adjusted G&A - Cash is a non-GAAP financial measure as it excludes from G&A non-cash compensation, severance, bad debt allowance, and other non-recurring items. The most directly comparable GAAP measure for Adjusted
G&A - cash is General and Administrative Expense. Information to reconcile this non-GAAP financial measure to the most directly comparable GAAP financial measure is not available at this time, as management is unable to
forecast the excluded items for future periods.
www.sandridgeenergy.com
24
Hedging Overview
80% of oil and 77% of gas volumes hedged at the midpoint of guidance in 2017
OIL Q1’17 Q2’17 Q3’17 Q4’17 FY 2017 Q1’18 Q2’18 Q3’18 Q4’18 FY 2018
SWAPS
Volumes (MMBbls) 0.81 0.82 0.83 0.83 3.29 0.45 0.46 0.46 0.46 1.83
Price ($/Bbl) $52.24 $52.24 $52.24 $52.24 $52.24 $55.34 $55.34 $55.34 $55.34 $55.34
NATURAL GAS Q1’17 Q2’17 Q3’17 Q4’17 FY 2017 Q1’18 Q2’18 Q3’18 Q4’18 FY 2018
SWAPS
Volumes (Bcf) 8.10 8.19 8.28 8.28 32.85 4.50 2.73 2.76 2.76 12.75
Price ($/MMBtu) $3.20 $3.20 $3.20 $3.20 $3.20 $3.25 $3.11 $3.11 $3.11 $3.16
Note: As of 5.10.17
Reconciliation of Standardized Measure of
Discounted Net Cash Flows to PV-10
25 www.sandridgeenergy.com
The PV-10 of strip-based proved reserves is a non-GAAP financial measure and differs from standardized measure because it reflects the estimated proved reserves economically recoverable based on forward NYMEX strip prices rather
than SEC pricing and does not include the effects of income taxes on future net revenues.
PROVED RESERVES
SUCCESSOR
DEC 31, 2016
PREDECESSOR
DEC 31, 2015
((in millions)
Standardized measure of discounted
net cash flows1 $ 438 $ 1,314
Present value of future net income
tax expense discounted at 10%
- 1
PV-102 $ 438 $ 1,315
Effects of calculating reserves and
pricing using strip pricing
325
PV-10 of strip-based proved reserves $ 763
(1) Includes approximately $225 million attributable to SandRidge noncontrolling interests at December 31, 2015.
(2) Includes approximately $226 million attributable to SandRidge noncontrolling interests at December 31, 2015.

June investor presentation 6.5.17

  • 1.
  • 2.
    Cautionary Statements This presentationincludes "forward-looking statements" within the meaning of Section 27A of the Securities Act of 1933, as amended, and Section 21E of the Securities Exchange Act of 1934, as amended. These statements express a belief, expectation or intention and are generally accompanied by words that convey projected future events or outcomes. The forward-looking statements include statements about the company’s corporate strategies, future operations, development plans and appraisal programs, our drilling inventory and locations, estimated production, rates of return, reserves, projected capital expenditures, projected operating and other costs, operational optimization initiatives, anticipated efficiency improvements and cost reductions, liquidity and capital structure. We have based these forward-looking statements on our current expectations and assumptions and analyses made by us in light of our experience and our perception of historical trends, current conditions and expected future developments, as well as other factors we believe are appropriate under the circumstances. However, whether actual results and developments will conform with our expectations and predictions is subject to a number of risks and uncertainties, including the volatility of oil and natural gas prices, our success in discovering, estimating, and developing oil and natural gas reserves, the availability and terms of capital, our timely execution of hedge transactions, credit conditions of global capital markets, changes in economic conditions, regulatory changes and other factors, many of which are beyond our control. We refer you to the discussion of risk factors in Part I, Item 1A – “Risk Factors” of our Annual Report on Form 10-K for the year ended December 31, 2016 and in comparable “Risk Factors” sections of our Quarterly Reports on Form 10-Q filed after such Form 10-K. All of the forward-looking statements made in this presentation are qualified by these cautionary statements. The actual results or developments anticipated may not be realized or, even if substantially realized, they may not have the expected consequences to or effects on our company or our business or operations. Such statements are not guarantees of future performance and actual results or developments may differ materially from those projected in the forward-looking statements. We undertake no obligation to update or revise any forward-looking statements. The SEC permits oil and natural gas companies, in their filings with the SEC, to disclose only proved, probable and possible reserves, as each is defined by the SEC. At times we use the terms "EUR" (estimated ultimate recovery) and “recoverable reserves” that the SEC’s guidelines prohibit us from including in filings with the SEC. These estimates are by their nature more speculative than estimates of proved, probable or possible reserves and, accordingly, are subject to substantially greater risk of being actually realized by the company. For a discussion of the company’s proved reserves, as calculated under current SEC rules, we refer you to the company’s amended Annual Report on Form 10-K referenced above, which is available on our website at www.sandridgeenergy.com and at the SEC’s website at www.sec.gov. 1 Forward Looking Statement www.sandridgeenergy.com
  • 3.
    SandRidge Energy With astrong balance sheet, we have built a portfolio of three project areas with competitive project IRRs and significant location inventories. Investment will continue with the development of both our NW STACK and North Park Niobrara oil projects and high- graded harvest of our Mississippian position, with total company oil production turning the corner in late 2017. 2 www.sandridgeenergy.com • $554MM of liquidity including ~$137MM cash1 • Moderate level of outspend • Protect the balance sheet • High-graded harvest • Cash flow generation • Continued cost reductions • Consistent well results • Well design innovation • Expands drilling inventory • 1,300 2P locations • Multiple benches and tighter spacing upsides • >80% oil resource • Main focus of 2017 Capex • Meramec & Osage • 70k net acres in 3 counties ‐ Major, Woodward & Garfield Counties • Increased oil exposure (1) Cash balance as of May 4th
  • 4.
    3 SandRidge Energy Overview Unleveredoil producer focused on resource value creation KEY INFORMATION Market Equity Value as of June 2, 2017 35.9 MM common shares $697 Million Primary Assets 2P Locations1 Net Acres Mississippian Anadarko Basin, OK ~300 400k NW STACK Anadarko Basin, OK Under Evaluation 70k Niobrara Shale North Park Basin, CO ~1,300 127k Production & Reserves Q1’17 Production 44.2 MBoepd (28% oil) YE’16 Proved Reserves2 180 MMBoe (31% oil) $763MM Strip PV-10 (1) 2P locations: Undeveloped Proved and Probable (2) Reserves as of 12.31.16 and PV-10 using actual realized pricing and 3.20.17 Strip pricing (~$50/$3.00). The PV-10 of strip-based proved reserves is a non-GAAP financial measure. A reconciliation of the standardized measure (GAAP) to the PV-10 of our proved reserves is located on the final slide.
  • 5.
    NW STACK Meramec/Osage Delineation •13k net acres acquired in Woodward, Co. (previously disclosed) • 10k additional acres, bringing total to 70k net acres • 2nd rig running mid-March • 1st Meramec XRL flowing back • Licensed 3D seismic survey (329 sq. mi.) 4 Q1’17 Operational and Financial Results • 4.0 MMBoe (44.2 MBoepd) production (28% oil) • $56 million of adjusted EBITDA with $41 million of capex1 • $6.28/boe LOE, $10.51/boe total adjusted cash expenses (LOE + severance tax and adjusted cash G&A) • No change to guidance • $554 million total liquidity • $137 million of cash as of May 4th • $417 million available on undrawn revolver ($8 million in letters of credit) • 0.0x net leverage STRONG PERFORMANCE Generated $15 million free cash flow in Q1’17 Mississippi Lime Cash Flow Generation • Hawk Haven 2710 1-22H (Full section development) • 1,248 Boepd (47% oil) 30-Day IP • $1.8 million D&C per lateral • 61% IRR at strip2 ADVANTAGED BALANCE SHEET Strong liquidity and no net debt North Park Niobrara Targeting Multiple Benches • Drilling to resume at midyear • 2016 program exceeding type curve • Completed 3D seismic survey (61 sq. mi.) • 24k net acre federal unit approved (1) Excludes $48 million NW STACK acquisition (Woodward Co.) announced on Feb 22nd (2) @ April 26th Strip pricing (~$50 /~$3.00) Continued NW STACK drilling, Niobrara production outperformance and Miss Lime success THREE PROJECT PORTFOLIO Two rigs in NW STACK One rig resuming at North Park at midyear Miss Lime generating cash flow
  • 6.
    5 NW STACK IndustryActivity SD currently running 2 rigs across 70k acres in NW STACK (Major, Woodward and Garfield Co.) • Multiple operators with NW STACK Meramec and Osage results • 20 rigs currently running • Over 100 Meramec and Osage wells producing in NW STACK INDUSTRY ACTIVITY ADJACENT TO SD ACREAGE Industry activity has been converging on existing SD acreage with prominent operators seeing encouraging results:
  • 7.
    6 NW STACK PrimaryTargets NW STACK Meramec and Osage same productive formation as in STACK Structurally deepens from northeast to southwest Meramec 5,800’-12,400’ TVD • Below the Chester (where present) • Interbedded shales, sands, and carbonates • Thickness from 50’-160’ • Matrix porosity development in limey-sand zones with some secondary fracturing Lower Osage 5,900’-12,500’ TVD • Dense limestone and cherts • Thickness from 450’-1,300’ • Natural fracturing enhances productivity
  • 8.
    7 SandRidge NW STACKDelineation 2 Rigs currently running across three counties 2017 D&C capex of $65-70MM • 22 gross laterals (17 net laterals) • Major, Woodward, and Garfield Co. • Targeting the Meramec • Drilling mostly XRLs Currently completing • Campbell 2015 1-26H 23H (Major Co. XRL) Currently drilling • Jack Samuel 2012 1-20H 29H (Major Co. XRL) • Landrum 2305 1-30 31H (Garfield Co. XRL) 70K NET ACRES IN NW STACK
  • 9.
    8 Industry Meramec Results Meramecinitial production has averaged 700-800 Boepd and ~60% oil on wells surrounding SD’s NW STACK acreage position
  • 10.
    9 Industry Osage Results Osageinitial production has averaged 700-800 Boepd and ~40% oil on wells surrounding SD’s NW STACK acreage position
  • 11.
    10 • Ten wellsdrilled in 2016 including one XRL and one “C” bench producer with production outperforming type curve • Targeting sub-$3.5MM per lateral in 2017 with projected 600 MBoe total EUR • Drill Niobrara “B”, “C” & “D” bench XRLs • Drill an XRL to hold 24k net acre Rabbit Ears Federal Unit • Process and interpret new 3D seismic survey; acquire a full core across the Niobrara North Park Niobrara Asset Overview Drilling in 2017 focuses on XRLs, multiple benches and establishes new federal unit • 1,300 2P Locations • 127k Net acres 2017 activity will help optimize full development planning
  • 12.
    11 Targeting Multiple NiobraraBenches Similar geologic characteristics to the DJ Basin Niobrara but higher oil cut NORTH PARK BASIN DJ BASIN Oil EUR % >80% ~35% Depth 5,500 – 9,000 ft. 6,000 – 8,000 ft. Reservoir Storage Capacity Gross Thickness Porosity 450 – 480 ft. 6 – 9% 150 – 300 ft. 6 – 10% OOIP per Section 63.8 MMBo 41.3 MMBo Thermal Maturity (Ro) 0.75 – 1.0% 0.5 – 1.4+% Reservoir Production Potential Reservoir Pressure Gas-oil Ratio (GOR) Total Organic Content > 0.55 psi/ft 600 – 700 scf/stb 3% 0.41 - 0.60 psi/ft Up to 10,000+ scf/stb 3%
  • 13.
    12 2016 Niobrara ProgramSuccess 11 laterals drilled in 2016, outperforming type curve Lowered costs, optimized completions, drilled first XRL and “C” bench wells First XRL in the basin • 2-mile lateral (Castle 1-17H 20) drilled and completed completed for $3.4MM per lateral with a 30-Day IP of of 901 Boepd (91% oil) First “C” bench well • Niobrara “C” bench test (Hebron 4-18H) resulted in second highest per lateral 30-Day IP of 539 Boepd (92% (92% oil) Advanced drilling and completion designs • Reduced cycle times, confirmed preference for cross- cross-linked gel (vs slickwater) fracs 2016 DRILLING RESULTS Note: 30-Day IP rates shown above
  • 14.
    13 First SandRidge NiobraraC Bench Lateral Hebron 4-18H cumulative oil production exceeds type curve by 32% 539 Boepd (92% oil) 30-Day IP DAILY OIL RATE CUMULATIVE OIL Jet Pump Installed
  • 15.
    14 901 Boepd (91%oil) 30-Day IP First SandRidge Niobrara XRL Castle 1-17H exceeding type curve, drilled and completed for $3.4MM per lateral DAILY OIL RATE CUMULATIVE OIL Jet Pump Installed Jet Pump Installed
  • 16.
    15 Current year programto feature XRLs with crosslinked completions 2016 DRILLING PROGRAM 2016 Niobrara Oil Production Above Type Curve 2016 CROSSLINKED COMPLETIONS ONLY
  • 17.
    RABBIT EARS UNIT 24k NetAcres SURPRISE UNIT 22k Net Acres PETERSON RIDGE UNIT 22k Net Acres BEAVER CREEK UNIT 11k Net Acres (Proposed) 16 • Peterson Ridge Unit: 22k net acres • Surprise Unit: 22k net acres • Rabbit Ears Unit: 24k net acres – Planned XRL to be drilled in Rabbit Ears Unit will hold the 24k net acres • (Proposed) Beaver Creek Unit: 11k net acres Large Contiguous North Park Acreage Position 2017 drilling increases acreage held by production or by unit to ~75% of existing 127k net acre position 71k net acres currently held by production or unit (56% of 127k net acre position). Three existing and one proposed Federal Unit:
  • 18.
    17 North Park BasinOil and Gas Takeaway Favorable oil marketing and gas processing will create additional revenue Current Marketing andTakeaway Short term in-field gas processing may include:  Mechanical Refrigeration Units (MRU) for NGL extraction  Gas-to-liquids (GTL)  Gas injection  Potential to generate additional revenue, reduce emissions and augment longer term pipeline plans  Oil trucked to market (up to 40 MBopd)  Low ~$3.15 oil differential to WTI through 2018  Gas combusted under appropriate permits  Building out field gathering infrastructure; centralized tank battery used for processing, storage and export
  • 19.
  • 20.
    19 2017 Project EURs,Economics, & Inventory EURs & ECONOMICS MERAMEC NIOBRARA MISSISSIPPIAN XRL* SINGLE XRL FSD* SINGLE EUR, MBoe % Oil 800 – 1,000 40%+ 500 – 600 40%+ 600 80%+ 1,350 20% 550 20% D&C per lateral ($MM) $3.1 $4.2 $3.4 $2.0 $2.4 IRR(a) 20 - 35% 15 - 25% 27% 52% 14% PV-10(a) ($MM) $1.8 - $3.9 $0.6 - $1.6 $2.9 $4.7 $0.4 YE’16 INVENTORY NW STACK NIOBRARA MISSISSIPPIAN PUDs (laterals) 6 106 51(b) Probables (laterals) Under evaluation (4-8 per section) ~1,180 ~180(b) Net acres 70k 127k 400k HBP or HBU 33% 56% 78% a) @ Apr 26th Strip avg pricing (~$50 /~$3.00) at 100% Working Interest b) Excluding ~70 Proven + Probable Chester locations Diverse and material location inventory in three areas *FSD = “Full Section Development”, equivalent to 3 laterals *XRL = “Extended Reach Lateral”, 2-mile lateral
  • 21.
    Year End 2016Reserves and PV-10 20 PROVED RESERVES OIL MBBLS NGLS MBBLS GAS MMCF EQUIVALENT MBOE1 PV-102 $MM Proved Reserves as of Dec 31, 2015 @ SEC Pricing ($50.28 / $2.59) 77,911 61,075 1,113,840 324,626 $1,315_ Production (5,529) (4,357) (56,895) (19,369) Sale of assets (387) 0 (145,267) (24,598) Change in accounting for trusts (6,971) (3,695) (50,508) (19,084) Performance revisions (14,796) (21,717) (349,244) (94,720) Pricing revisions (1,510) 876 (68,865) (12,112) Extensions & additions 4,166 1,425 21,720 9,210 Proved Reserves as of Dec 31, 2016 @ SEC Pricing ($42.75 / $2.48) 52,884 33,607 464,782 163,955 $438_ Proved Reserves as of Dec 31, 2016 @ NYMEX Pricing (~$50 / ~$3) 55,686 37,687 521,173 180,235 $763_ (1) Equivalent Boe are calculated using an energy equivalent ratio of six Mcf of natural gas to one Bbl of crude oil. Using an energy-equivalent ratio does not factor in price differences and energy-equivalent prices may differ significantly among produced products. (2) PV-10 is a non-GAAP financial measure and generally differs from Standardized Measure, the most directly comparable GAAP financial measure, because it does not include the effect of income taxes on discounted future net cash flows. www.sandridgeenergy.com
  • 22.
    Four Quarters ofTrailing Actuals 21 ACTUALS PRODUCTION Q2’16 Q3’16 Q4’16 Q1’17 Oil (MMBbls) 1.4 1.3 1.2 1.1 Natural Gas Liquids (MMBbls) 1.1 1.1 1.0 0.9 Total Liquids (MMBbls) 2.5 2.4 2.2 2.0 Natural Gas (Bcf) 14.5 13.1 12.8 11.8 Total (MMBoe) 5.0 4.6 4.3 4.0 Daily Oil Equivalent (MBoepd) 54.7 49.6 47.2 44.2 PRICING REALIZATIONS Oil (differential below WTI) $3.86 $2.11 $2.28 $2.71 NGLs (realized % of WTI) 29% 31% 30% 32% Gas (differential below Henry Hub)1 $0.47 $0.54 $0.93 $0.96 COSTS PER BOE LOE1 $8.58 $8.68 $5.76 $6.28 Adj. G&A – Cash2 $2.88 $3.88 $3.08 $3.43 % OF NET REVENUE Severance Taxes 2.2% 2.3% 2.7% 3.2% (1) Q4’16 marks beginning of accounting policy change to book gas transportation fee as a net from revenue, rather than a lease operating expense (2) Adjusted G&A - Cash is a non-GAAP financial measure as it excludes from G&A non-cash compensation, severance, bad debt allowance, and other non-recurring items. The most directly comparable GAAP measure for Adjusted G&A - cash is General and Administrative Expense. Information to reconcile this non-GAAP financial measure to the most directly comparable GAAP financial measure is not available at this time, as management is unable to forecast the excluded items for future periods. www.sandridgeenergy.com
  • 23.
    2017 Capital ExpendituresGuidance 22 CAPEX GUIDANCE DETAIL $MM Mid-Continent D&C $65 - $70 North Park D&C 20 - 25 Other - D&C1 24 Total Drilling & Completion $109 - $119 OTHER E&P Land, G&G and Seismic $40 Infrastructure2 7 Workovers 37 Capitalized G&A and Interest 15 Total Other E&P $99 NON E&P General Corporate 2 Total Capital Expenditures _(excl. A&D and P&A) $210 - $220 CAPEX GUIDANCE $MM D&C $109 - $119 Other E&P 99 Total Exploration and Production $208 - $218 General Corporate 2 Total Capital Expenditures $210 - $220 LATERAL SPUDS GROSS NET Mid-Continent 22 17 North Park 6 6 Total Laterals 28 23 (1) 2016 Carryover, Coring, and Non-Op (2) Facilities - Electrical, SWD, Gathering, Pipeline ROW www.sandridgeenergy.com
  • 24.
    2017 Operational Guidance 23 TOTALCOMPANY PRODUCTION Oil (MMBbls) 4.0 – 4.2 Natural Gas Liquids (MMBbls) 3.0 – 3.2 Total Liquids (MMBbls) 7.0 – 7.4 Natural Gas (Bcf) 42.0 – 43.5 Total (MMBoe) 14.0 - 14.7 PRICING REALIZATIONS Oil (differential below WTI) $2.75 NGLs (realized % of WTI) 26% Gas (differential below Henry Hub) $1.00 COSTS PER BOE LOE $8.00 - $9.00 Adj. G&A – Cash1 $4.25 - $4.50 % OF NET REVENUE Severance Taxes 2.75% - 3.00% (1) Adjusted G&A - Cash is a non-GAAP financial measure as it excludes from G&A non-cash compensation, severance, bad debt allowance, and other non-recurring items. The most directly comparable GAAP measure for Adjusted G&A - cash is General and Administrative Expense. Information to reconcile this non-GAAP financial measure to the most directly comparable GAAP financial measure is not available at this time, as management is unable to forecast the excluded items for future periods. www.sandridgeenergy.com
  • 25.
    24 Hedging Overview 80% ofoil and 77% of gas volumes hedged at the midpoint of guidance in 2017 OIL Q1’17 Q2’17 Q3’17 Q4’17 FY 2017 Q1’18 Q2’18 Q3’18 Q4’18 FY 2018 SWAPS Volumes (MMBbls) 0.81 0.82 0.83 0.83 3.29 0.45 0.46 0.46 0.46 1.83 Price ($/Bbl) $52.24 $52.24 $52.24 $52.24 $52.24 $55.34 $55.34 $55.34 $55.34 $55.34 NATURAL GAS Q1’17 Q2’17 Q3’17 Q4’17 FY 2017 Q1’18 Q2’18 Q3’18 Q4’18 FY 2018 SWAPS Volumes (Bcf) 8.10 8.19 8.28 8.28 32.85 4.50 2.73 2.76 2.76 12.75 Price ($/MMBtu) $3.20 $3.20 $3.20 $3.20 $3.20 $3.25 $3.11 $3.11 $3.11 $3.16 Note: As of 5.10.17
  • 26.
    Reconciliation of StandardizedMeasure of Discounted Net Cash Flows to PV-10 25 www.sandridgeenergy.com The PV-10 of strip-based proved reserves is a non-GAAP financial measure and differs from standardized measure because it reflects the estimated proved reserves economically recoverable based on forward NYMEX strip prices rather than SEC pricing and does not include the effects of income taxes on future net revenues. PROVED RESERVES SUCCESSOR DEC 31, 2016 PREDECESSOR DEC 31, 2015 ((in millions) Standardized measure of discounted net cash flows1 $ 438 $ 1,314 Present value of future net income tax expense discounted at 10% - 1 PV-102 $ 438 $ 1,315 Effects of calculating reserves and pricing using strip pricing 325 PV-10 of strip-based proved reserves $ 763 (1) Includes approximately $225 million attributable to SandRidge noncontrolling interests at December 31, 2015. (2) Includes approximately $226 million attributable to SandRidge noncontrolling interests at December 31, 2015.