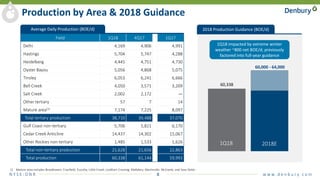
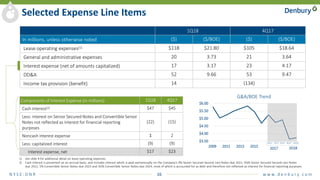
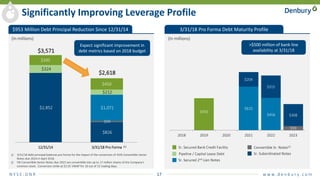
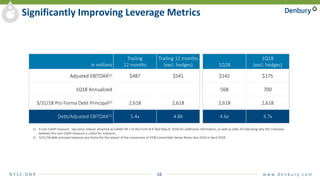
SlideShare a Scribd company logo
1 of 20
w w w. d e n b u r y. c o mN Y S E : D N R
1Q18 Earnings Presentation
May 8, 2018
N Y S E : D N R 2 w w w. d e n b u r y. c o m
Agenda
● Introduction
— John Mayer, Director of Investor Relations
● Overview and Operational Update
— Chris Kendall, President & Chief Executive Officer
● Financial Review
— Mark Allen, Executive Vice President & Chief Financial Officer
N Y S E : D N R 3 w w w. d e n b u r y. c o m
Cautionary Statements
Forward-Looking Statements: The data and/or statements contained in this presentation that are not historical facts are forward-looking statements, as that term is defined in Section 21E of the Securities Exchange Act of 1934, as amended,
that involve a number of risks and uncertainties. Such forward-looking statements may be or may concern, among other things, financial forecasts, future hydrocarbon prices and timing, the degree and length of any price recovery for oil,
current or future liquidity sources or their adequacy to support our anticipated future activities, our ability to further reduce our debt levels, possible future write-downs of oil and natural gas reserves, together with assumptions based on
current and projected oil and gas prices and oilfield costs, current or future expectations or estimations of our cash flows or the impact of changes in commodity prices on cash flows, availability of capital, borrowing capacity, availability of
advantageous commodity derivative contracts or the predicted cash flow benefits therefrom, forecasted capital expenditures, drilling activity or methods, including the timing and location thereof, the nature of any future asset sales or the
timing or proceeds thereof, estimated timing of commencement of carbon dioxide (CO2) flooding of particular fields or areas, timing of CO2 injections and initial production responses in tertiary flooding projects, development activities,
finding costs, anticipated future cost savings, capital budgets, interpretation or prediction of formation details, production rates and volumes or forecasts thereof, hydrocarbon reserve quantities and values, CO2 reserves and supply and their
availability, potential reserves, barrels or percentages of recoverable original oil in place, potential increases in worldwide tariffs or other trade restrictions, the likelihood, timing and impact of increased interest rates, the impact of regulatory
rulings or changes, anticipated outcomes of pending litigation, prospective legislation affecting the oil and gas industry, environmental regulations, mark-to-market values, competition, long-term forecasts of production, rates of return,
estimated costs, changes in costs, future capital expenditures and overall economics, worldwide economic conditions and other variables surrounding our estimated original oil in place, operations and future plans. Such forward-looking
statements generally are accompanied by words such as “plan,” “estimate,” “expect,” “predict,” “forecast,” “to our knowledge,” “anticipate,” “projected,” “preliminary,” “should,” “assume,” “believe,” “may” or other words that convey, or
are intended to convey, the uncertainty of future events or outcomes. Such forward-looking information is based upon management’s current plans, expectations, estimates, and assumptions and is subject to a number of risks and
uncertainties that could significantly and adversely affect current plans, anticipated actions, the timing of such actions and our financial condition and results of operations. As a consequence, actual results may differ materially from
expectations, estimates or assumptions expressed in or implied by any forward-looking statements made by us or on our behalf. Among the factors that could cause actual results to differ materially are fluctuations in worldwide oil prices or
in U.S. oil prices and consequently in the prices received or demand for our oil and natural gas; decisions as to production levels and/or pricing by OPEC or production levels by U.S. shale producers in future periods; levels of future capital
expenditures; effects of our indebtedness; success of our risk management techniques; accuracy of our cost estimates; availability or terms of credit in the commercial banking or other debt markets; fluctuations in the prices of goods and
services; the uncertainty of drilling results and reserve estimates; operating hazards and remediation costs; disruption of operations and damages from well incidents, hurricanes, tropical storms, forest fires, or other natural occurrences;
acquisition risks; requirements for capital or its availability; conditions in the worldwide financial, trade and credit markets; general economic conditions; competition; government regulations, including changes in tax or environmental laws
or regulations; and unexpected delays, as well as the risks and uncertainties inherent in oil and gas drilling and production activities or that are otherwise discussed in this presentation, including, without limitation, the portions referenced
above, and the uncertainties set forth from time to time in our other public reports, filings and public statements including, without limitation, the Company’s most recent Form 10-K.
Statement Regarding Non-GAAP Financial Measures: This presentation also contains certain non-GAAP financial measures. Any non-GAAP measure included herein is accompanied by a reconciliation to the most directly comparable U.S.
GAAP measure along with a statement on why the Company believes the measure is beneficial to investors, which statements are included at the end of this presentation.
Note to U.S. Investors: Current SEC rules regarding oil and gas reserves information allow oil and gas companies to disclose in filings with the SEC not only proved reserves, but also probable and possible reserves that meet the SEC’s
definitions of such terms. We disclose only proved reserves in our filings with the SEC. Denbury’s proved reserves as of December 31, 2016 and December 31, 2017 were estimated by DeGolyer and MacNaughton, an independent petroleum
engineering firm. In this presentation, we may make reference to probable and possible reserves, some of which have been estimated by our independent engineers and some of which have been estimated by Denbury’s internal staff of
engineers. In this presentation, we also may refer to estimates of original oil in place, resource or reserves “potential,” barrels recoverable, “risked” and “unrisked” resource potential, estimated ultimate recovery (EUR) or other descriptions
of volumes potentially recoverable, which in addition to reserves generally classifiable as probable and possible (2P and 3P reserves), include estimates of resources that do not rise to the standards for possible reserves, and which SEC
guidelines strictly prohibit us from including in filings with the SEC. These estimates, as well as the estimates of probable and possible reserves, are by their nature more speculative than estimates of proved reserves and are subject to greater
uncertainties, and accordingly the likelihood of recovering those reserves is subject to substantially greater risk.
N Y S E : D N R 4 w w w. d e n b u r y. c o m
Overview & Operational Update
Chris Kendall
N Y S E : D N R 5 w w w. d e n b u r y. c o m
Mission Canyon Exploitation
Building on Initial Mission Canyon Success
1) EUR resource potential represents total recoverable reserves estimated by the Company based upon a variety of recovery factors and long-term oil price assumptions, which in addition to probable and possible reserves
also may include estimates of resources that do not rise to the standards of possible reserves. See slide 3 “Cautionary Statements” for additional information.
• Two new horizontal wells drilled and completed in March/April 2018 in Pennel, north of
1st well
• MC 22-19NH – 4,600’ lateral; MC 22-19SH – 2,400’ lateral
• Performance from both new wells exceeded expectations, current combined gross
production from all 3 MC wells is 2,500 - 3,000 BOPD
• Increased EUR from initial 400 MBbl/well(1) to over 500 MBbl/well(1); 100% oil
• Will continue to refine EUR as development matures
• Increased MC resource potential to 9.4 MMBOE(1) based on recent results
• Low drill and complete costs averaging $3.5MM/well
• High quality reservoir does not require hydraulic fracture stimulation
• 5 additional wells planned for 2018
• 3 wells in Coral Creek, including 1 downdip delineation well
• 2 wells to test Little Beaver/Little Beaver East prospects
• Initial target of ~24 additional locations across CCA, potential to increase
• Upside CO2 EOR potential after primary production
N Y S E : D N R 6 w w w. d e n b u r y. c o m
Tinsley Perry Sand
Overview
• Proven light tight oil accumulation with low historical
vertical well recovery; plan to develop with horizontal
wells
• Up to 6,000 prospective acres in North and West
Fault Blocks
• Drilled first well in April with positive initial
indications, completion in progress
• Up to 18 potential horizontal locations identified
• Drill and complete cost estimated at $3 – $4 million
per well
• Upside CO2 EOR potential after primary production
West Fault
Block
North Fault
Block
East Fault
Block
Recovery Factor
Well 1 April 18)
Mississippi
N Y S E : D N R 7 w w w. d e n b u r y. c o m
1H18 2H18
Development
Oyster Bayou Facility Expansion
Bell Creek Phase 5 Response
West Yellow Creek Response
CCA EOR Investment Decision
Grieve Field Startup
Delhi Tuscaloosa Infill
Exploitation
Cedar Creek Anticline (Mission Canyon)
Tinsley (Perry)
Tinsley (Cotton Valley)
Hartzog Draw Deep
Financial
Houston Surface Acreage Sales
Extend Bank Line & Maintain Liquidity
2018 Watch List
Safety & Environment Value Culture Project Delivery Capital Discipline Reservoir Management
A Foundation of Strong Execution
✔
✔
✔
✔
✔
N Y S E : D N R 8 w w w. d e n b u r y. c o m
Production by Area & 2018 Guidance
Field 1Q18 4Q17 1Q17
Delhi 4,169 4,906 4,991
Hastings 5,704 5,747 4,288
Heidelberg 4,445 4,751 4,730
Oyster Bayou 5,056 4,868 5,075
Tinsley 6,053 6,241 6,666
Bell Creek 4,050 3,571 3,209
Salt Creek 2,002 2,172 —
Other tertiary 57 7 14
Mature area(1) 7,174 7,225 8,097
Total tertiary production 38,710 39,488 37,070
Gulf Coast non-tertiary 5,706 5,821 6,170
Cedar Creek Anticline 14,437 14,302 15,067
Other Rockies non-tertiary 1,485 1,533 1,626
Total non-tertiary production 21,628 21,656 22,863
Total production 60,338 61,144 59,993
1) Mature area includes Brookhaven, Cranfield, Eucutta, Little Creek, Lockhart Crossing, Mallalieu, Martinville, McComb, and Soso fields.
Average Daily Production (BOE/d)
(2)
FY2016 2017 2018
2017 2018
60,000 - 64,000
1Q18 impacted by extreme winter
weather ~800 net BOE/d; previously
factored into full-year guidance
2018 Production Guidance (BOE/d)
1Q18 2018E
60,338
N Y S E : D N R 9 w w w. d e n b u r y. c o m
Analysis of Total Operating Costs
$ per BOE 1Q18 4Q17 1Q17
($MM) ($/BOE) ($MM) ($/BOE) ($MM) ($/BOE)
CO2 Costs $17 $3.16 $17 $3.02 $16 $2.86
Power & Fuel 38 6.95 32 5.72 32 5.93
Labor & Overhead 36 6.64 35 6.24 34 6.34
Repairs & Maintenance 4 0.84 5 0.84 5 0.95
Chemicals 6 1.03 5 0.95 6 1.15
Workovers 15 2.85 12 2.20 14 2.65
Other 2 0.33 6 0.88 7 1.23
Total Normalized LOE(1) $118 $21.80 $112 $19.85 $114 $21.11
Special or Unusual Items(2) — — (7) (1.21) — —
Total LOE $118 $21.80 $105 $18.64 $114 $21.11
1) Normalized LOE excludes special or unusual items (see footnote 2 below).
2) Special or unusual items consist of a $7MM adjustment for pricing related to one of our industrial CO2 sources in 4Q17.
Total Operating Costs
N Y S E : D N R 10 w w w. d e n b u r y. c o m
Operating Margin Improvement
1Q17 1Q18
Revenue per BOE(1) $49.35 $62.61
Lifting Cost per BOE $21.11 $21.80
Marketing, Transportation and Taxes per BOE $5.73 $6.36
Operating Margin per BOE(2) $22.51 $34.45
1) Revenues exclude gain/loss on derivative settlements.
2) Operating margin calculated as revenues less lifting cost, marketing, transportation and taxes.
90% of oil price change contributed to higher Operating Margin
$21.11 $21.80
$5.73 $6.36
$22.51 $34.45 Operating Margin per BOE
Marketing, Transportation and Taxes
Lifting Cost per BOE
(2)
Revenue per BOE(1)
$49.35
Revenue per BOE(1)
$62.61
N Y S E : D N R 11 w w w. d e n b u r y. c o m
Financial Review
Mark Allen
N Y S E : D N R 12 w w w. d e n b u r y. c o m
1Q18 4Q17
In millions, except per-share data Amount
Per Diluted
Share
Amount
Per Diluted
Share
Net income (GAAP measure) $40 $0.09 $127 $0.31
Adjustments to reconcile to adjusted net income (non-GAAP measure)
Noncash fair value losses on commodity derivatives 15 0.03 78 0.19
Transaction costs and other 2 — 3 0.01
Estimated income taxes on above adjustments to net
income and other discrete tax items (3) — (160) (0.39)
Adjusted net income (non-GAAP measure)(1) $54 $0.12 $48 $0.12
Weighted-average shares outstanding
Basic 392.7 392.4
Diluted 451.5 405.8
1) See press release attached as exhibit 99.1 to the Form 8-K filed May 8, 2018 for additional information, indicating why the Company believes this non-GAAP measure is useful for investors.
Reconciliation of Adjusted Net Income
Reconciliation of Net Income (GAAP Measure) to
Adjusted Net Income (Non-GAAP Measure)(1)
N Y S E : D N R 13 w w w. d e n b u r y. c o m
1) A non-GAAP measure. See press release attached as exhibit 99.1 to the Form 8-K filed May 8, 2018 for additional information indicating why the Company believes this non-GAAP measure is useful for investors.
1Q18 Selected Financial Highlights
In millions 1Q18 4Q17
Reconciliation of Cash Flow from Operations (GAAP Measure) to Adjusted Cash Flow from Operations (Non-GAAP Measure)(1)
Cash flows from operations (GAAP measure) $92 $124
Net change in assets and liabilities relating to operations 33 10
Adjusted cash flows from operations (non-GAAP measure)(1) $125 $134
Interest payments treated as debt reduction (22) (15)
Adjusted cash flows from operations less interest treated as debt reduction (non-GAAP measure)(1) $103 $119
Revenues and Commodity Derivative Settlements
Revenues $348 $321
Payment on settlements of commodity derivatives (33) (9)
Revenues and commodity derivative settlements combined $315 $312
Realized Oil Prices
Average realized oil price per barrel (excluding derivative settlements) $64.25 $57.17
Average realized oil price per barrel (including derivative settlements) $57.89 $55.49
N Y S E : D N R 14 w w w. d e n b u r y. c o m
NYMEX Oil Differential Summary
During 1Q18, ~65% of our crude oil was based on, or partially tied to, the LLS index price
$ per barrel 1Q17 2Q17 3Q17 4Q17 1Q18
Tertiary oil fields $(1.60) $(1.07) $(0.21) $2.27 $1.61
Gulf Coast region (1.58) (1.01) (0.10) 2.84 1.87
Rocky Mountain region (1.74) (1.75) (0.83) (1.09) 0.22
Cedar Creek Anticline (2.08) (1.93) (0.96) (0.57) (0.11)
Denbury totals $(1.64) $(1.16) $(0.34) $1.70 $1.29
NYMEX Oil Differentials
1Q18 was the strongest Rocky Mountain
differential the Company has ever realized
N Y S E : D N R 15 w w w. d e n b u r y. c o m
Hedge Positions – as of May 7, 2018
2018 2019
Detail as of May 7, 2018 1H 2H 1H 2H
FixedPriceSwaps
WTI
NYMEX
Volumes Hedged (Bbls/d) 15,500 15,500 ─ ─
Swap Price(1)
$50.13 $50.13 ─ ─
Volumes Hedged (Bbls/d) 5,000 5,000 3,500 ─
Swap Price(1)
$56.54 $56.54 $59.05 ─
Argus
LLS
Volumes Hedged (Bbls/d) 5,000 5,000 ─ ─
Swap Price(1)
$60.18 $60.18 ─ ─
3-WayCollars
WTI
NYMEX
Volumes Hedged (Bbls/d) 15,000 15,000 8,500 12,000
Sold Put Price/Floor Price/Ceiling Price(1)(2)
$36.50/$46.50/$53.88 $36.50/$46.50/$53.88 $47/$55/$66.71 $47/$55/$66.23
Volumes Hedged (Bbls/d) ─ ─ 3,000 3,000
Sold Put Price/Floor Price/Ceiling Price(1)(2)
─ ─ $50/$58/$70.41 $50/$58/$70.41
Total Volumes Hedged 40,500 40,500 15,000 15,000
BasisSwaps
Argus
LLS
Volumes Hedged (Bbls/d) 20,000 ─ ─ ─
Swap Price(1)(3)
$4.17 ─ ─ ─
Total Volumes Hedged 20,000 ─ ─ ─
1) Averages are volume weighted.
2) If oil prices were to average less than the sold put price, receipts on settlement would be limited to the difference between the floor price and sold put price.
3) The basis swap contracts establish a fixed amount for the differential between Argus WTI and Argus LLS on a trade-month basis for the periods indicated.
N Y S E : D N R 16 w w w. d e n b u r y. c o m
1Q18 4Q17
In millions, unless otherwise noted ($) ($/BOE) ($) ($/BOE)
Lease operating expenses(1) $118 $21.80 $105 $18.64
General and administrative expenses 20 3.73 21 3.64
Interest expense (net of amounts capitalized) 17 3.17 23 4.17
DD&A 52 9.66 53 9.47
Income tax provision (benefit) 14 (134)
1) See slide 9 for additional detail on lease operating expenses.
2) Cash interest is presented on an accrual basis, and includes interest which is paid semiannually on the Company's 9% Senior Secured Second Lien Notes due 2021, 9¼% Senior Secured Second Lien Notes
due 2022, 5% Convertible Senior Notes due 2023 and 3½% Convertible Senior Notes due 2024, most of which is accounted for as debt and therefore not reflected as interest for financial reporting purposes.
Components of Interest Expense (in millions) 1Q18 4Q17
Cash interest(2) $47 $45
Less: interest on Senior Secured Notes and Convertible Senior
Notes not reflected as interest for financial reporting
purposes
(22) (15)
Noncash interest expense 1 2
Less: capitalized interest (9) (9)
Interest expense, net $17 $23
Selected Expense Line Items
$3.50
$4.00
$4.50
$5.00
$5.50
$6.00
2009 2011 2013 2015 1Q17 3Q17 1Q18
G&A/BOE Trend
1Q17 2Q17 3Q17 4Q17
2017
1Q18
2018
N Y S E : D N R 17 w w w. d e n b u r y. c o m
$953 Million Debt Principal Reduction Since 12/31/14
$2,852
$826
$59
$1,071
$324
$212
$395
$450
12/31/14 3/31/18 Pro Forma
Significantly Improving Leverage Profile
$3,571
$2,618
(In millions)
$450
$615
$204
$456
$315
$59
$308
2018 2019 2020 2021 2022 2023
Convertible Sr. Notes(2)
Sr. Subordinated Notes
Sr. Secured Bank Credit Facility
Pipeline / Capital Lease Debt
Sr. Secured 2nd Lien Notes
3/31/18 Pro Forma Debt Maturity Profile
(In millions)
1) 3/31/18 debt principal balances pro forma for the impact of the conversion of 3½% Convertible Senior
Notes due 2024 in April 2018.
2) 5% Convertible Senior Notes due 2023 are convertible into up to 17 million shares of the Company’s
common stock. Conversion strike at $3.55 VWAP for 10 out of 15 trading days.
(1)
Expect significant improvement in
debt metrics based on 2018 budget
>$500 million of bank line
availability at 3/31/18
N Y S E : D N R 18 w w w. d e n b u r y. c o m
Significantly Improving Leverage Metrics
in millions
Trailing
12 months
Trailing 12 months
(excl. hedges) 1Q18
1Q18
(excl. hedges)
Adjusted EBITDAX(1) $487 $541 $142 $175
1Q18 Annualized 568 700
3/31/18 Pro Forma Debt Principal(2) 2,618 2,618 2,618 2,618
Debt/Adjusted EBITDAX(1) 5.4x 4.8X 4.6x 3.7x
1) A non-GAAP measure. See press release attached as Exhibit 99.1 to the Form 8-K filed May 8, 2018 for additional information, as well as slide 20 indicating why the Company
believes this non-GAAP measure is useful for investors.
2) 3/31/18 debt principal balances pro forma for the impact of the conversion of 3½% Convertible Senior Notes due 2024 in April 2018.
N Y S E : D N R 19 w w w. d e n b u r y. c o m
Q&A
N Y S E : D N R 20 w w w. d e n b u r y. c o m
Reconciliation of net income (GAAP measure) to adjusted EBITDAX (non-GAAP measure)
1) Excludes pro forma adjustments related to qualified acquisitions or dispositions under the Company’s senior secured bank credit facility.
Adjusted EBITDAX is a non-GAAP financial measure which is calculated based upon (but not identical to) a financial covenant related to “Consolidated EBITDAX” in the Company’s
senior secured bank credit facility, which excludes certain items that are included in net income, the most directly comparable GAAP financial measure. Items excluded include
interest, income taxes, depreciation, depletion and amortization, impairments, and items that the Company believes affect the comparability of operating results such as items
whose timing and/or amount cannot be reasonably estimated or are non-recurring. Management believes Adjusted EBITDAX may be helpful to investors in order to assess the
Company’s operating performance as compared to that of other companies in its industry, without regard to financing methods, capital structure or historical costs basis. It is also
commonly used by third parties to assess leverage, and the Company’s ability to incur and service debt and fund capital expenditures. Adjusted EBITDAX should not be considered
in isolation, as a substitute for, or more meaningful than, net income, cash flow from operations, or any other measure reported in accordance with GAAP. Adjusted EBITDAX may
not be comparable to similarly titled measures of another company because all companies may not calculate Adjusted EBITDAX, EBITDAX or EBITDA in the same manner.
2017 2018
In millions Q1 Q2 Q3 Q4 FY Q1 TTM
Net income (GAAP measure) $22 $14 $0 $127 $163 $40 $181
Adjustments to reconcile to Adjusted EBITDAX
Interest expense 27 24 25 23 99 17 89
Income tax expense (benefit) 21 10 (14) (134) (117) 14 (124)
Depletion, depreciation and amortization 51 51 52 53 207 52 208
Noncash fair value adjustments on commodity derivatives (52) (22) 25 78 29 15 96
Stock-based compensation 4 5 3 3 15 3 14
Noncash, non-recurring and other(1)
3 4 11 7 25 1 23
Adjusted EBITDAX (non-GAAP measure) $76 $86 $102 $157 $421 $142 $487
Non-GAAP Measures

More Related Content

What's hot

Jp morgan 2017 global high yield leveraged finance conference final
Jp morgan 2017 global high yield leveraged finance conference finalJp morgan 2017 global high yield leveraged finance conference final
Jp morgan 2017 global high yield leveraged finance conference finalDenbury
 
Denbury - Barclays presentation 9.6.16
Denbury - Barclays presentation 9.6.16Denbury - Barclays presentation 9.6.16
Denbury - Barclays presentation 9.6.16Denbury
 
2017 credit suisse final
2017 credit suisse final2017 credit suisse final
2017 credit suisse finalDenbury
 
Sd november-2016-ir-presentation
Sd november-2016-ir-presentationSd november-2016-ir-presentation
Sd november-2016-ir-presentationSandRidgeIR
 
2018 credit suisse presentation final
2018 credit suisse presentation final2018 credit suisse presentation final
2018 credit suisse presentation finalDenbury
 
EnerCom’s The Oil and Gas Conference 21 Presentation
EnerCom’s The Oil and Gas Conference 21 PresentationEnerCom’s The Oil and Gas Conference 21 Presentation
EnerCom’s The Oil and Gas Conference 21 PresentationApproachResources
 
AREX 2Q 2016 Earnings Results Presentation
AREX 2Q 2016 Earnings Results PresentationAREX 2Q 2016 Earnings Results Presentation
AREX 2Q 2016 Earnings Results PresentationApproachResources
 
Denbury 3 q17-earnings
Denbury 3 q17-earningsDenbury 3 q17-earnings
Denbury 3 q17-earningsDenbury
 
Enercom presentation final
Enercom presentation finalEnercom presentation final
Enercom presentation finalDenbury
 
Denbury 3rd Quarter 2016 Earnings Presentation
Denbury 3rd Quarter 2016 Earnings PresentationDenbury 3rd Quarter 2016 Earnings Presentation
Denbury 3rd Quarter 2016 Earnings PresentationDenbury
 
June investor presentation 6.5.17
June investor presentation 6.5.17June investor presentation 6.5.17
June investor presentation 6.5.17SandRidgeIR
 
4 q16 earnings presentation final
4 q16 earnings presentation   final4 q16 earnings presentation   final
4 q16 earnings presentation finalDenbury
 
AREX 2016 Wells Fargo West Coast Energy Presentation
AREX 2016 Wells Fargo West Coast Energy PresentationAREX 2016 Wells Fargo West Coast Energy Presentation
AREX 2016 Wells Fargo West Coast Energy PresentationApproachResources
 
June 2017 corporate presentation final
June 2017 corporate presentation finalJune 2017 corporate presentation final
June 2017 corporate presentation finalDenbury
 
Company website presentation november 2016
Company website presentation   november 2016Company website presentation   november 2016
Company website presentation november 2016AnteroResources
 
J.p.morgan 2018 energy conference final
J.p.morgan 2018 energy conference finalJ.p.morgan 2018 energy conference final
J.p.morgan 2018 energy conference finalDenbury
 
Mason Graphite Corporate Presentation April 2016
Mason Graphite Corporate Presentation April 2016Mason Graphite Corporate Presentation April 2016
Mason Graphite Corporate Presentation April 2016masongraphite
 
PVA Investor Presentation
PVA Investor Presentation PVA Investor Presentation
PVA Investor Presentation PennVirginiaCorp
 

What's hot (20)

Jp morgan 2017 global high yield leveraged finance conference final
Jp morgan 2017 global high yield leveraged finance conference finalJp morgan 2017 global high yield leveraged finance conference final
Jp morgan 2017 global high yield leveraged finance conference final
 
Denbury - Barclays presentation 9.6.16
Denbury - Barclays presentation 9.6.16Denbury - Barclays presentation 9.6.16
Denbury - Barclays presentation 9.6.16
 
November Investor Presentation
November Investor PresentationNovember Investor Presentation
November Investor Presentation
 
2017 credit suisse final
2017 credit suisse final2017 credit suisse final
2017 credit suisse final
 
Sd november-2016-ir-presentation
Sd november-2016-ir-presentationSd november-2016-ir-presentation
Sd november-2016-ir-presentation
 
2018 credit suisse presentation final
2018 credit suisse presentation final2018 credit suisse presentation final
2018 credit suisse presentation final
 
EnerCom’s The Oil and Gas Conference 21 Presentation
EnerCom’s The Oil and Gas Conference 21 PresentationEnerCom’s The Oil and Gas Conference 21 Presentation
EnerCom’s The Oil and Gas Conference 21 Presentation
 
AREX 2Q 2016 Earnings Results Presentation
AREX 2Q 2016 Earnings Results PresentationAREX 2Q 2016 Earnings Results Presentation
AREX 2Q 2016 Earnings Results Presentation
 
Denbury 3 q17-earnings
Denbury 3 q17-earningsDenbury 3 q17-earnings
Denbury 3 q17-earnings
 
Enercom presentation final
Enercom presentation finalEnercom presentation final
Enercom presentation final
 
Denbury 3rd Quarter 2016 Earnings Presentation
Denbury 3rd Quarter 2016 Earnings PresentationDenbury 3rd Quarter 2016 Earnings Presentation
Denbury 3rd Quarter 2016 Earnings Presentation
 
June investor presentation 6.5.17
June investor presentation 6.5.17June investor presentation 6.5.17
June investor presentation 6.5.17
 
4 q16 earnings presentation final
4 q16 earnings presentation   final4 q16 earnings presentation   final
4 q16 earnings presentation final
 
AREX 2016 Wells Fargo West Coast Energy Presentation
AREX 2016 Wells Fargo West Coast Energy PresentationAREX 2016 Wells Fargo West Coast Energy Presentation
AREX 2016 Wells Fargo West Coast Energy Presentation
 
June 2017 corporate presentation final
June 2017 corporate presentation finalJune 2017 corporate presentation final
June 2017 corporate presentation final
 
Company website presentation november 2016
Company website presentation   november 2016Company website presentation   november 2016
Company website presentation november 2016
 
Eog 0817
Eog 0817Eog 0817
Eog 0817
 
J.p.morgan 2018 energy conference final
J.p.morgan 2018 energy conference finalJ.p.morgan 2018 energy conference final
J.p.morgan 2018 energy conference final
 
Mason Graphite Corporate Presentation April 2016
Mason Graphite Corporate Presentation April 2016Mason Graphite Corporate Presentation April 2016
Mason Graphite Corporate Presentation April 2016
 
PVA Investor Presentation
PVA Investor Presentation PVA Investor Presentation
PVA Investor Presentation
 

Similar to 1 q18 earnings presentation final

2017 february corporate presentation final
2017 february corporate presentation  final2017 february corporate presentation  final
2017 february corporate presentation finalDenbury
 
2017 12 capital one conference final
2017 12 capital one conference final2017 12 capital one conference final
2017 12 capital one conference finalDenbury
 
Ubs conference-5 26-16
Ubs conference-5 26-16Ubs conference-5 26-16
Ubs conference-5 26-16Denbury
 
November 2016 corporate presentation final
November 2016 corporate presentation finalNovember 2016 corporate presentation final
November 2016 corporate presentation finalDenbury
 
Ipaa 2018 oil and gas investment symposium
Ipaa 2018 oil and gas investment symposiumIpaa 2018 oil and gas investment symposium
Ipaa 2018 oil and gas investment symposiumDenbury
 
June corporate presentation final
June corporate presentation finalJune corporate presentation final
June corporate presentation finalDenbury
 
2018 09-06 great panther silver limited corporate presentation
2018 09-06 great panther silver limited corporate presentation2018 09-06 great panther silver limited corporate presentation
2018 09-06 great panther silver limited corporate presentationAlex Heath, CFA
 
2018 08-01 great panther silver limited corporate presentation
2018 08-01 great panther silver limited corporate presentation2018 08-01 great panther silver limited corporate presentation
2018 08-01 great panther silver limited corporate presentationAlex Heath, CFA
 
2018 06-01 great panther silver limited corporate presentation
2018 06-01 great panther silver limited corporate presentation 2018 06-01 great panther silver limited corporate presentation
2018 06-01 great panther silver limited corporate presentation Alex Heath, CFA
 
Progress energy resources corp. cibc new york mini conference no-appendix
Progress energy resources corp. cibc new york mini conference no-appendixProgress energy resources corp. cibc new york mini conference no-appendix
Progress energy resources corp. cibc new york mini conference no-appendixProgressEnergy
 
Rex Energy Latest Company Presentation - Feb 2015
Rex Energy Latest Company Presentation - Feb 2015Rex Energy Latest Company Presentation - Feb 2015
Rex Energy Latest Company Presentation - Feb 2015Marcellus Drilling News
 
Magnum Hunter Resources Investor Presentation Sept 2013
Magnum Hunter Resources Investor Presentation Sept 2013Magnum Hunter Resources Investor Presentation Sept 2013
Magnum Hunter Resources Investor Presentation Sept 2013Marcellus Drilling News
 
August 2016 corporate_presentation_final Eclipse resources
August 2016 corporate_presentation_final Eclipse resourcesAugust 2016 corporate_presentation_final Eclipse resources
August 2016 corporate_presentation_final Eclipse resourcesSteve Wittrig
 
May 2013 Chesapeake Energy Investor Presentation
May 2013 Chesapeake Energy Investor PresentationMay 2013 Chesapeake Energy Investor Presentation
May 2013 Chesapeake Energy Investor PresentationMarcellus Drilling News
 
Royal Helium Ltd. - Corporate Presentation July 2021
Royal Helium Ltd. - Corporate Presentation July 2021Royal Helium Ltd. - Corporate Presentation July 2021
Royal Helium Ltd. - Corporate Presentation July 2021Adnet Communications
 
2018 11-01 great panther corporate presentation - bdr acquisition
2018 11-01 great panther corporate presentation - bdr acquisition2018 11-01 great panther corporate presentation - bdr acquisition
2018 11-01 great panther corporate presentation - bdr acquisitionAlex Heath, CFA
 
Teck’s Fort McMurray Oil Sands Site Visit
Teck’s Fort McMurray Oil Sands Site VisitTeck’s Fort McMurray Oil Sands Site Visit
Teck’s Fort McMurray Oil Sands Site VisitTeckResourcesLtd
 
PVA Howard Weil Presentation
PVA Howard Weil PresentationPVA Howard Weil Presentation
PVA Howard Weil PresentationPennVirginiaCorp
 
PVA Howard Weil Presentation
PVA Howard Weil PresentationPVA Howard Weil Presentation
PVA Howard Weil PresentationPennVirginiaCorp
 

Similar to 1 q18 earnings presentation final (20)

2017 february corporate presentation final
2017 february corporate presentation  final2017 february corporate presentation  final
2017 february corporate presentation final
 
2017 12 capital one conference final
2017 12 capital one conference final2017 12 capital one conference final
2017 12 capital one conference final
 
Ubs conference-5 26-16
Ubs conference-5 26-16Ubs conference-5 26-16
Ubs conference-5 26-16
 
November 2016 corporate presentation final
November 2016 corporate presentation finalNovember 2016 corporate presentation final
November 2016 corporate presentation final
 
Ipaa 2018 oil and gas investment symposium
Ipaa 2018 oil and gas investment symposiumIpaa 2018 oil and gas investment symposium
Ipaa 2018 oil and gas investment symposium
 
June corporate presentation final
June corporate presentation finalJune corporate presentation final
June corporate presentation final
 
2018 09-06 great panther silver limited corporate presentation
2018 09-06 great panther silver limited corporate presentation2018 09-06 great panther silver limited corporate presentation
2018 09-06 great panther silver limited corporate presentation
 
2018 08-01 great panther silver limited corporate presentation
2018 08-01 great panther silver limited corporate presentation2018 08-01 great panther silver limited corporate presentation
2018 08-01 great panther silver limited corporate presentation
 
2018 06-01 great panther silver limited corporate presentation
2018 06-01 great panther silver limited corporate presentation 2018 06-01 great panther silver limited corporate presentation
2018 06-01 great panther silver limited corporate presentation
 
Progress energy resources corp. cibc new york mini conference no-appendix
Progress energy resources corp. cibc new york mini conference no-appendixProgress energy resources corp. cibc new york mini conference no-appendix
Progress energy resources corp. cibc new york mini conference no-appendix
 
Rex Energy Latest Company Presentation - Feb 2015
Rex Energy Latest Company Presentation - Feb 2015Rex Energy Latest Company Presentation - Feb 2015
Rex Energy Latest Company Presentation - Feb 2015
 
Magnum Hunter Resources Investor Presentation Sept 2013
Magnum Hunter Resources Investor Presentation Sept 2013Magnum Hunter Resources Investor Presentation Sept 2013
Magnum Hunter Resources Investor Presentation Sept 2013
 
August 2016 corporate_presentation_final Eclipse resources
August 2016 corporate_presentation_final Eclipse resourcesAugust 2016 corporate_presentation_final Eclipse resources
August 2016 corporate_presentation_final Eclipse resources
 
May 2013 Chesapeake Energy Investor Presentation
May 2013 Chesapeake Energy Investor PresentationMay 2013 Chesapeake Energy Investor Presentation
May 2013 Chesapeake Energy Investor Presentation
 
September 2018 Update
September 2018 UpdateSeptember 2018 Update
September 2018 Update
 
Royal Helium Ltd. - Corporate Presentation July 2021
Royal Helium Ltd. - Corporate Presentation July 2021Royal Helium Ltd. - Corporate Presentation July 2021
Royal Helium Ltd. - Corporate Presentation July 2021
 
2018 11-01 great panther corporate presentation - bdr acquisition
2018 11-01 great panther corporate presentation - bdr acquisition2018 11-01 great panther corporate presentation - bdr acquisition
2018 11-01 great panther corporate presentation - bdr acquisition
 
Teck’s Fort McMurray Oil Sands Site Visit
Teck’s Fort McMurray Oil Sands Site VisitTeck’s Fort McMurray Oil Sands Site Visit
Teck’s Fort McMurray Oil Sands Site Visit
 
PVA Howard Weil Presentation
PVA Howard Weil PresentationPVA Howard Weil Presentation
PVA Howard Weil Presentation
 
PVA Howard Weil Presentation
PVA Howard Weil PresentationPVA Howard Weil Presentation
PVA Howard Weil Presentation
 

More from Denbury

2013 05 ir presentation - new template
2013 05 ir presentation - new template2013 05 ir presentation - new template
2013 05 ir presentation - new templateDenbury
 
2013 05 ir presentation - 1 q13 earnings final-v001_x4807e
2013 05 ir presentation - 1 q13 earnings final-v001_x4807e2013 05 ir presentation - 1 q13 earnings final-v001_x4807e
2013 05 ir presentation - 1 q13 earnings final-v001_x4807eDenbury
 
2013 04 ir presentation
2013 04 ir presentation2013 04 ir presentation
2013 04 ir presentationDenbury
 
2013 04 ir presentation ipaa
2013 04 ir presentation ipaa2013 04 ir presentation ipaa
2013 04 ir presentation ipaaDenbury
 
Fall Analyst Presentation
Fall Analyst PresentationFall Analyst Presentation
Fall Analyst PresentationDenbury
 
Corporate Presentation - October 2012
Corporate Presentation - October 2012Corporate Presentation - October 2012
Corporate Presentation - October 2012Denbury
 
October Corporate Presentation
October Corporate PresentationOctober Corporate Presentation
October Corporate PresentationDenbury
 

More from Denbury (7)

2013 05 ir presentation - new template
2013 05 ir presentation - new template2013 05 ir presentation - new template
2013 05 ir presentation - new template
 
2013 05 ir presentation - 1 q13 earnings final-v001_x4807e
2013 05 ir presentation - 1 q13 earnings final-v001_x4807e2013 05 ir presentation - 1 q13 earnings final-v001_x4807e
2013 05 ir presentation - 1 q13 earnings final-v001_x4807e
 
2013 04 ir presentation
2013 04 ir presentation2013 04 ir presentation
2013 04 ir presentation
 
2013 04 ir presentation ipaa
2013 04 ir presentation ipaa2013 04 ir presentation ipaa
2013 04 ir presentation ipaa
 
Fall Analyst Presentation
Fall Analyst PresentationFall Analyst Presentation
Fall Analyst Presentation
 
Corporate Presentation - October 2012
Corporate Presentation - October 2012Corporate Presentation - October 2012
Corporate Presentation - October 2012
 
October Corporate Presentation
October Corporate PresentationOctober Corporate Presentation
October Corporate Presentation
 

Recently uploaded

如何办理东俄勒冈大学毕业证(文凭)EOU学位证书
如何办理东俄勒冈大学毕业证(文凭)EOU学位证书如何办理东俄勒冈大学毕业证(文凭)EOU学位证书
如何办理东俄勒冈大学毕业证(文凭)EOU学位证书Fir La
 
Nicola Mining Inc. Corporate Presentation April 2024
Nicola Mining Inc. Corporate Presentation April 2024Nicola Mining Inc. Corporate Presentation April 2024
Nicola Mining Inc. Corporate Presentation April 2024nicola_mining
 
如何办理伦敦大学毕业证(文凭)London学位证书
如何办理伦敦大学毕业证(文凭)London学位证书如何办理伦敦大学毕业证(文凭)London学位证书
如何办理伦敦大学毕业证(文凭)London学位证书Fis s
 
WheelTug PLC Pitch Deck | Investor Insights | April 2024
WheelTug PLC Pitch Deck | Investor Insights | April 2024WheelTug PLC Pitch Deck | Investor Insights | April 2024
WheelTug PLC Pitch Deck | Investor Insights | April 2024Hector Del Castillo, CPM, CPMM
 
VIP Kolkata Call Girl Rishra 👉 8250192130 Available With Room
VIP Kolkata Call Girl Rishra 👉 8250192130  Available With RoomVIP Kolkata Call Girl Rishra 👉 8250192130  Available With Room
VIP Kolkata Call Girl Rishra 👉 8250192130 Available With Roomdivyansh0kumar0
 
如何办理密苏里大学堪萨斯分校毕业证(文凭)UMKC学位证书
如何办理密苏里大学堪萨斯分校毕业证(文凭)UMKC学位证书如何办理密苏里大学堪萨斯分校毕业证(文凭)UMKC学位证书
如何办理密苏里大学堪萨斯分校毕业证(文凭)UMKC学位证书Fir La
 
Cyberagent_For New Investors_EN_240424.pdf
Cyberagent_For New Investors_EN_240424.pdfCyberagent_For New Investors_EN_240424.pdf
Cyberagent_For New Investors_EN_240424.pdfCyberAgent, Inc.
 
Sustainability Leadership, April 26 2024
Sustainability Leadership, April 26 2024Sustainability Leadership, April 26 2024
Sustainability Leadership, April 26 2024TeckResourcesLtd
 
如何办理北卡罗来纳大学教堂山分校毕业证(文凭)UNC学位证书
如何办理北卡罗来纳大学教堂山分校毕业证(文凭)UNC学位证书如何办理北卡罗来纳大学教堂山分校毕业证(文凭)UNC学位证书
如何办理北卡罗来纳大学教堂山分校毕业证(文凭)UNC学位证书Fir La
 
Collective Mining | Corporate Presentation - April 2024
Collective Mining | Corporate Presentation - April 2024Collective Mining | Corporate Presentation - April 2024
Collective Mining | Corporate Presentation - April 2024CollectiveMining1
 
《加州大学圣克鲁兹分校学位证书复制》Q微信741003700美国学历疑难问题指南|挂科被加州大学圣克鲁兹分校劝退没有毕业证怎么办?《UCSC毕业证购买|加...
《加州大学圣克鲁兹分校学位证书复制》Q微信741003700美国学历疑难问题指南|挂科被加州大学圣克鲁兹分校劝退没有毕业证怎么办?《UCSC毕业证购买|加...《加州大学圣克鲁兹分校学位证书复制》Q微信741003700美国学历疑难问题指南|挂科被加州大学圣克鲁兹分校劝退没有毕业证怎么办?《UCSC毕业证购买|加...
《加州大学圣克鲁兹分校学位证书复制》Q微信741003700美国学历疑难问题指南|挂科被加州大学圣克鲁兹分校劝退没有毕业证怎么办?《UCSC毕业证购买|加...wyqazy
 
The Concept of Humanity in Islam and its effects at future of humanity
The Concept of Humanity in Islam and its effects at future of humanityThe Concept of Humanity in Islam and its effects at future of humanity
The Concept of Humanity in Islam and its effects at future of humanityJohanAspro
 
VIP Kolkata Call Girls Bidhannagar 8250192130 Available With Room
VIP Kolkata Call Girls Bidhannagar 8250192130 Available With RoomVIP Kolkata Call Girls Bidhannagar 8250192130 Available With Room
VIP Kolkata Call Girls Bidhannagar 8250192130 Available With Roomrran7532
 
Methanex Investor Presentation (April 2024)
Methanex Investor Presentation (April 2024)Methanex Investor Presentation (April 2024)
Methanex Investor Presentation (April 2024)Methanex Corporation
 
Russian Call Girls Kolkata Indira 🤌 8250192130 🚀 Vip Call Girls Kolkata
Russian Call Girls Kolkata Indira 🤌  8250192130 🚀 Vip Call Girls KolkataRussian Call Girls Kolkata Indira 🤌  8250192130 🚀 Vip Call Girls Kolkata
Russian Call Girls Kolkata Indira 🤌 8250192130 🚀 Vip Call Girls Kolkataanamikaraghav4
 
9654467111 Low Rate Call Girls In Tughlakabad, Delhi NCR
9654467111 Low Rate Call Girls In Tughlakabad, Delhi NCR9654467111 Low Rate Call Girls In Tughlakabad, Delhi NCR
9654467111 Low Rate Call Girls In Tughlakabad, Delhi NCRSapana Sha
 
Short-, Mid-, and Long-term gxxoals.pptx
Short-, Mid-, and Long-term gxxoals.pptxShort-, Mid-, and Long-term gxxoals.pptx
Short-, Mid-, and Long-term gxxoals.pptxHenryBriggs2
 

Recently uploaded (20)

Falcon Invoice Discounting - Best Platform
Falcon Invoice Discounting - Best PlatformFalcon Invoice Discounting - Best Platform
Falcon Invoice Discounting - Best Platform
 
如何办理东俄勒冈大学毕业证(文凭)EOU学位证书
如何办理东俄勒冈大学毕业证(文凭)EOU学位证书如何办理东俄勒冈大学毕业证(文凭)EOU学位证书
如何办理东俄勒冈大学毕业证(文凭)EOU学位证书
 
Nicola Mining Inc. Corporate Presentation April 2024
Nicola Mining Inc. Corporate Presentation April 2024Nicola Mining Inc. Corporate Presentation April 2024
Nicola Mining Inc. Corporate Presentation April 2024
 
如何办理伦敦大学毕业证(文凭)London学位证书
如何办理伦敦大学毕业证(文凭)London学位证书如何办理伦敦大学毕业证(文凭)London学位证书
如何办理伦敦大学毕业证(文凭)London学位证书
 
WheelTug PLC Pitch Deck | Investor Insights | April 2024
WheelTug PLC Pitch Deck | Investor Insights | April 2024WheelTug PLC Pitch Deck | Investor Insights | April 2024
WheelTug PLC Pitch Deck | Investor Insights | April 2024
 
VIP Kolkata Call Girl Rishra 👉 8250192130 Available With Room
VIP Kolkata Call Girl Rishra 👉 8250192130  Available With RoomVIP Kolkata Call Girl Rishra 👉 8250192130  Available With Room
VIP Kolkata Call Girl Rishra 👉 8250192130 Available With Room
 
如何办理密苏里大学堪萨斯分校毕业证(文凭)UMKC学位证书
如何办理密苏里大学堪萨斯分校毕业证(文凭)UMKC学位证书如何办理密苏里大学堪萨斯分校毕业证(文凭)UMKC学位证书
如何办理密苏里大学堪萨斯分校毕业证(文凭)UMKC学位证书
 
Cyberagent_For New Investors_EN_240424.pdf
Cyberagent_For New Investors_EN_240424.pdfCyberagent_For New Investors_EN_240424.pdf
Cyberagent_For New Investors_EN_240424.pdf
 
Sustainability Leadership, April 26 2024
Sustainability Leadership, April 26 2024Sustainability Leadership, April 26 2024
Sustainability Leadership, April 26 2024
 
如何办理北卡罗来纳大学教堂山分校毕业证(文凭)UNC学位证书
如何办理北卡罗来纳大学教堂山分校毕业证(文凭)UNC学位证书如何办理北卡罗来纳大学教堂山分校毕业证(文凭)UNC学位证书
如何办理北卡罗来纳大学教堂山分校毕业证(文凭)UNC学位证书
 
Collective Mining | Corporate Presentation - April 2024
Collective Mining | Corporate Presentation - April 2024Collective Mining | Corporate Presentation - April 2024
Collective Mining | Corporate Presentation - April 2024
 
《加州大学圣克鲁兹分校学位证书复制》Q微信741003700美国学历疑难问题指南|挂科被加州大学圣克鲁兹分校劝退没有毕业证怎么办?《UCSC毕业证购买|加...
《加州大学圣克鲁兹分校学位证书复制》Q微信741003700美国学历疑难问题指南|挂科被加州大学圣克鲁兹分校劝退没有毕业证怎么办?《UCSC毕业证购买|加...《加州大学圣克鲁兹分校学位证书复制》Q微信741003700美国学历疑难问题指南|挂科被加州大学圣克鲁兹分校劝退没有毕业证怎么办?《UCSC毕业证购买|加...
《加州大学圣克鲁兹分校学位证书复制》Q微信741003700美国学历疑难问题指南|挂科被加州大学圣克鲁兹分校劝退没有毕业证怎么办?《UCSC毕业证购买|加...
 
The Concept of Humanity in Islam and its effects at future of humanity
The Concept of Humanity in Islam and its effects at future of humanityThe Concept of Humanity in Islam and its effects at future of humanity
The Concept of Humanity in Islam and its effects at future of humanity
 
VIP Kolkata Call Girls Bidhannagar 8250192130 Available With Room
VIP Kolkata Call Girls Bidhannagar 8250192130 Available With RoomVIP Kolkata Call Girls Bidhannagar 8250192130 Available With Room
VIP Kolkata Call Girls Bidhannagar 8250192130 Available With Room
 
Methanex Investor Presentation (April 2024)
Methanex Investor Presentation (April 2024)Methanex Investor Presentation (April 2024)
Methanex Investor Presentation (April 2024)
 
Model Call Girl in Udyog Vihar Delhi reach out to us at 🔝9953056974🔝
Model Call Girl in Udyog Vihar Delhi reach out to us at 🔝9953056974🔝Model Call Girl in Udyog Vihar Delhi reach out to us at 🔝9953056974🔝
Model Call Girl in Udyog Vihar Delhi reach out to us at 🔝9953056974🔝
 
Russian Call Girls Kolkata Indira 🤌 8250192130 🚀 Vip Call Girls Kolkata
Russian Call Girls Kolkata Indira 🤌  8250192130 🚀 Vip Call Girls KolkataRussian Call Girls Kolkata Indira 🤌  8250192130 🚀 Vip Call Girls Kolkata
Russian Call Girls Kolkata Indira 🤌 8250192130 🚀 Vip Call Girls Kolkata
 
9654467111 Low Rate Call Girls In Tughlakabad, Delhi NCR
9654467111 Low Rate Call Girls In Tughlakabad, Delhi NCR9654467111 Low Rate Call Girls In Tughlakabad, Delhi NCR
9654467111 Low Rate Call Girls In Tughlakabad, Delhi NCR
 
Short-, Mid-, and Long-term gxxoals.pptx
Short-, Mid-, and Long-term gxxoals.pptxShort-, Mid-, and Long-term gxxoals.pptx
Short-, Mid-, and Long-term gxxoals.pptx
 
Call Girls In South Delhi 📱 9999965857 🤩 Delhi 🫦 HOT AND SEXY VVIP 🍎 SERVICE
Call Girls In South Delhi 📱  9999965857  🤩 Delhi 🫦 HOT AND SEXY VVIP 🍎 SERVICECall Girls In South Delhi 📱  9999965857  🤩 Delhi 🫦 HOT AND SEXY VVIP 🍎 SERVICE
Call Girls In South Delhi 📱 9999965857 🤩 Delhi 🫦 HOT AND SEXY VVIP 🍎 SERVICE
 

1 q18 earnings presentation final

  • 1. w w w. d e n b u r y. c o mN Y S E : D N R 1Q18 Earnings Presentation May 8, 2018
  • 2. N Y S E : D N R 2 w w w. d e n b u r y. c o m Agenda ● Introduction — John Mayer, Director of Investor Relations ● Overview and Operational Update — Chris Kendall, President & Chief Executive Officer ● Financial Review — Mark Allen, Executive Vice President & Chief Financial Officer
  • 3. N Y S E : D N R 3 w w w. d e n b u r y. c o m Cautionary Statements Forward-Looking Statements: The data and/or statements contained in this presentation that are not historical facts are forward-looking statements, as that term is defined in Section 21E of the Securities Exchange Act of 1934, as amended, that involve a number of risks and uncertainties. Such forward-looking statements may be or may concern, among other things, financial forecasts, future hydrocarbon prices and timing, the degree and length of any price recovery for oil, current or future liquidity sources or their adequacy to support our anticipated future activities, our ability to further reduce our debt levels, possible future write-downs of oil and natural gas reserves, together with assumptions based on current and projected oil and gas prices and oilfield costs, current or future expectations or estimations of our cash flows or the impact of changes in commodity prices on cash flows, availability of capital, borrowing capacity, availability of advantageous commodity derivative contracts or the predicted cash flow benefits therefrom, forecasted capital expenditures, drilling activity or methods, including the timing and location thereof, the nature of any future asset sales or the timing or proceeds thereof, estimated timing of commencement of carbon dioxide (CO2) flooding of particular fields or areas, timing of CO2 injections and initial production responses in tertiary flooding projects, development activities, finding costs, anticipated future cost savings, capital budgets, interpretation or prediction of formation details, production rates and volumes or forecasts thereof, hydrocarbon reserve quantities and values, CO2 reserves and supply and their availability, potential reserves, barrels or percentages of recoverable original oil in place, potential increases in worldwide tariffs or other trade restrictions, the likelihood, timing and impact of increased interest rates, the impact of regulatory rulings or changes, anticipated outcomes of pending litigation, prospective legislation affecting the oil and gas industry, environmental regulations, mark-to-market values, competition, long-term forecasts of production, rates of return, estimated costs, changes in costs, future capital expenditures and overall economics, worldwide economic conditions and other variables surrounding our estimated original oil in place, operations and future plans. Such forward-looking statements generally are accompanied by words such as “plan,” “estimate,” “expect,” “predict,” “forecast,” “to our knowledge,” “anticipate,” “projected,” “preliminary,” “should,” “assume,” “believe,” “may” or other words that convey, or are intended to convey, the uncertainty of future events or outcomes. Such forward-looking information is based upon management’s current plans, expectations, estimates, and assumptions and is subject to a number of risks and uncertainties that could significantly and adversely affect current plans, anticipated actions, the timing of such actions and our financial condition and results of operations. As a consequence, actual results may differ materially from expectations, estimates or assumptions expressed in or implied by any forward-looking statements made by us or on our behalf. Among the factors that could cause actual results to differ materially are fluctuations in worldwide oil prices or in U.S. oil prices and consequently in the prices received or demand for our oil and natural gas; decisions as to production levels and/or pricing by OPEC or production levels by U.S. shale producers in future periods; levels of future capital expenditures; effects of our indebtedness; success of our risk management techniques; accuracy of our cost estimates; availability or terms of credit in the commercial banking or other debt markets; fluctuations in the prices of goods and services; the uncertainty of drilling results and reserve estimates; operating hazards and remediation costs; disruption of operations and damages from well incidents, hurricanes, tropical storms, forest fires, or other natural occurrences; acquisition risks; requirements for capital or its availability; conditions in the worldwide financial, trade and credit markets; general economic conditions; competition; government regulations, including changes in tax or environmental laws or regulations; and unexpected delays, as well as the risks and uncertainties inherent in oil and gas drilling and production activities or that are otherwise discussed in this presentation, including, without limitation, the portions referenced above, and the uncertainties set forth from time to time in our other public reports, filings and public statements including, without limitation, the Company’s most recent Form 10-K. Statement Regarding Non-GAAP Financial Measures: This presentation also contains certain non-GAAP financial measures. Any non-GAAP measure included herein is accompanied by a reconciliation to the most directly comparable U.S. GAAP measure along with a statement on why the Company believes the measure is beneficial to investors, which statements are included at the end of this presentation. Note to U.S. Investors: Current SEC rules regarding oil and gas reserves information allow oil and gas companies to disclose in filings with the SEC not only proved reserves, but also probable and possible reserves that meet the SEC’s definitions of such terms. We disclose only proved reserves in our filings with the SEC. Denbury’s proved reserves as of December 31, 2016 and December 31, 2017 were estimated by DeGolyer and MacNaughton, an independent petroleum engineering firm. In this presentation, we may make reference to probable and possible reserves, some of which have been estimated by our independent engineers and some of which have been estimated by Denbury’s internal staff of engineers. In this presentation, we also may refer to estimates of original oil in place, resource or reserves “potential,” barrels recoverable, “risked” and “unrisked” resource potential, estimated ultimate recovery (EUR) or other descriptions of volumes potentially recoverable, which in addition to reserves generally classifiable as probable and possible (2P and 3P reserves), include estimates of resources that do not rise to the standards for possible reserves, and which SEC guidelines strictly prohibit us from including in filings with the SEC. These estimates, as well as the estimates of probable and possible reserves, are by their nature more speculative than estimates of proved reserves and are subject to greater uncertainties, and accordingly the likelihood of recovering those reserves is subject to substantially greater risk.
  • 4. N Y S E : D N R 4 w w w. d e n b u r y. c o m Overview & Operational Update Chris Kendall
  • 5. N Y S E : D N R 5 w w w. d e n b u r y. c o m Mission Canyon Exploitation Building on Initial Mission Canyon Success 1) EUR resource potential represents total recoverable reserves estimated by the Company based upon a variety of recovery factors and long-term oil price assumptions, which in addition to probable and possible reserves also may include estimates of resources that do not rise to the standards of possible reserves. See slide 3 “Cautionary Statements” for additional information. • Two new horizontal wells drilled and completed in March/April 2018 in Pennel, north of 1st well • MC 22-19NH – 4,600’ lateral; MC 22-19SH – 2,400’ lateral • Performance from both new wells exceeded expectations, current combined gross production from all 3 MC wells is 2,500 - 3,000 BOPD • Increased EUR from initial 400 MBbl/well(1) to over 500 MBbl/well(1); 100% oil • Will continue to refine EUR as development matures • Increased MC resource potential to 9.4 MMBOE(1) based on recent results • Low drill and complete costs averaging $3.5MM/well • High quality reservoir does not require hydraulic fracture stimulation • 5 additional wells planned for 2018 • 3 wells in Coral Creek, including 1 downdip delineation well • 2 wells to test Little Beaver/Little Beaver East prospects • Initial target of ~24 additional locations across CCA, potential to increase • Upside CO2 EOR potential after primary production
  • 6. N Y S E : D N R 6 w w w. d e n b u r y. c o m Tinsley Perry Sand Overview • Proven light tight oil accumulation with low historical vertical well recovery; plan to develop with horizontal wells • Up to 6,000 prospective acres in North and West Fault Blocks • Drilled first well in April with positive initial indications, completion in progress • Up to 18 potential horizontal locations identified • Drill and complete cost estimated at $3 – $4 million per well • Upside CO2 EOR potential after primary production West Fault Block North Fault Block East Fault Block Recovery Factor Well 1 April 18) Mississippi
  • 7. N Y S E : D N R 7 w w w. d e n b u r y. c o m 1H18 2H18 Development Oyster Bayou Facility Expansion Bell Creek Phase 5 Response West Yellow Creek Response CCA EOR Investment Decision Grieve Field Startup Delhi Tuscaloosa Infill Exploitation Cedar Creek Anticline (Mission Canyon) Tinsley (Perry) Tinsley (Cotton Valley) Hartzog Draw Deep Financial Houston Surface Acreage Sales Extend Bank Line & Maintain Liquidity 2018 Watch List Safety & Environment Value Culture Project Delivery Capital Discipline Reservoir Management A Foundation of Strong Execution ✔ ✔ ✔ ✔ ✔
  • 8. N Y S E : D N R 8 w w w. d e n b u r y. c o m Production by Area & 2018 Guidance Field 1Q18 4Q17 1Q17 Delhi 4,169 4,906 4,991 Hastings 5,704 5,747 4,288 Heidelberg 4,445 4,751 4,730 Oyster Bayou 5,056 4,868 5,075 Tinsley 6,053 6,241 6,666 Bell Creek 4,050 3,571 3,209 Salt Creek 2,002 2,172 — Other tertiary 57 7 14 Mature area(1) 7,174 7,225 8,097 Total tertiary production 38,710 39,488 37,070 Gulf Coast non-tertiary 5,706 5,821 6,170 Cedar Creek Anticline 14,437 14,302 15,067 Other Rockies non-tertiary 1,485 1,533 1,626 Total non-tertiary production 21,628 21,656 22,863 Total production 60,338 61,144 59,993 1) Mature area includes Brookhaven, Cranfield, Eucutta, Little Creek, Lockhart Crossing, Mallalieu, Martinville, McComb, and Soso fields. Average Daily Production (BOE/d) (2) FY2016 2017 2018 2017 2018 60,000 - 64,000 1Q18 impacted by extreme winter weather ~800 net BOE/d; previously factored into full-year guidance 2018 Production Guidance (BOE/d) 1Q18 2018E 60,338
  • 9. N Y S E : D N R 9 w w w. d e n b u r y. c o m Analysis of Total Operating Costs $ per BOE 1Q18 4Q17 1Q17 ($MM) ($/BOE) ($MM) ($/BOE) ($MM) ($/BOE) CO2 Costs $17 $3.16 $17 $3.02 $16 $2.86 Power & Fuel 38 6.95 32 5.72 32 5.93 Labor & Overhead 36 6.64 35 6.24 34 6.34 Repairs & Maintenance 4 0.84 5 0.84 5 0.95 Chemicals 6 1.03 5 0.95 6 1.15 Workovers 15 2.85 12 2.20 14 2.65 Other 2 0.33 6 0.88 7 1.23 Total Normalized LOE(1) $118 $21.80 $112 $19.85 $114 $21.11 Special or Unusual Items(2) — — (7) (1.21) — — Total LOE $118 $21.80 $105 $18.64 $114 $21.11 1) Normalized LOE excludes special or unusual items (see footnote 2 below). 2) Special or unusual items consist of a $7MM adjustment for pricing related to one of our industrial CO2 sources in 4Q17. Total Operating Costs
  • 10. N Y S E : D N R 10 w w w. d e n b u r y. c o m Operating Margin Improvement 1Q17 1Q18 Revenue per BOE(1) $49.35 $62.61 Lifting Cost per BOE $21.11 $21.80 Marketing, Transportation and Taxes per BOE $5.73 $6.36 Operating Margin per BOE(2) $22.51 $34.45 1) Revenues exclude gain/loss on derivative settlements. 2) Operating margin calculated as revenues less lifting cost, marketing, transportation and taxes. 90% of oil price change contributed to higher Operating Margin $21.11 $21.80 $5.73 $6.36 $22.51 $34.45 Operating Margin per BOE Marketing, Transportation and Taxes Lifting Cost per BOE (2) Revenue per BOE(1) $49.35 Revenue per BOE(1) $62.61
  • 11. N Y S E : D N R 11 w w w. d e n b u r y. c o m Financial Review Mark Allen
  • 12. N Y S E : D N R 12 w w w. d e n b u r y. c o m 1Q18 4Q17 In millions, except per-share data Amount Per Diluted Share Amount Per Diluted Share Net income (GAAP measure) $40 $0.09 $127 $0.31 Adjustments to reconcile to adjusted net income (non-GAAP measure) Noncash fair value losses on commodity derivatives 15 0.03 78 0.19 Transaction costs and other 2 — 3 0.01 Estimated income taxes on above adjustments to net income and other discrete tax items (3) — (160) (0.39) Adjusted net income (non-GAAP measure)(1) $54 $0.12 $48 $0.12 Weighted-average shares outstanding Basic 392.7 392.4 Diluted 451.5 405.8 1) See press release attached as exhibit 99.1 to the Form 8-K filed May 8, 2018 for additional information, indicating why the Company believes this non-GAAP measure is useful for investors. Reconciliation of Adjusted Net Income Reconciliation of Net Income (GAAP Measure) to Adjusted Net Income (Non-GAAP Measure)(1)
  • 13. N Y S E : D N R 13 w w w. d e n b u r y. c o m 1) A non-GAAP measure. See press release attached as exhibit 99.1 to the Form 8-K filed May 8, 2018 for additional information indicating why the Company believes this non-GAAP measure is useful for investors. 1Q18 Selected Financial Highlights In millions 1Q18 4Q17 Reconciliation of Cash Flow from Operations (GAAP Measure) to Adjusted Cash Flow from Operations (Non-GAAP Measure)(1) Cash flows from operations (GAAP measure) $92 $124 Net change in assets and liabilities relating to operations 33 10 Adjusted cash flows from operations (non-GAAP measure)(1) $125 $134 Interest payments treated as debt reduction (22) (15) Adjusted cash flows from operations less interest treated as debt reduction (non-GAAP measure)(1) $103 $119 Revenues and Commodity Derivative Settlements Revenues $348 $321 Payment on settlements of commodity derivatives (33) (9) Revenues and commodity derivative settlements combined $315 $312 Realized Oil Prices Average realized oil price per barrel (excluding derivative settlements) $64.25 $57.17 Average realized oil price per barrel (including derivative settlements) $57.89 $55.49
  • 14. N Y S E : D N R 14 w w w. d e n b u r y. c o m NYMEX Oil Differential Summary During 1Q18, ~65% of our crude oil was based on, or partially tied to, the LLS index price $ per barrel 1Q17 2Q17 3Q17 4Q17 1Q18 Tertiary oil fields $(1.60) $(1.07) $(0.21) $2.27 $1.61 Gulf Coast region (1.58) (1.01) (0.10) 2.84 1.87 Rocky Mountain region (1.74) (1.75) (0.83) (1.09) 0.22 Cedar Creek Anticline (2.08) (1.93) (0.96) (0.57) (0.11) Denbury totals $(1.64) $(1.16) $(0.34) $1.70 $1.29 NYMEX Oil Differentials 1Q18 was the strongest Rocky Mountain differential the Company has ever realized
  • 15. N Y S E : D N R 15 w w w. d e n b u r y. c o m Hedge Positions – as of May 7, 2018 2018 2019 Detail as of May 7, 2018 1H 2H 1H 2H FixedPriceSwaps WTI NYMEX Volumes Hedged (Bbls/d) 15,500 15,500 ─ ─ Swap Price(1) $50.13 $50.13 ─ ─ Volumes Hedged (Bbls/d) 5,000 5,000 3,500 ─ Swap Price(1) $56.54 $56.54 $59.05 ─ Argus LLS Volumes Hedged (Bbls/d) 5,000 5,000 ─ ─ Swap Price(1) $60.18 $60.18 ─ ─ 3-WayCollars WTI NYMEX Volumes Hedged (Bbls/d) 15,000 15,000 8,500 12,000 Sold Put Price/Floor Price/Ceiling Price(1)(2) $36.50/$46.50/$53.88 $36.50/$46.50/$53.88 $47/$55/$66.71 $47/$55/$66.23 Volumes Hedged (Bbls/d) ─ ─ 3,000 3,000 Sold Put Price/Floor Price/Ceiling Price(1)(2) ─ ─ $50/$58/$70.41 $50/$58/$70.41 Total Volumes Hedged 40,500 40,500 15,000 15,000 BasisSwaps Argus LLS Volumes Hedged (Bbls/d) 20,000 ─ ─ ─ Swap Price(1)(3) $4.17 ─ ─ ─ Total Volumes Hedged 20,000 ─ ─ ─ 1) Averages are volume weighted. 2) If oil prices were to average less than the sold put price, receipts on settlement would be limited to the difference between the floor price and sold put price. 3) The basis swap contracts establish a fixed amount for the differential between Argus WTI and Argus LLS on a trade-month basis for the periods indicated.
  • 16. N Y S E : D N R 16 w w w. d e n b u r y. c o m 1Q18 4Q17 In millions, unless otherwise noted ($) ($/BOE) ($) ($/BOE) Lease operating expenses(1) $118 $21.80 $105 $18.64 General and administrative expenses 20 3.73 21 3.64 Interest expense (net of amounts capitalized) 17 3.17 23 4.17 DD&A 52 9.66 53 9.47 Income tax provision (benefit) 14 (134) 1) See slide 9 for additional detail on lease operating expenses. 2) Cash interest is presented on an accrual basis, and includes interest which is paid semiannually on the Company's 9% Senior Secured Second Lien Notes due 2021, 9¼% Senior Secured Second Lien Notes due 2022, 5% Convertible Senior Notes due 2023 and 3½% Convertible Senior Notes due 2024, most of which is accounted for as debt and therefore not reflected as interest for financial reporting purposes. Components of Interest Expense (in millions) 1Q18 4Q17 Cash interest(2) $47 $45 Less: interest on Senior Secured Notes and Convertible Senior Notes not reflected as interest for financial reporting purposes (22) (15) Noncash interest expense 1 2 Less: capitalized interest (9) (9) Interest expense, net $17 $23 Selected Expense Line Items $3.50 $4.00 $4.50 $5.00 $5.50 $6.00 2009 2011 2013 2015 1Q17 3Q17 1Q18 G&A/BOE Trend 1Q17 2Q17 3Q17 4Q17 2017 1Q18 2018
  • 17. N Y S E : D N R 17 w w w. d e n b u r y. c o m $953 Million Debt Principal Reduction Since 12/31/14 $2,852 $826 $59 $1,071 $324 $212 $395 $450 12/31/14 3/31/18 Pro Forma Significantly Improving Leverage Profile $3,571 $2,618 (In millions) $450 $615 $204 $456 $315 $59 $308 2018 2019 2020 2021 2022 2023 Convertible Sr. Notes(2) Sr. Subordinated Notes Sr. Secured Bank Credit Facility Pipeline / Capital Lease Debt Sr. Secured 2nd Lien Notes 3/31/18 Pro Forma Debt Maturity Profile (In millions) 1) 3/31/18 debt principal balances pro forma for the impact of the conversion of 3½% Convertible Senior Notes due 2024 in April 2018. 2) 5% Convertible Senior Notes due 2023 are convertible into up to 17 million shares of the Company’s common stock. Conversion strike at $3.55 VWAP for 10 out of 15 trading days. (1) Expect significant improvement in debt metrics based on 2018 budget >$500 million of bank line availability at 3/31/18
  • 18. N Y S E : D N R 18 w w w. d e n b u r y. c o m Significantly Improving Leverage Metrics in millions Trailing 12 months Trailing 12 months (excl. hedges) 1Q18 1Q18 (excl. hedges) Adjusted EBITDAX(1) $487 $541 $142 $175 1Q18 Annualized 568 700 3/31/18 Pro Forma Debt Principal(2) 2,618 2,618 2,618 2,618 Debt/Adjusted EBITDAX(1) 5.4x 4.8X 4.6x 3.7x 1) A non-GAAP measure. See press release attached as Exhibit 99.1 to the Form 8-K filed May 8, 2018 for additional information, as well as slide 20 indicating why the Company believes this non-GAAP measure is useful for investors. 2) 3/31/18 debt principal balances pro forma for the impact of the conversion of 3½% Convertible Senior Notes due 2024 in April 2018.
  • 19. N Y S E : D N R 19 w w w. d e n b u r y. c o m Q&A
  • 20. N Y S E : D N R 20 w w w. d e n b u r y. c o m Reconciliation of net income (GAAP measure) to adjusted EBITDAX (non-GAAP measure) 1) Excludes pro forma adjustments related to qualified acquisitions or dispositions under the Company’s senior secured bank credit facility. Adjusted EBITDAX is a non-GAAP financial measure which is calculated based upon (but not identical to) a financial covenant related to “Consolidated EBITDAX” in the Company’s senior secured bank credit facility, which excludes certain items that are included in net income, the most directly comparable GAAP financial measure. Items excluded include interest, income taxes, depreciation, depletion and amortization, impairments, and items that the Company believes affect the comparability of operating results such as items whose timing and/or amount cannot be reasonably estimated or are non-recurring. Management believes Adjusted EBITDAX may be helpful to investors in order to assess the Company’s operating performance as compared to that of other companies in its industry, without regard to financing methods, capital structure or historical costs basis. It is also commonly used by third parties to assess leverage, and the Company’s ability to incur and service debt and fund capital expenditures. Adjusted EBITDAX should not be considered in isolation, as a substitute for, or more meaningful than, net income, cash flow from operations, or any other measure reported in accordance with GAAP. Adjusted EBITDAX may not be comparable to similarly titled measures of another company because all companies may not calculate Adjusted EBITDAX, EBITDAX or EBITDA in the same manner. 2017 2018 In millions Q1 Q2 Q3 Q4 FY Q1 TTM Net income (GAAP measure) $22 $14 $0 $127 $163 $40 $181 Adjustments to reconcile to Adjusted EBITDAX Interest expense 27 24 25 23 99 17 89 Income tax expense (benefit) 21 10 (14) (134) (117) 14 (124) Depletion, depreciation and amortization 51 51 52 53 207 52 208 Noncash fair value adjustments on commodity derivatives (52) (22) 25 78 29 15 96 Stock-based compensation 4 5 3 3 15 3 14 Noncash, non-recurring and other(1) 3 4 11 7 25 1 23 Adjusted EBITDAX (non-GAAP measure) $76 $86 $102 $157 $421 $142 $487 Non-GAAP Measures