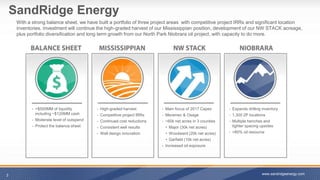
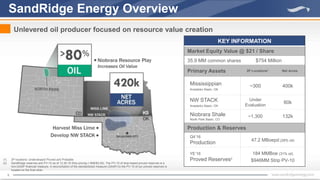
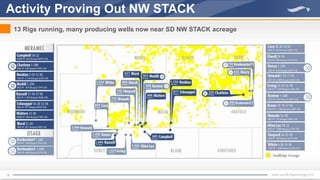
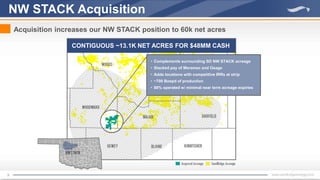
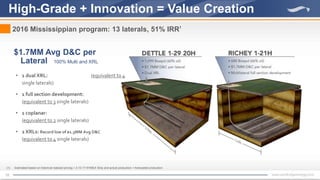
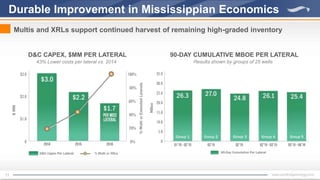
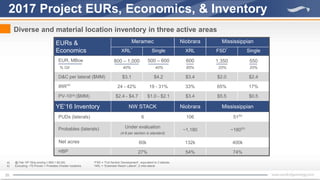
- SandRidge Energy has built a portfolio focused on three project areas: Mississippian, NW STACK, and North Park Niobrara
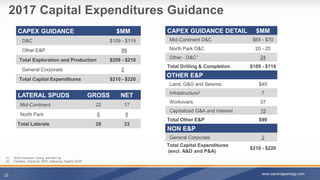
- The presentation highlights recent well results and cost reductions in each area that have improved economics and supported continued development
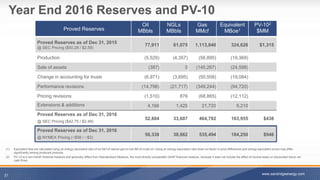
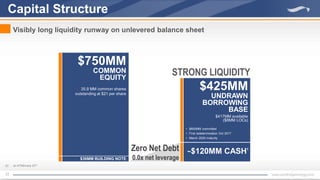
- SandRidge has over $500 million in liquidity and a long drilling inventory across the projects to support its future investment and growth plans