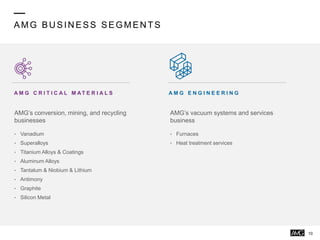
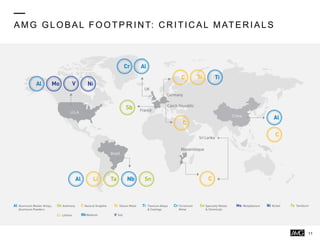
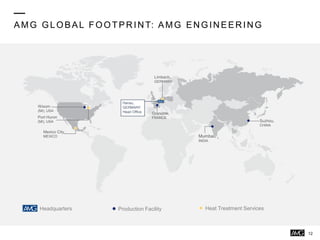
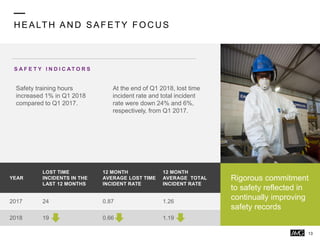
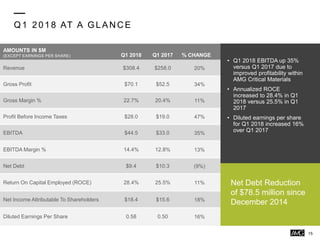
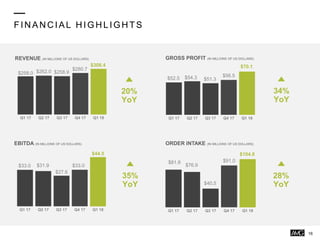
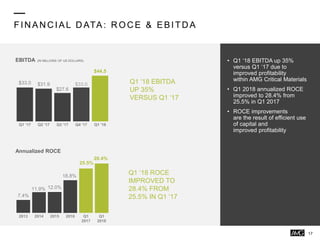
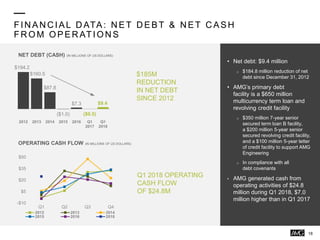
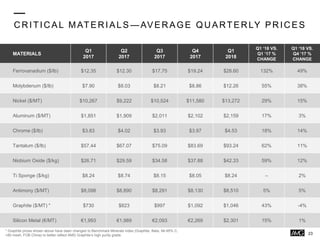
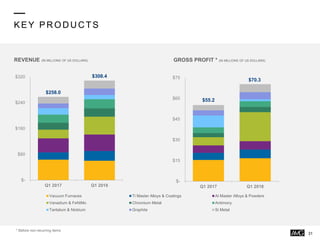
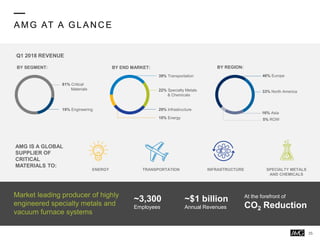
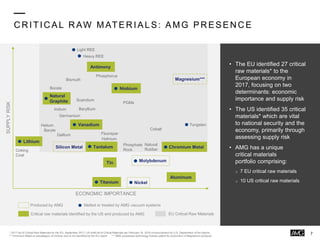
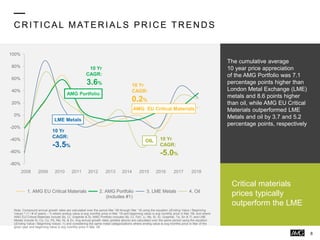
AMG is a global critical materials company focused on CO2 reduction through enabling and mitigating technologies. It has a strong capital structure with no net debt and is positioned for growth through disciplined organic expansion and acquisitions. AMG has presence in 7 EU-designated critical raw materials and 10 US-designated critical materials. Prices for critical materials in AMG's portfolio have historically outperformed benchmark metals and oil indices. AMG operates businesses in vanadium conversion, superalloys, and mining/recycling of critical materials to supply growing demand.


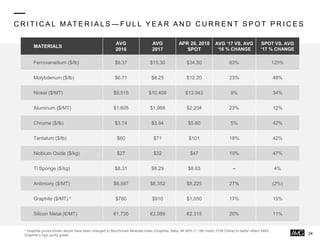
![C R ITIC AL MATER IALS PR IC ES: H ISTOR IC AL PR IC IN G
9
• Metal prices are measured
on a scale of 0 to 10, with 0
and 10 representing the
minimum and maximum
average quarterly prices
occurring since the end of
2005
• The positions demonstrate
the current price level of
each metal with respect to
their various historical price
points since the end of 2005
AMG’s relevant
prices have started
to move out of the
bottom quartiles
6.0
2.8
1.2
7.7
3.6
4.0
8.7
7.9
6.6
8.6
5.1
3.7
3.1
1.4
0.5
1.9
3.2 3.2
0.0
5.4
3.0
6.8
0.7
3.7
0
2.5
5
7.5
10
Scale
Metals
Mar 2018 Position Mar 2017 Position
Highest
Price
Lowest
Price
Note: Metal Positions are measured on a scale of 0 to 10, with 0 being the minimum price and 10 being the maximum price. They are calculated
using the formula [(Dec ‘05 ending value – min. monthly avg) / (max. monthly avg – min. monthly avg) *10] where maximum and minimum
monthly averages are measured over the period 31 Dec ‘05 through 31 Mar ’18; graphite prices are per Benchmark Minerals, showing five year
historical data.
Cr Mo Ni FeV Ti Al C Si Ta SbNbLi
[unchanged]](https://image.slidesharecdn.com/amginvestorpresentationmay2018-180502063630/85/AMG-Investor-Presentation-May-2018-9-320.jpg)