Download to read offline
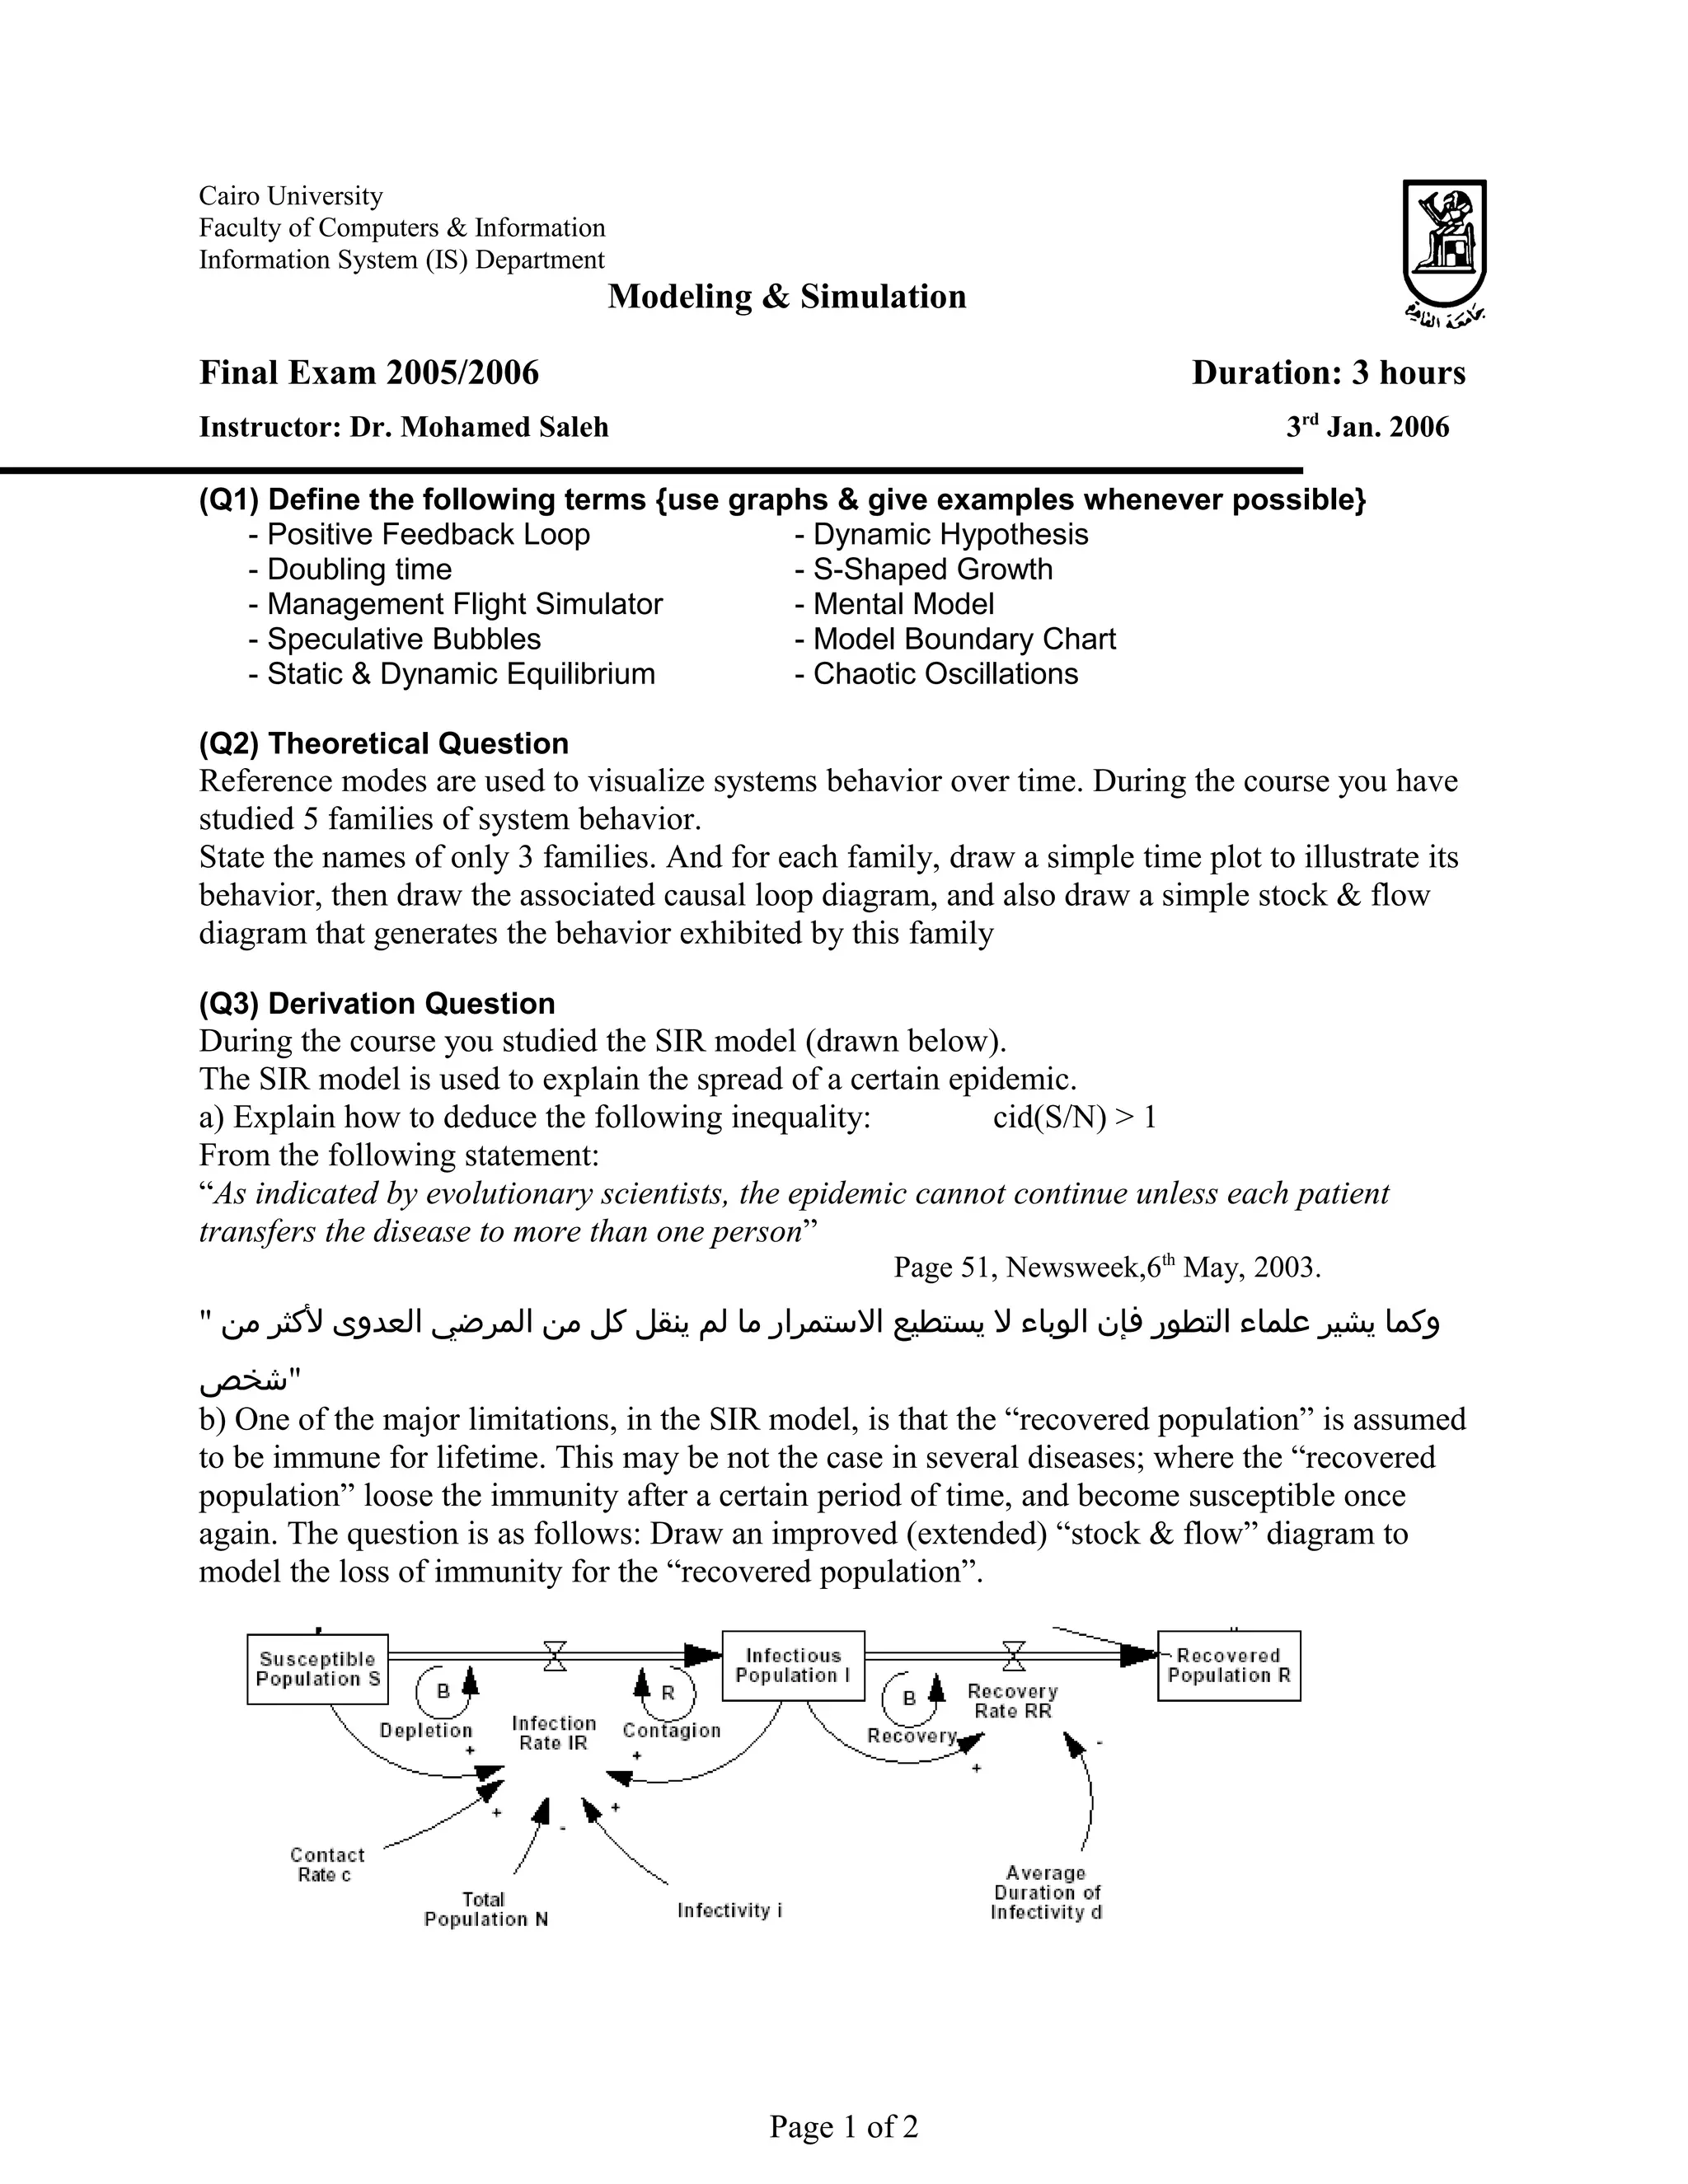
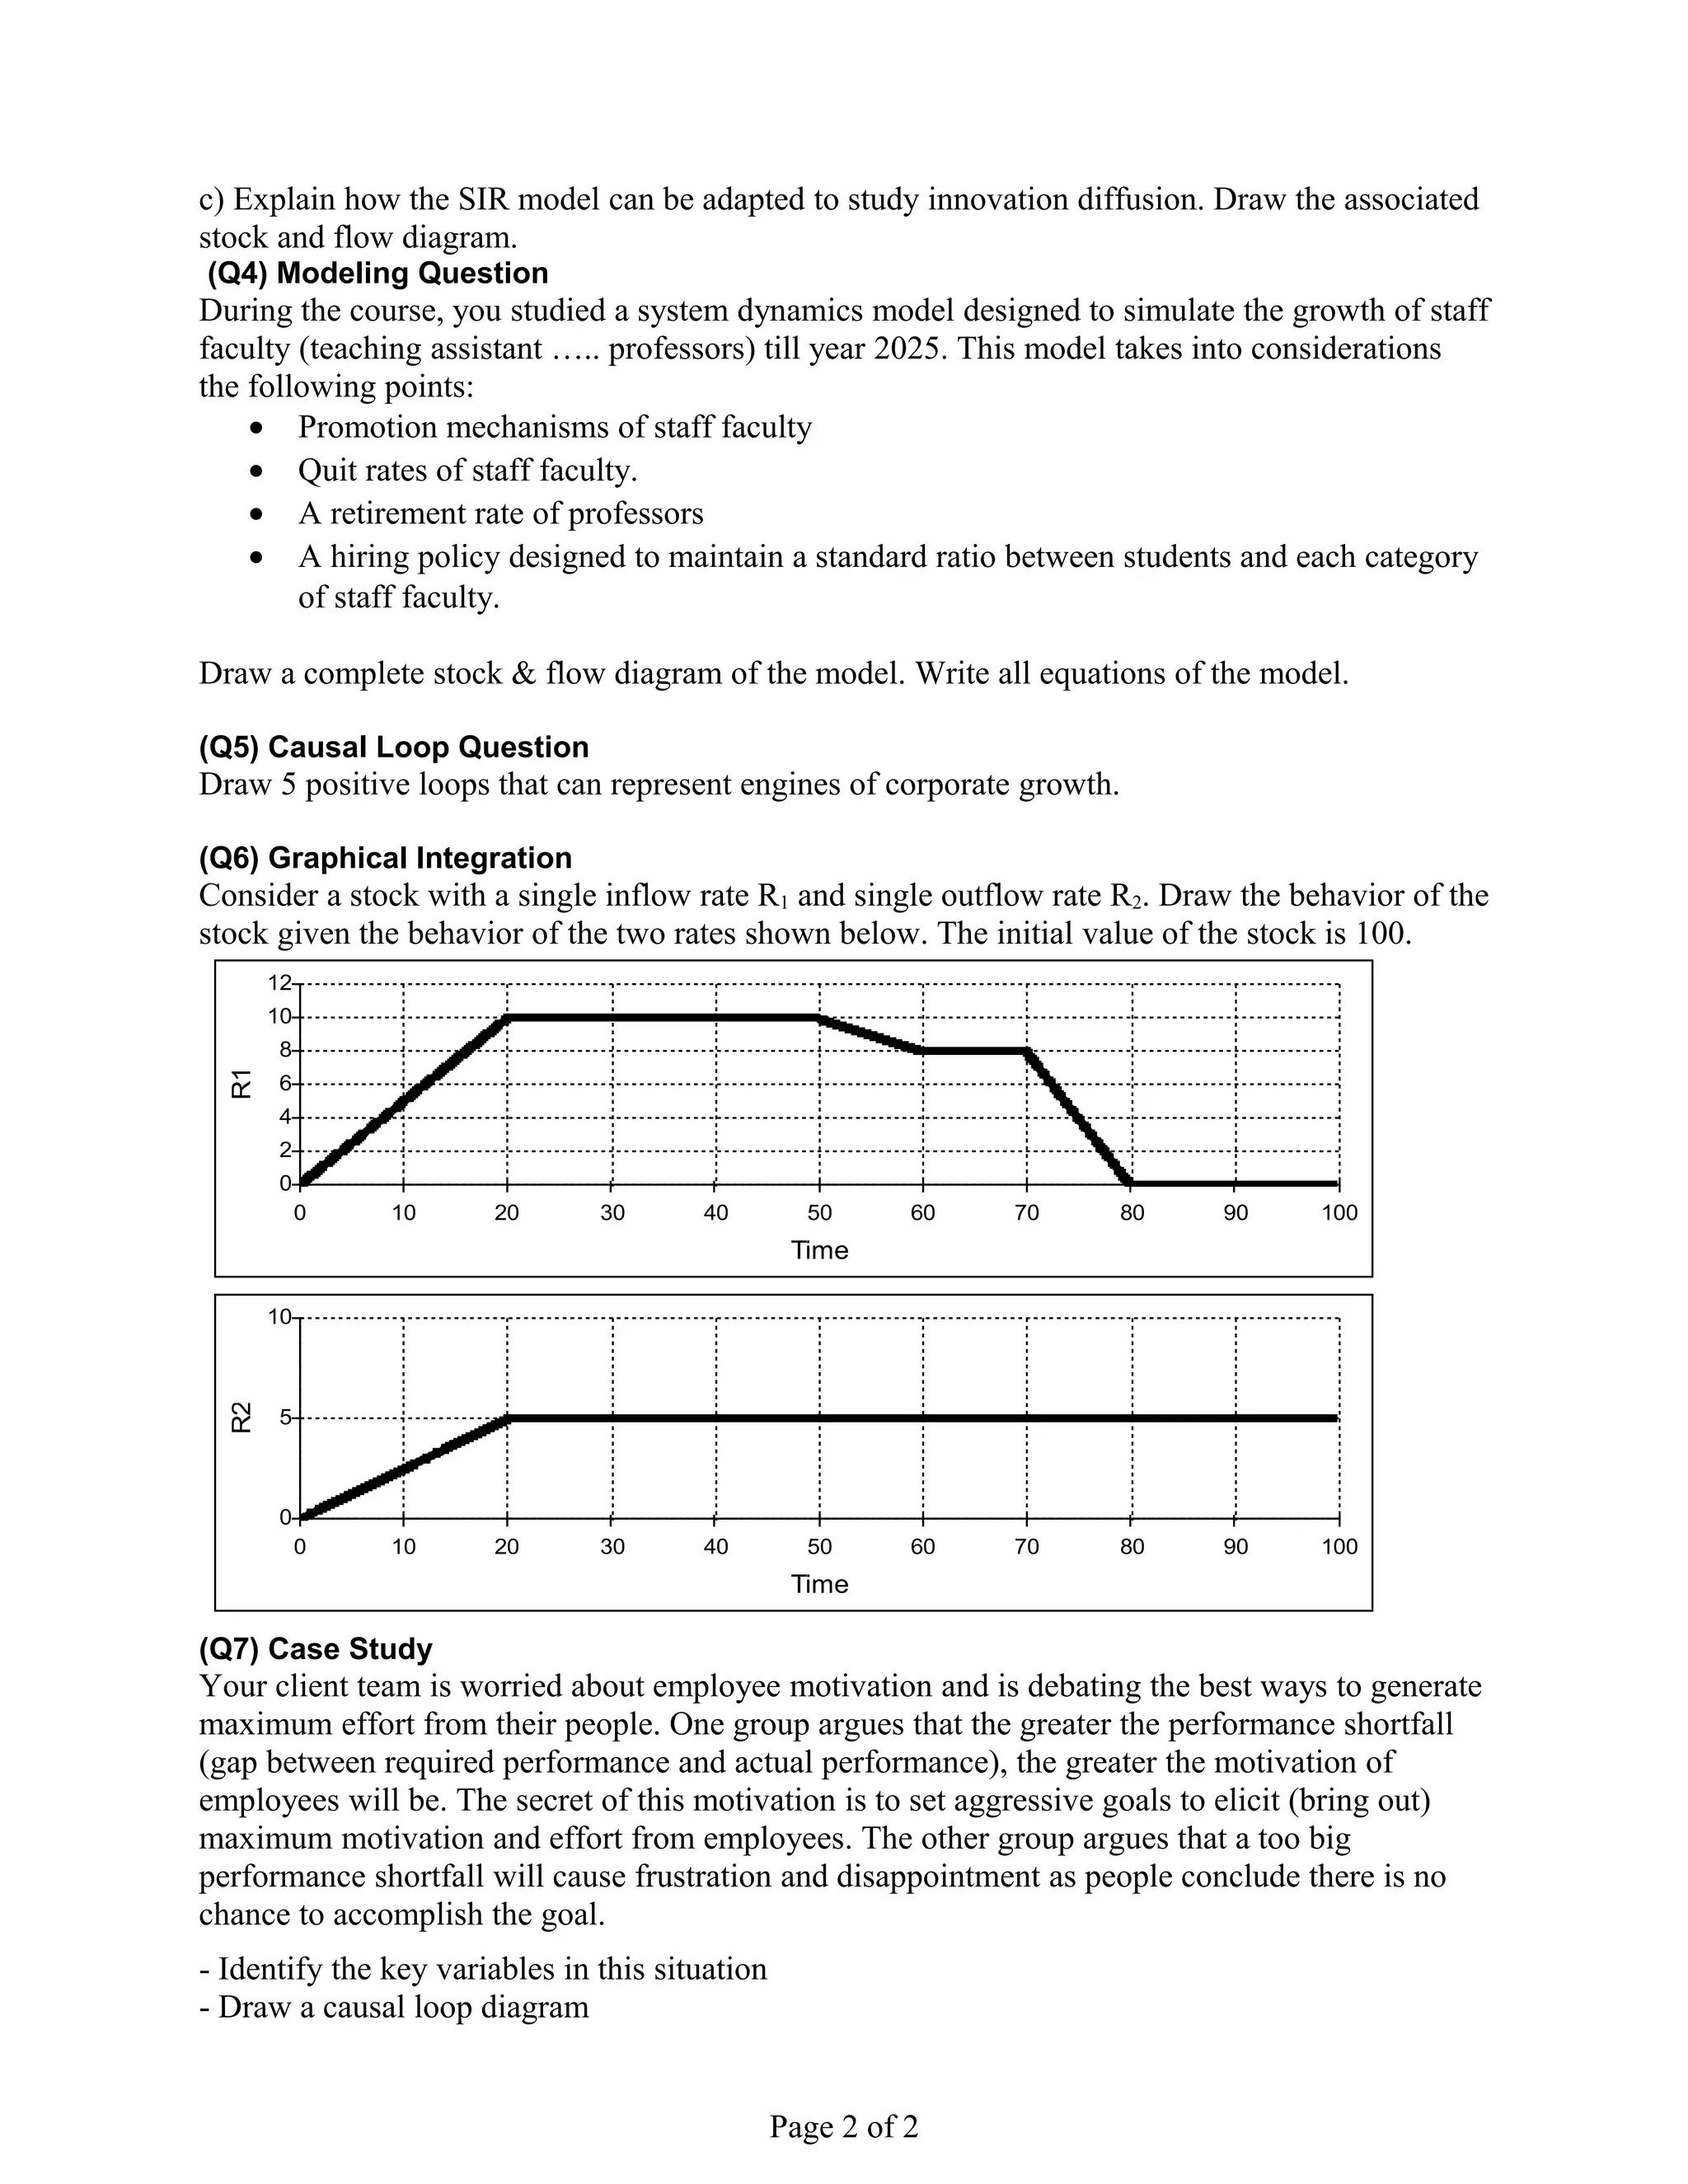

This document contains a final exam for a modeling and simulation course. It includes 7 questions that assess students' understanding of key modeling concepts through definitions, diagrams, equations, and case studies. Question 2 asks students to describe 3 system behavior families using time plots, causal loops, and stock and flow diagrams. Question 4 requires drawing a complete stock and flow model of staff faculty growth including equations. Question 5 asks students to draw 5 positive loops representing corporate growth engines.