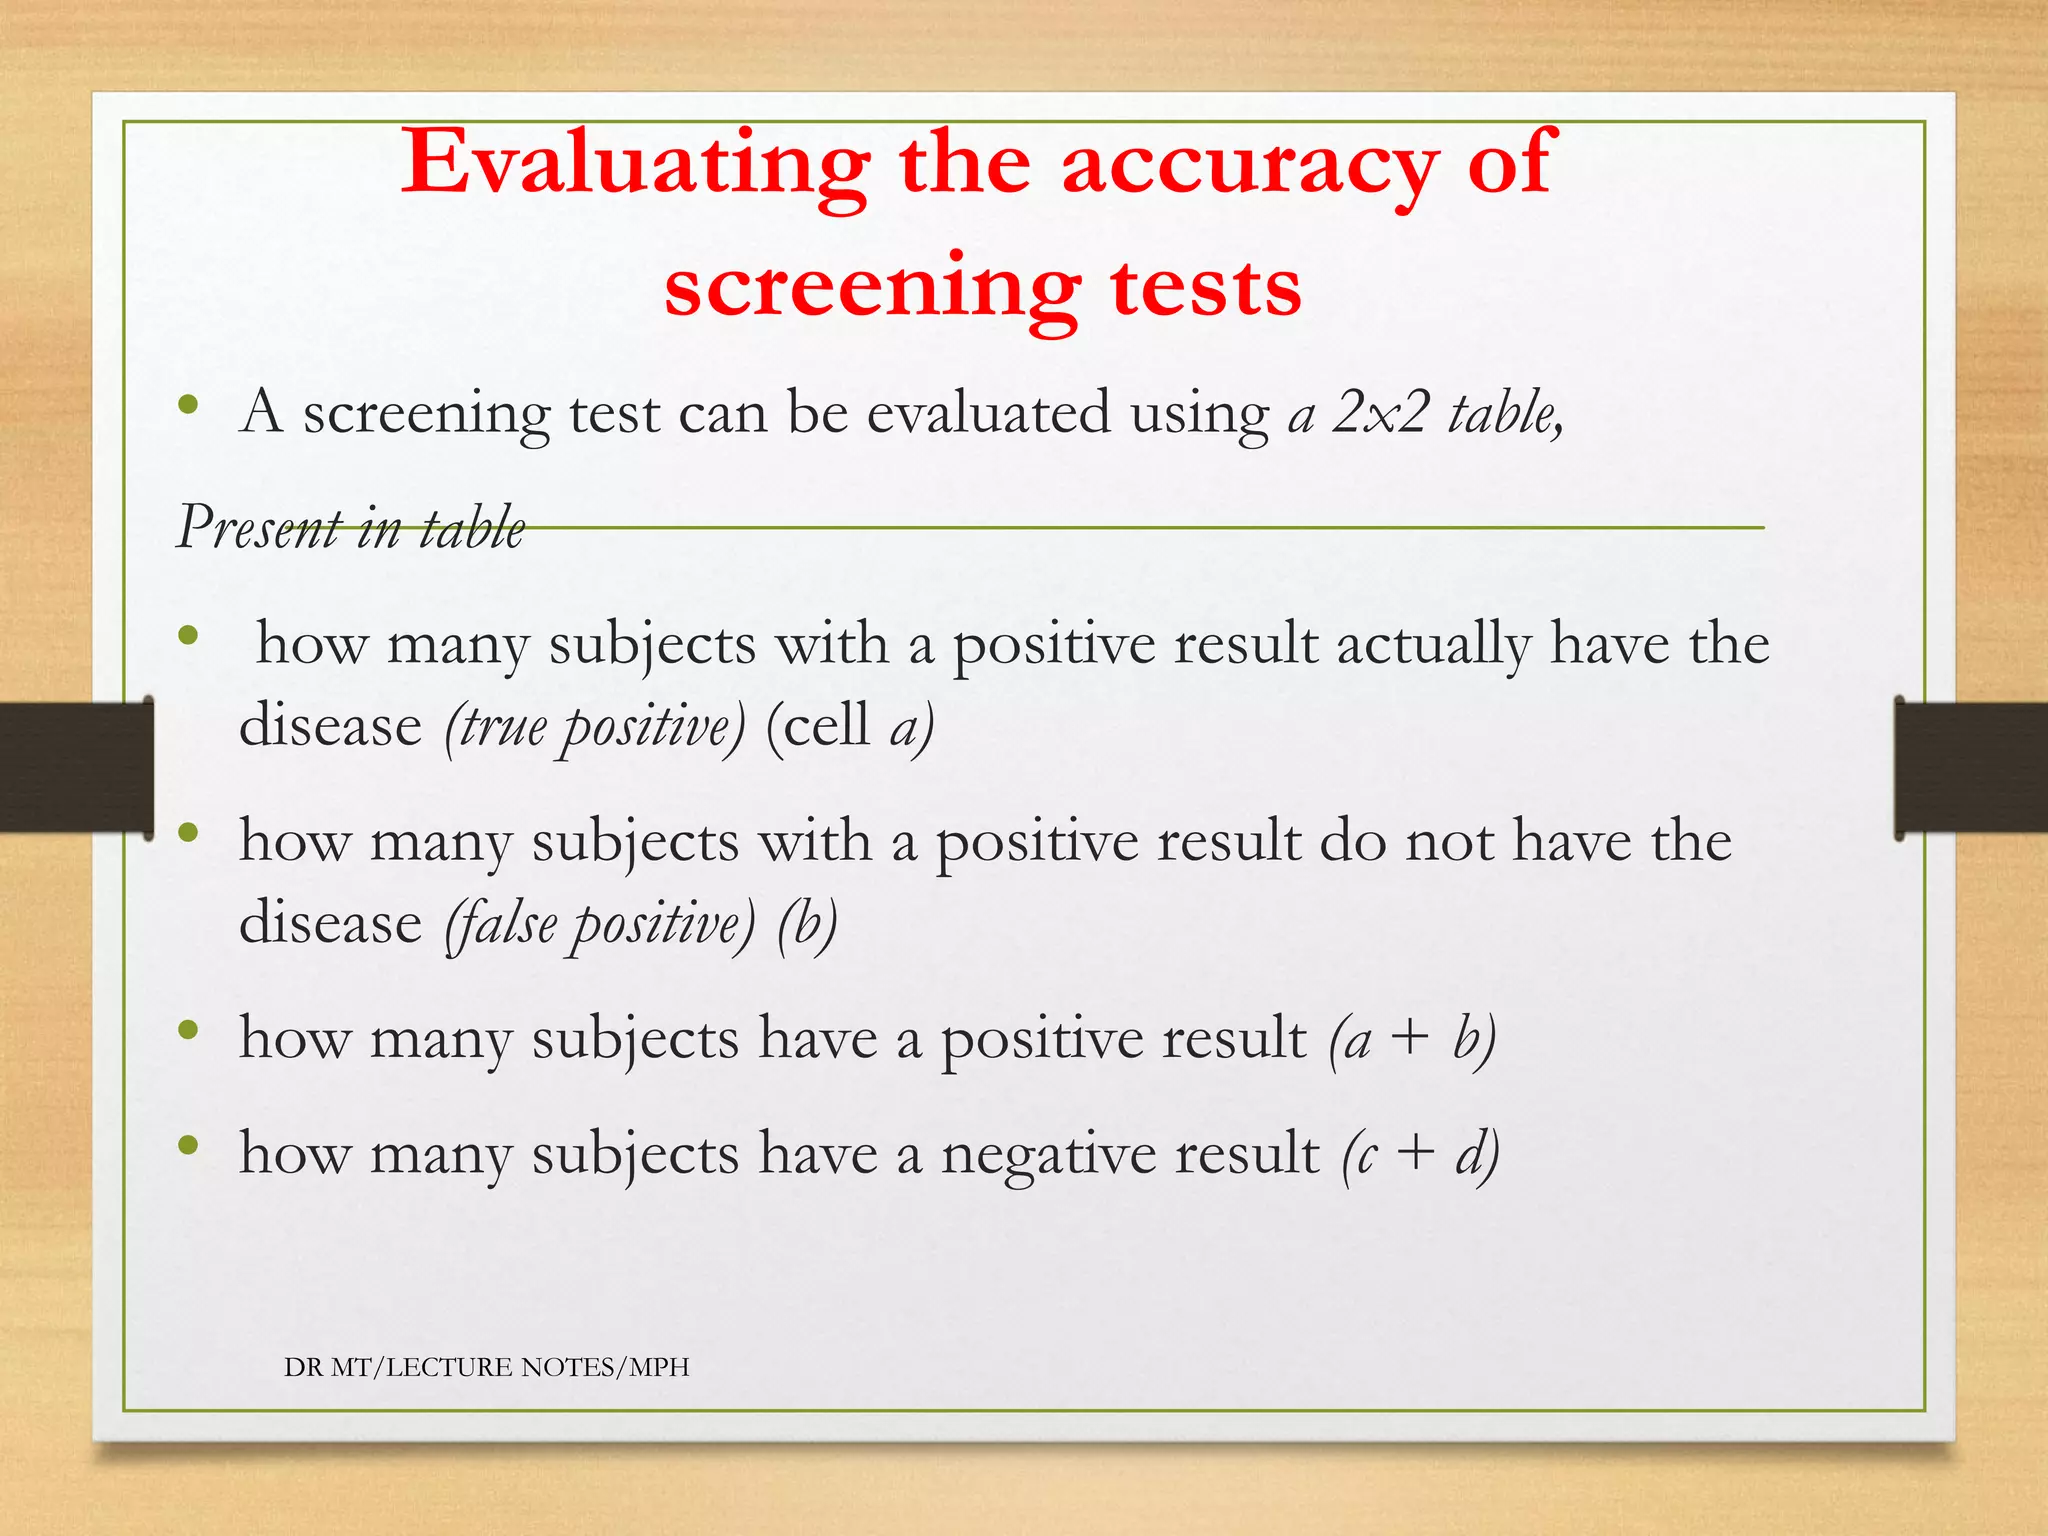
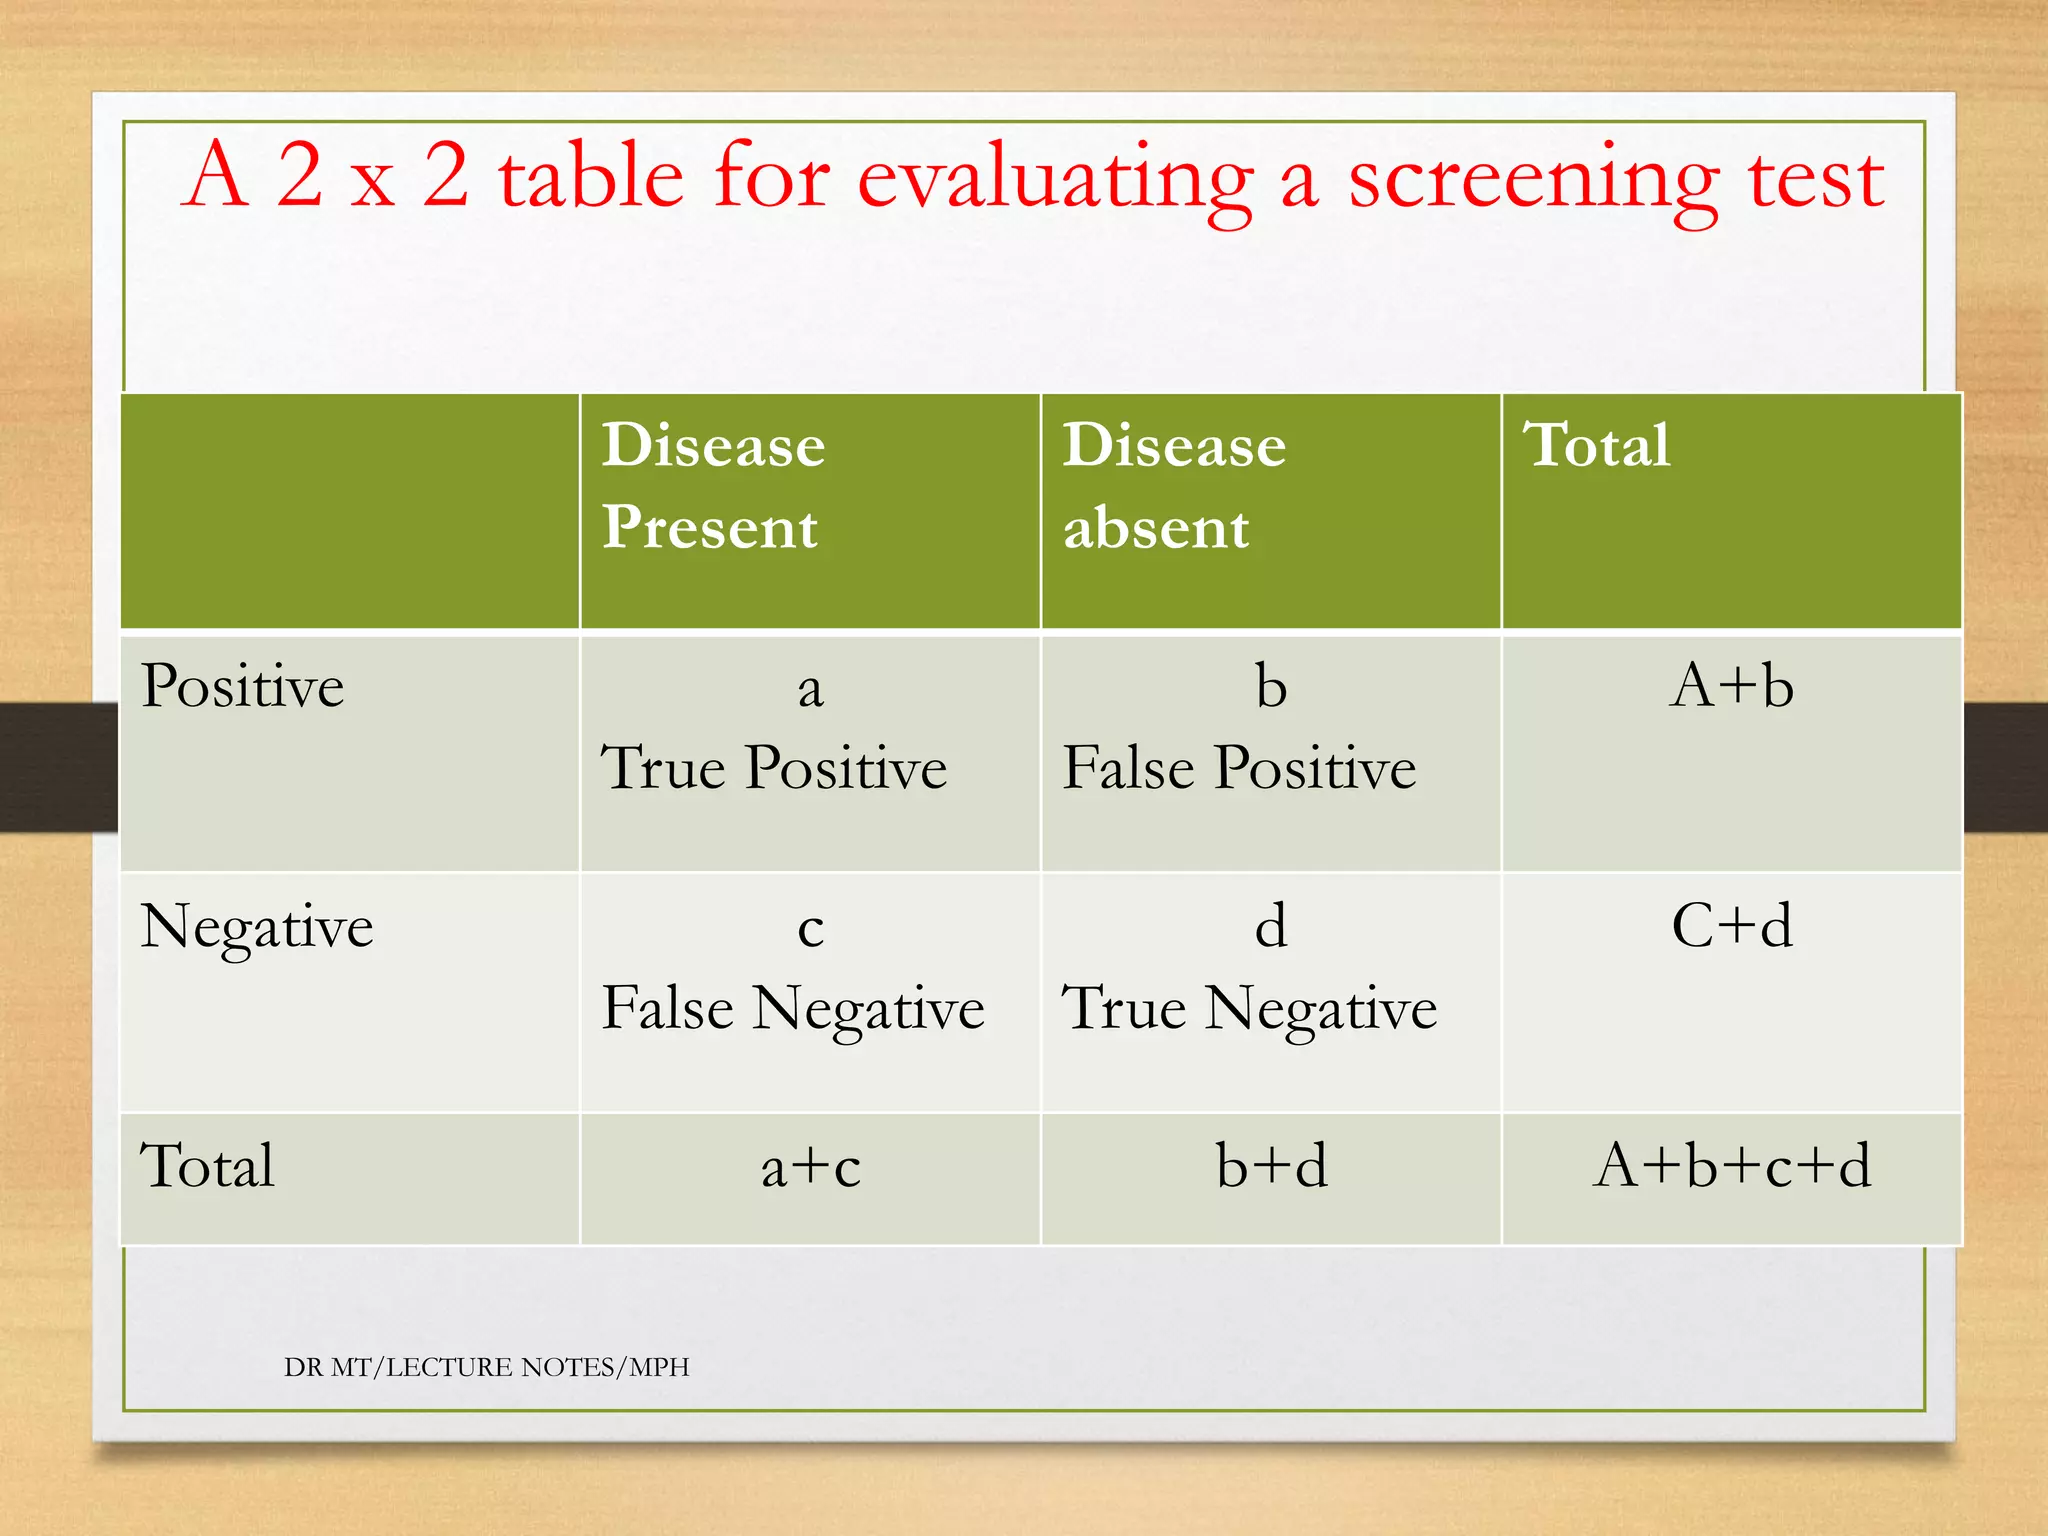
Screening tests
Dr Mathias Tumwebaze PhD
Senior Lecturer. And Consultant
MPH Programs- 2020
DR MT/LECTURE NOTES/MPH
Screening
• Screening is performed in order to identify whether people have
a disease for which they currently have no symptoms
• Screening is not performed to diagnose illness. Instead, it aims to
improve the outcomes of those who are affected, by detecting a
disease before its symptoms have developed.
• screening test should be able to detect disease in the period
between the time when it can be detected using a screening test
and the time when symptoms develop.
DR MT/LECTURE NOTES/MPH
Con’t screening
• In practice, screening tests are never completely accurate
• There will always be a number of false-positive results (in which the
test indicates that a subject has the infection when in reality they
do not).
• False-negative results can also occur (in which the test indicates that
there is no infection present, when in reality the subject does have
the disease)
• good screening test should keep false-positive and false-negative
results to an absolute minimum.
DR MT/LECTURE NOTES/MPH
Screening test
• The screening test itself must be cheap, easy to apply,
acceptable to the public, reliable and valid.
• A test is reliable if it provides consistent results, and
valid if it correctly categorizes people into groups
with and without disease, as measured by its
sensitivity and specificity.
DR MT/LECTURE NOTES/MPH
Evaluating the accuracy of
screening tests
• A screening test can be evaluated using a 2x2 table,
Present in table
• how many subjects with a positive result actually have the
disease (true positive) (cell a)
• how many subjects with a positive result do not have the
disease (false positive) (b)
• how many subjects have a positive result (a + b)
• how many subjects have a negative result (c + d)
DR MT/LECTURE NOTES/MPH
Con’t evaluation
• how many subjects with a negative result actually have the
disease (false negative) (c)
• how many subjects with a negative result do not have the
disease (true negative) (d)
• how many subjects actually have the disease (a + c)
• how many subjects do not have the disease (b + d)
• the total number of subjects (a + b + c + d).
DR MT/LECTURE NOTES/MPH
A 2 x 2 table for evaluating a screening test
Disease
Present
Disease
absent
Total
Positive a
True Positive
b
False Positive
A+b
Negative c
False Negative
d
True Negative
C+d
Total a+c b+d A+b+c+d
DR MT/LECTURE NOTES/MPH
Ways to measure the accuracy of a
screening test.
Sensitivity
• This is the proportion of subjects who really have the
disease, and who have been identified as diseased by the test.
• The formula for calculating sensitivity is a/ (a + c)
DR MT/LECTURE NOTES/MPH
Specificity
• This is the proportion of subjects who really do not have the disease,
and who have been identified as non-diseased by the test.
• The formula for calculating specificity is d/(b + d).
• Sensitivity and specificity both indicate how accurately the test can
detect whether or not a subject has the disease (this is known as the
test's validity}.
DR MT/LECTURE NOTES/MPH
Positive predictive value (PPV)
• This is the probability that a subject with a positive test result
really has the disease.
• The formula for calculating PPV is a/ (a+b)
• Negative predictive value (NPV)
• This is the probability that a subject with a negative test result
really does not have the disease.
• The formula for calculating NPV is d/(c + d}.
DR MT/LECTURE NOTES/MPH
Prevalence
• This is the proportion of diseased subjects in a screened
population (also called the pre-test probability), and it is the
probability of having the disease before the screening test is
performed.
• It can be especially useful when evaluating screening tests for
groups of people who may have different prevalences (e.g.
different genders, age groups or ethnic groups).
• The formula for calculating prevalence in screening is (a+c)/
(a+b+c+d)
DR MT/LECTURE NOTES/MPH
Example
• Suppose that a new screening test has been
developed for diabetic retinopathy. We carry out a
study to find out how effective it is in a population
of 33750 patients with diabetes, all aged over 55
years. Use data to evaluate the test.
DR MT/LECTURE NOTES/MPH
A 2 x 2 table for evaluating a diabetic retinopathy
screening test
Diabetic retinopathy
Disease
Present
Adisease
bsent
Total
Positive (a)
3200
(b)
1400
A+b
4600
Negative (c)
150
(d)
29,000
(C+d)
29150
Total (a+c)
3350
(b+d)
30400
(A+b+c+d)
33750
DR MT/LECTURE NOTES/MPH
• Compute the sensitivity of this test
• Interpret your finding
DR MT/LECTURE NOTES/MPH
Sensitivity
• Sensitivity = a/(a + c)
= 3200/3350 = 0.9552 = 96%.
• This means that 96% of subjects who actually have
diabetic retinopathy will be correctly identified by the
test.
• This result indicates that only 4% of subjects with
diabetic retinopathy will be wrongly identified as
being disease-free.
DR MT/LECTURE NOTES/MPH
Compute specificity of the test,
• What is the specificity of this test.
• What is the interpretation of your finding.
DR MT/LECTURE NOTES/MPH
Specificity
• Specificity = d/(b + d}
= 29000/30400 = 0.9539 = 95%.
• This means that 95% of subjects who do not have
diabetic retinopathy will be correctly identified by the
test. This result indicates that only 5% of subjects
without the disease will be wrongly identified as
having
• diabetic retinopathy.
DR MT/LECTURE NOTES/MPH
Compute the positive predictive
value of this test
• What is the PPV of this test.
• What is the interpretation of this +PPV
DR MT/LECTURE NOTES/MPH
Compute PPV
• Positive predictive value = a/(a + b) =
3200/4600 = 0.6957 = 70%.
• This means that there is a 70% chance that someone
who tests positive does have diabetic retinopathy.
• This is poor, as there is a 30% chance that someone
with a positive test result is actually disease-free.
DR MT/LECTURE NOTES/MPH
Compute the Negative predictive
value
• What is the NPV of this test.
• What is the interpretation of this Negative
predicti?ve value
DR MT/LECTURE NOTES/MPH
Compute the NPV of the test.
• Negative predictive value = d/(c + d)
= 29000/29150 = 0.9949 = 99%.
• This means that there is a 99% chance that someone
who tests negative does not have diabetic retinopathy.
• This is good, as there is only a 1% chance that
someone with a negative test result will actually have
the disease.
DR MT/LECTURE NOTES/MPH
Prevalence
• Prevalence = (a + c)/(a + b + c + d)
= 3350/33 750 = 0.0993 = 10%.
• This means that 10% of the screened population have diabetic
retinopathy.
• We can conclude that although this screening test appears to be
generally
• very good, the disappointing positive predictive value of only
70% would
• limit its overall usefulness.DR MT/LECTURE NOTES/MPH

.Screening tests

  • 1.
    Screening tests Dr MathiasTumwebaze PhD Senior Lecturer. And Consultant MPH Programs- 2020 DR MT/LECTURE NOTES/MPH
  • 2.
    Screening • Screening isperformed in order to identify whether people have a disease for which they currently have no symptoms • Screening is not performed to diagnose illness. Instead, it aims to improve the outcomes of those who are affected, by detecting a disease before its symptoms have developed. • screening test should be able to detect disease in the period between the time when it can be detected using a screening test and the time when symptoms develop. DR MT/LECTURE NOTES/MPH
  • 3.
    Con’t screening • Inpractice, screening tests are never completely accurate • There will always be a number of false-positive results (in which the test indicates that a subject has the infection when in reality they do not). • False-negative results can also occur (in which the test indicates that there is no infection present, when in reality the subject does have the disease) • good screening test should keep false-positive and false-negative results to an absolute minimum. DR MT/LECTURE NOTES/MPH
  • 4.
    Screening test • Thescreening test itself must be cheap, easy to apply, acceptable to the public, reliable and valid. • A test is reliable if it provides consistent results, and valid if it correctly categorizes people into groups with and without disease, as measured by its sensitivity and specificity. DR MT/LECTURE NOTES/MPH
  • 5.
    Evaluating the accuracyof screening tests • A screening test can be evaluated using a 2x2 table, Present in table • how many subjects with a positive result actually have the disease (true positive) (cell a) • how many subjects with a positive result do not have the disease (false positive) (b) • how many subjects have a positive result (a + b) • how many subjects have a negative result (c + d) DR MT/LECTURE NOTES/MPH
  • 6.
    Con’t evaluation • howmany subjects with a negative result actually have the disease (false negative) (c) • how many subjects with a negative result do not have the disease (true negative) (d) • how many subjects actually have the disease (a + c) • how many subjects do not have the disease (b + d) • the total number of subjects (a + b + c + d). DR MT/LECTURE NOTES/MPH
  • 7.
    A 2 x2 table for evaluating a screening test Disease Present Disease absent Total Positive a True Positive b False Positive A+b Negative c False Negative d True Negative C+d Total a+c b+d A+b+c+d DR MT/LECTURE NOTES/MPH
  • 8.
    Ways to measurethe accuracy of a screening test. Sensitivity • This is the proportion of subjects who really have the disease, and who have been identified as diseased by the test. • The formula for calculating sensitivity is a/ (a + c) DR MT/LECTURE NOTES/MPH
  • 9.
    Specificity • This isthe proportion of subjects who really do not have the disease, and who have been identified as non-diseased by the test. • The formula for calculating specificity is d/(b + d). • Sensitivity and specificity both indicate how accurately the test can detect whether or not a subject has the disease (this is known as the test's validity}. DR MT/LECTURE NOTES/MPH
  • 10.
    Positive predictive value(PPV) • This is the probability that a subject with a positive test result really has the disease. • The formula for calculating PPV is a/ (a+b) • Negative predictive value (NPV) • This is the probability that a subject with a negative test result really does not have the disease. • The formula for calculating NPV is d/(c + d}. DR MT/LECTURE NOTES/MPH
  • 11.
    Prevalence • This isthe proportion of diseased subjects in a screened population (also called the pre-test probability), and it is the probability of having the disease before the screening test is performed. • It can be especially useful when evaluating screening tests for groups of people who may have different prevalences (e.g. different genders, age groups or ethnic groups). • The formula for calculating prevalence in screening is (a+c)/ (a+b+c+d) DR MT/LECTURE NOTES/MPH
  • 12.
    Example • Suppose thata new screening test has been developed for diabetic retinopathy. We carry out a study to find out how effective it is in a population of 33750 patients with diabetes, all aged over 55 years. Use data to evaluate the test. DR MT/LECTURE NOTES/MPH
  • 13.
    A 2 x2 table for evaluating a diabetic retinopathy screening test Diabetic retinopathy Disease Present Adisease bsent Total Positive (a) 3200 (b) 1400 A+b 4600 Negative (c) 150 (d) 29,000 (C+d) 29150 Total (a+c) 3350 (b+d) 30400 (A+b+c+d) 33750 DR MT/LECTURE NOTES/MPH
  • 14.
    • Compute thesensitivity of this test • Interpret your finding DR MT/LECTURE NOTES/MPH
  • 15.
    Sensitivity • Sensitivity =a/(a + c) = 3200/3350 = 0.9552 = 96%. • This means that 96% of subjects who actually have diabetic retinopathy will be correctly identified by the test. • This result indicates that only 4% of subjects with diabetic retinopathy will be wrongly identified as being disease-free. DR MT/LECTURE NOTES/MPH
  • 16.
    Compute specificity ofthe test, • What is the specificity of this test. • What is the interpretation of your finding. DR MT/LECTURE NOTES/MPH
  • 17.
    Specificity • Specificity =d/(b + d} = 29000/30400 = 0.9539 = 95%. • This means that 95% of subjects who do not have diabetic retinopathy will be correctly identified by the test. This result indicates that only 5% of subjects without the disease will be wrongly identified as having • diabetic retinopathy. DR MT/LECTURE NOTES/MPH
  • 18.
    Compute the positivepredictive value of this test • What is the PPV of this test. • What is the interpretation of this +PPV DR MT/LECTURE NOTES/MPH
  • 19.
    Compute PPV • Positivepredictive value = a/(a + b) = 3200/4600 = 0.6957 = 70%. • This means that there is a 70% chance that someone who tests positive does have diabetic retinopathy. • This is poor, as there is a 30% chance that someone with a positive test result is actually disease-free. DR MT/LECTURE NOTES/MPH
  • 20.
    Compute the Negativepredictive value • What is the NPV of this test. • What is the interpretation of this Negative predicti?ve value DR MT/LECTURE NOTES/MPH
  • 21.
    Compute the NPVof the test. • Negative predictive value = d/(c + d) = 29000/29150 = 0.9949 = 99%. • This means that there is a 99% chance that someone who tests negative does not have diabetic retinopathy. • This is good, as there is only a 1% chance that someone with a negative test result will actually have the disease. DR MT/LECTURE NOTES/MPH
  • 22.
    Prevalence • Prevalence =(a + c)/(a + b + c + d) = 3350/33 750 = 0.0993 = 10%. • This means that 10% of the screened population have diabetic retinopathy. • We can conclude that although this screening test appears to be generally • very good, the disappointing positive predictive value of only 70% would • limit its overall usefulness.DR MT/LECTURE NOTES/MPH