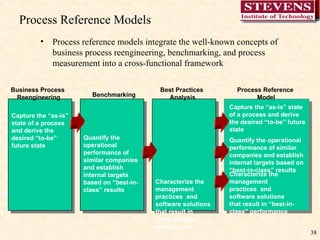
Basics of Supply Chain Management
Definitions
What Is the Supply Chain?  Also referred to as the logistics network Suppliers, manufacturers, warehouses, distribution centers and retail outlets – “facilities” and the Raw materials Work-in-process (WIP) inventory Finished products that flow between the facilities Suppliers Manufacturers Warehouses & Distribution Centers Customers Material Costs Transportation Costs Transportation Costs Transportation Costs Inventory Costs Manufacturing Costs
The Supply Chain Suppliers Manufacturers Warehouses & Distribution Centers Customers Material Costs Transportation Costs Transportation Costs Transportation Costs Inventory Costs Manufacturing Costs
The Supply Chain – Another View Plan Source Make Deliver Buy Suppliers Manufacturers Warehouses & Distribution Centers Customers Material Costs Transportation Costs Transportation Costs Transportation Costs Inventory Costs Manufacturing Costs
What Is Supply Chain Management (SCM)?  A set of approaches used to efficiently integrate Suppliers Manufacturers Warehouses Distribution centers So that the product is produced and distributed In the right quantities To the right locations And at the right time System-wide  costs  are minimized and Service level  requirements are satisfied  Plan Source Make Deliver Buy
History of Supply Chain Management 1960’s - Inventory Management Focus, Cost Control 1970’s - MRP & BOM  - Operations Planning 1980’s - MRPII, JIT - Materials Management, Logistics 1990’s - SCM - ERP - “Integrated” Purchasing, Financials, Manufacturing, Order Entry 2000’s - Optimized “Value Network” with Real-Time Decision Support; Synchronized & Collaborative Extended Network
Why Is SCM Difficult?  Uncertainty is inherent to every supply chain Travel times Breakdowns of machines and vehicles Weather, natural catastrophe, war Local politics, labor conditions, border issues The complexity of the problem to globally optimize a supply chain is significant Minimize internal costs Minimize uncertainty Deal with remaining uncertainty Plan Source Make Deliver Buy
The Importance of Supply Chain Management  Dealing with uncertain environments – matching supply and demand Boeing announced a $2.6 billion write-off in 1997 due to “raw materials shortages, internal and supplier parts shortages and productivity inefficiencies” U.S Surgical Corporation announced a $22 million loss in 1993 due to “larger than anticipated inventories on the shelves of hospitals” IBM sold out its supply of its new Aptiva PC in 1994 costing it millions in potential revenue Hewlett-Packard and Dell found it difficult to obtain important components for its PC’s from Taiwanese suppliers in 1999 due to a massive earthquake U.S. firms spent $898 billion (10% of GDP) on supply-chain related activities in 1998
The Importance of Supply Chain Management  Shorter product life cycles of high-technology products Less opportunity to accumulate historical data on customer demand Wide choice of competing products makes it difficult to predict demand The growth of technologies such as the Internet enable greater collaboration between supply chain trading partners If you don’t do it, your competitor will Major buyers such as Wal-Mart demand a level of “supply chain maturity” of its suppliers Availability of SCM technologies on the market Firms have access to multiple products (e.g., SAP, Baan, Oracle, JD Edwards) with which to integrate  internal  processes
Supply Chain Management and Uncertainty Inventory and back-order levels fluctuate considerably across the supply chain even when customer demand doesn’t vary The variability worsens as we travel “up” the supply chain Forecasting doesn’t help ! Manufacturer Wholesale Distributors Consumers Multi-tier Suppliers Retailers Time Sales Sales Time Sales Time Sales Time Bullwhip Effect
Factors Contributing to the Bullwhip  Demand forecasting practices Min-max inventory management (reorder points to bring inventory up to predicted levels) Lead time Longer lead times lead to greater variability in estimates of average demand, thus increasing variability and safety stock costs Batch ordering Peaks and valleys in orders Fixed ordering costs Impact of transportation costs (e.g., fuel costs) Sales quotas Price fluctuations Promotion and discount policies Lack of centralized information
Today’s Marketplace Requires:  Personalized  content and services for their customers Collaborative   planning with design partners, distributors,  and suppliers Real-time  commitments for design, production, inventory, and transportation capacity Flexible   logistics options to ensure timely fulfillment   Order tracking  & reporting across  multiple vendors and carriers Shared visibility for  trading partners
Supply Chain Management – Key Issues Forecasts are never right Very unlikely that actual demand will exactly equal forecast demand The longer the forecast horizon, the worse the forecast A forecast for a year from now will never be as accurate as a forecast for 3 months from now Aggregate forecasts are more accurate A demand forecast for all CV therapeutics will be more accurate than a forecast for a specific CV-related product Nevertheless, forecasts (or plans, if you prefer) are important management tools when some methods are applied to reduce uncertainty
Supply Chain Management – Key Issues Overcoming functional silos with conflicting goals Purchasing Manufacturing Distribution Customer Service/ Sales Few change- overs Stable schedules Long run lengths High inventories High service levels Regional stocks SOURCE MAKE DELIVER SELL Low pur-chase price Multiple vendors Low invent-ories Low trans-portation
Supply Chain Management – Key Issues Source:  Simchi-Levi ISSUE CONSIDERATIONS Network Planning Warehouse locations and capacities Plant locations and production levels Transportation flows between facilities to minimize cost and time Inventory Control How should inventory be managed? Why does inventory fluctuate and what strategies minimize this? Supply Contracts Impact of volume discount and revenue sharing Pricing strategies to reduce order-shipment variability Distribution Strategies Selection of distribution strategies (e.g., direct ship vs. cross-docking) How many cross-dock points are needed? Cost/Benefits of different strategies Integration and Strategic Partnering How can integration with partners be achieved? What level of integration is best? What information and processes can be shared? What partnerships should be implemented and in which situations? Outsourcing & Procurement Strategies What are our core supply chain capabilities and which are not? Does our product design mandate different outsourcing approaches? Risk management Product Design How are inventory holding and transportation costs affected by product design? How does product design enable mass customization?
Supply Chain Management Operations Strategies Source:  Simchi-Levi STRATEGY WHEN TO CHOOSE BENEFITS Make to Stock standardized products, relatively predictable demand Low manufacturing costs; meet customer demands quickly Make to Order customized products, many variations Customization; reduced inventory; improved service levels Configure to Order many variations on finished product; infrequent demand Low inventory levels; wide range of product offerings; simplified planning Engineer to Order complex products, unique customer specifications Enables response to specific customer requirements
Supply Chain Management – Benefits A 1997 PRTM Integrated Supply Chain Benchmarking Survey of 331 firms found significant benefits to integrating the supply chain Source:  Cohen & Roussel Delivery Performance 16%-28% Improvement Inventory Reduction 25%-60% Improvement Fulfillment Cycle Time 30%-50% Improvement Forecast Accuracy 25%-80% Improvement Overall Productivity 10%-16% Improvement Lower Supply-Chain Costs 25%-50% Improvement Fill Rates 20%-30% Improvement Improved Capacity Realization 10%-20% Improvement
Supply Chain Imperatives for Success View the supply chain as a strategic asset and a differentiator Wal-Mart’s partnership with Proctor & Gamble to automatically replenish inventory Dell’s innovative direct-to-consumer sales and build-to-order manufacturing Create unique supply chain configurations that align with your company’s strategic objectives Operations strategy Outsourcing strategy Channel strategy Customer service strategy Asset network Reduce uncertainty Forecasting Collaboration Integration Supply chain configuration components
Value of Information and SCM
Information In The Supply Chain Each facility further away from actual customer demand must make forecasts of demand Lacking actual customer buying data, each facility bases its forecasts on ‘downstream’ orders, which are more variable than actual demand To accommodate variability, inventory levels are overstocked thus increasing inventory carrying costs Source Make Deliver Sell Suppliers Manufacturers Warehouses & Distribution Centers Retailer It’s estimated that the typical pharmaceutical company supply chain carries over 100 days of product to accommodate uncertainty Plan Order Lead Time Delivery Lead Time Production Lead Time
Taming the Bullwhip Reduce uncertainty in the supply chain Centralize demand information Keep each stage of the supply chain provided with up-to-date customer demand information More frequent planning (continuous real-time planning the goal)  Reduce variability in the supply chain Every-day-low-price strategies for stable demand patterns Reduce lead times Use cross-docking to reduce order lead times Use EDI techniques to reduce information lead times Eliminate the bullwhip through strategic partnerships Vendor-managed inventory (VMI) Collaborative planning, forecasting and replenishment (CPFR) Four critical methods for reducing the Bullwhip effect:
Methods for Improving Forecasts Accurate Forecasts Panels of Experts Internal experts External experts Domain experts Delphi technique Moving average Exponential smoothing Trend analysis Seasonality analysis Judgment Methods Time-Series Methods Causal Analysis Market Research Analysis Relies on data other than  that being predicted Economic data, commodity  data, etc. Market testing Market surveys Focus groups
The Evolving Supply Chain
Supply Chain Integration – Push Strategies Classical manufacturing supply chain strategy Manufacturing forecasts are long-range  Orders from retailers’ warehouses Longer response time to react to marketplace changes  Unable to meet changing demand patterns Supply chain inventory becomes obsolete as demand for certain products disappears Increased variability (Bullwhip effect) leading to: Large inventory safety stocks Larger and more variably sized production batches Unacceptable service levels Inventory obsolescence Inefficient use of production facilities (factories) How is demand determined? Peak? Average?  How is transportation capacity determined? Examples:  Auto industry, large appliances, others?
Supply Chain Integration – Pull Strategies Production and distribution are demand-driven Coordinated with true customer demand None or little inventory held Only in response to specific orders Fast information flow mechanisms POS data Decreased lead times Decreased retailer inventory Decreased variability in the supply chain and especially at manufacturers Decreased manufacturer inventory More efficient use of resources More difficult to take advantage of scale opportunities Examples:  Dell, Amazon
Supply Chain Integration – Push/Pull Strategies Hybrid of “push” and “pull” strategies to overcome disadvantages of each Early stages of product assembly are done in a “push” manner Partial assembly of product based on aggregate demand forecasts (which are more accurate than individual product demand forecasts) Uncertainty is reduced so safety stock inventory is lower Final product assembly is done based on customer demand for specific product configurations Supply chain timeline determines “push-pull boundary” Supply Chain Timeline Raw Materials End Consumer Push Strategy Pull Strategy Push- Pull Boundary “ Generic” Product “ Customized” Product
Choosing Between Push/Pull Strategies Where do the following industries fit in this model: Automobile? Aircraft? Fashion? Petroleum refining? Pharmaceuticals? Biotechnology? Medical Devices? Pull Push Pull Push Economies of Scale Low High Low High Demand Uncertainty Industries where: Customization is High Demand is uncertain Scale economies are Low Computer equipment Industries where: Standard processes are the  norm Demand is stable Scale economies are High Grocery, Beverages Industries where: Uncertainty is low Low economies of scale Push-pull supply chain Books, CD’s Industries where: Demand is uncertain Scale economies are High Low economies of scale Furniture Source:  Simchi-Levi
Characteristics of Push, Pull and Push/Pull Strategies Source:  Simchi-Levi PUSH PULL Objective Minimize Cost Maximize Service Level Complexity High Low Focus Resource Allocation Responsiveness Lead Time Long Short Processes Supply Chain Planning Order Fulfillment
Supply Chain Collaboration – What Is It? Many different definitions depending on perspective The means by which companies within the supply chain work together towards mutual goals by sharing Ideas Information Processes Knowledge Information Risks Rewards Why collaborate? Accelerate entry into new markets Changes the relationship between cost/value/profit equation
Supply Chain Collaboration Cornerstone of effective SCM The focus of many of today’s SCM initiatives The only method that has the potential to eliminate or minimize the Bullwhip effect Manufacturer Distributors/ Wholesalers Suppliers Retailers Collaborative Demand Planning Collaborative Logistics Planning Transportation services Distribution center services Synchronized Production Scheduling Collaborative Product Development Logistics Providers
Benefits of Supply Chain Collaboration Source:  Cohen & Roussel CUSTOMERS MATERIAL SUPPLIERS SERVICE  SUPPLIERS Reduced inventory Increased revenue Lower order management costs Higher Gross Margin Better forecast accuracy Better allocation of promotional budgets Reduced inventory Lower warehousing costs Lower material acquisition costs Fewer stockout conditions Lower freight costs Faster and more reliable delivery Lower capital costs Reduced depreciation Lower fixed costs Improved customer service More efficient use of human resources
Supply Chain Collaboration Spectrum The green arrow describes increasing complexity and sophistication of:  Information systems Systems infrastructure Decision support systems Planning mechanisms Information sharing Process understanding Higher levels of collaboration imply the need for both trading partners to have equivalent (or close) levels of supply chain maturity Synchronized collaboration demands joint planning, R&D and sharing of information and processing models Movement to real-time customer demand information throughout the supply chain  Source:  Cohen & Roussel Number of Relationships Extent of Collaboration Many Few Limited Extensive Transactional Collaboration Synchronized Collaboration Cooperative Collaboration Coordinated Collaboration Not Viable Low Return
Successful Supply Chain Collaboration Try to collaborate internally before you try external collaboration Help your partners to work with you Share the savings Start small (a limited number of selected partners) and stay focused on what you want to achieve in the collaboration Advance your IT capabilities only to the level that you expect your partners to manage Put a comprehensive metrics program in place that allows you to monitor your partners’ performance Make sure people are kept part of the equation Systems do not replace people Make sure your organization is populated with competent professionals who’ve done this before
Emerging Best Practices in SCM Strategy
The SCOR Model
Collaboration and the SCOR Model The Supply-Chain Council (SCC) is a global, not-for-profit trade association open to all types of organizations 800 world-wide members Multi-industry SCC sponsors and supports educational programs including conferences, retreats, benchmarking studies, and development of the Supply-Chain Operations Reference-model (SCOR), the process reference model designed to improve users' efficiency and productivity Promotes research and thought leadership in the supply chain management area Adoption of common standards for reference to process, information and material goods flows is essential to enable trading partner collaboration
Process Reference Models Process reference models integrate the well-known concepts of business process reengineering, benchmarking, and process measurement into a cross-functional framework Quantify the operational performance of similar companies and establish internal targets based on “best-in-class” results Benchmarking Characterize the management practices  and software solutions that result in “best-in-class” performance Best Practices  Analysis Process Reference  Model Capture the “as-is” state of a process and derive the desired “to-be” future state Business Process  Reengineering Capture the “as-is” state of a process and derive the desired “to-be” future state Quantify the operational performance of similar companies and establish internal targets based on “best-in-class” results Characterize the management practices  and software solutions that result in “best-in-class” performance
SCOR Structure Supplier Plan Customer Customer’s Customer Suppliers’ Supplier Make Deliver Source Make Deliver Make Source Deliver Source Deliver Internal or External Internal or External Your Company Source SCOR   Model   Return Return Return Return Return Return Return Return Building Block Approach Processes Metrics Best Practice Technology
Customers Suppliers P1  Plan Supply Chain Plan P2  Plan Source P3  Plan Make P4  Plan Deliver Source Make Deliver S1  Source Stocked Products M1  Make-to-Stock M2  Make-to-Order M3  Engineer-to-Order D1  Deliver Stocked Products D2  Deliver MTO Products D3 Deliver ETO Products S2  Source MTO Products S3  Source ETO Products Return Source P5  Plan Returns Return Deliver Enable D4  Deliver Retail Products SCOR 7.0 Model Structure
SCOR Implementation Roadmap Material Flow SCOR Level 1 Operations Strategy Analyze Basis of Competition SCOR Level 2 Configure supply chain Align Performance  Levels, Practices, and Systems Implement supply chain  Processes and  Systems Competitive Performance Requirements Performance Metrics Supply Chain Scorecard Scorecard Gap Analysis Project Plan AS IS Geographic Map AS IS Thread Diagram Design Specifications TO BE Thread Diagram TO BE Geographic Map Information and Work Flow AS IS Level 2, 3, and 4 Maps Disconnects Design Specifications TO BE Level 2, 3, and 4 Maps Develop, Test, and Roll Out Organization Technology Process People SCOR Level 3
Consumer Foods Project Time (Start to Finish) – 3 months Investment - $50,000  1 st  Year Return - $4,300,000  Electronics Project Time (Start to Finish) – 6 months Investment - $3-5 Million  Projected Return on Investment - $ 230 Million  Software and Planning SAP bases APO key performance indicators (KPIs) on SCOR Model  Aerospace and Defense SCOR Benchmarking and use of SCOR metrics to specify performance criteria and provide basis for contracts / purchase orders Examples of SCOR Adoptions
The SCOR Model As Context for This Course Pharmaceutical sales and marketing activities have their own set of logistics related activities that can be fully described using the SCOR model Supplier Plan Customer Customer’s Customer Suppliers’ Supplier Make Deliver Source Make Deliver Make Source Deliver Source Deliver Internal or External Internal or External Your Company Source Return Return Return Return Return Return Return Return Segment Analysis, Marketing Planning Marketing Data Suppliers Pharmacies, Hospitals, Doctors Marketing and Sales Functions Doctors, Hospitals Patients
The SCOR Model As Context for This Course Two interrelated “supply chains” work together to deliver drugs to market: The Marketing and Sales “supply chain” which is principally information-based The Logistics supply chain which is principally product-based Sales Manufacturing & Distribution Supplier Plan Customer Customer’s Customer Suppliers’ Supplier Make Deliver Source Make Deliver Make Source Deliver Source Deliver Internal or External Internal or External Your Company Source Return Return Return Return Return Return Return Return Supplier Plan Customer Customer’s Customer Suppliers’ Supplier Make Deliver Source Make Deliver Make Source Deliver Source Deliver Internal or External Internal or External Your Company Source Return Return Return Return Return Return Return Return

Scm

  • 1.
    Basics of SupplyChain Management
  • 2.
  • 3.
    What Is theSupply Chain? Also referred to as the logistics network Suppliers, manufacturers, warehouses, distribution centers and retail outlets – “facilities” and the Raw materials Work-in-process (WIP) inventory Finished products that flow between the facilities Suppliers Manufacturers Warehouses & Distribution Centers Customers Material Costs Transportation Costs Transportation Costs Transportation Costs Inventory Costs Manufacturing Costs
  • 4.
    The Supply ChainSuppliers Manufacturers Warehouses & Distribution Centers Customers Material Costs Transportation Costs Transportation Costs Transportation Costs Inventory Costs Manufacturing Costs
  • 5.
    The Supply Chain– Another View Plan Source Make Deliver Buy Suppliers Manufacturers Warehouses & Distribution Centers Customers Material Costs Transportation Costs Transportation Costs Transportation Costs Inventory Costs Manufacturing Costs
  • 6.
    What Is SupplyChain Management (SCM)? A set of approaches used to efficiently integrate Suppliers Manufacturers Warehouses Distribution centers So that the product is produced and distributed In the right quantities To the right locations And at the right time System-wide costs are minimized and Service level requirements are satisfied Plan Source Make Deliver Buy
  • 7.
    History of SupplyChain Management 1960’s - Inventory Management Focus, Cost Control 1970’s - MRP & BOM - Operations Planning 1980’s - MRPII, JIT - Materials Management, Logistics 1990’s - SCM - ERP - “Integrated” Purchasing, Financials, Manufacturing, Order Entry 2000’s - Optimized “Value Network” with Real-Time Decision Support; Synchronized & Collaborative Extended Network
  • 8.
    Why Is SCMDifficult? Uncertainty is inherent to every supply chain Travel times Breakdowns of machines and vehicles Weather, natural catastrophe, war Local politics, labor conditions, border issues The complexity of the problem to globally optimize a supply chain is significant Minimize internal costs Minimize uncertainty Deal with remaining uncertainty Plan Source Make Deliver Buy
  • 9.
    The Importance ofSupply Chain Management Dealing with uncertain environments – matching supply and demand Boeing announced a $2.6 billion write-off in 1997 due to “raw materials shortages, internal and supplier parts shortages and productivity inefficiencies” U.S Surgical Corporation announced a $22 million loss in 1993 due to “larger than anticipated inventories on the shelves of hospitals” IBM sold out its supply of its new Aptiva PC in 1994 costing it millions in potential revenue Hewlett-Packard and Dell found it difficult to obtain important components for its PC’s from Taiwanese suppliers in 1999 due to a massive earthquake U.S. firms spent $898 billion (10% of GDP) on supply-chain related activities in 1998
  • 10.
    The Importance ofSupply Chain Management Shorter product life cycles of high-technology products Less opportunity to accumulate historical data on customer demand Wide choice of competing products makes it difficult to predict demand The growth of technologies such as the Internet enable greater collaboration between supply chain trading partners If you don’t do it, your competitor will Major buyers such as Wal-Mart demand a level of “supply chain maturity” of its suppliers Availability of SCM technologies on the market Firms have access to multiple products (e.g., SAP, Baan, Oracle, JD Edwards) with which to integrate internal processes
  • 11.
    Supply Chain Managementand Uncertainty Inventory and back-order levels fluctuate considerably across the supply chain even when customer demand doesn’t vary The variability worsens as we travel “up” the supply chain Forecasting doesn’t help ! Manufacturer Wholesale Distributors Consumers Multi-tier Suppliers Retailers Time Sales Sales Time Sales Time Sales Time Bullwhip Effect
  • 12.
    Factors Contributing tothe Bullwhip Demand forecasting practices Min-max inventory management (reorder points to bring inventory up to predicted levels) Lead time Longer lead times lead to greater variability in estimates of average demand, thus increasing variability and safety stock costs Batch ordering Peaks and valleys in orders Fixed ordering costs Impact of transportation costs (e.g., fuel costs) Sales quotas Price fluctuations Promotion and discount policies Lack of centralized information
  • 13.
    Today’s Marketplace Requires: Personalized content and services for their customers Collaborative planning with design partners, distributors, and suppliers Real-time commitments for design, production, inventory, and transportation capacity Flexible logistics options to ensure timely fulfillment Order tracking & reporting across multiple vendors and carriers Shared visibility for trading partners
  • 14.
    Supply Chain Management– Key Issues Forecasts are never right Very unlikely that actual demand will exactly equal forecast demand The longer the forecast horizon, the worse the forecast A forecast for a year from now will never be as accurate as a forecast for 3 months from now Aggregate forecasts are more accurate A demand forecast for all CV therapeutics will be more accurate than a forecast for a specific CV-related product Nevertheless, forecasts (or plans, if you prefer) are important management tools when some methods are applied to reduce uncertainty
  • 15.
    Supply Chain Management– Key Issues Overcoming functional silos with conflicting goals Purchasing Manufacturing Distribution Customer Service/ Sales Few change- overs Stable schedules Long run lengths High inventories High service levels Regional stocks SOURCE MAKE DELIVER SELL Low pur-chase price Multiple vendors Low invent-ories Low trans-portation
  • 16.
    Supply Chain Management– Key Issues Source: Simchi-Levi ISSUE CONSIDERATIONS Network Planning Warehouse locations and capacities Plant locations and production levels Transportation flows between facilities to minimize cost and time Inventory Control How should inventory be managed? Why does inventory fluctuate and what strategies minimize this? Supply Contracts Impact of volume discount and revenue sharing Pricing strategies to reduce order-shipment variability Distribution Strategies Selection of distribution strategies (e.g., direct ship vs. cross-docking) How many cross-dock points are needed? Cost/Benefits of different strategies Integration and Strategic Partnering How can integration with partners be achieved? What level of integration is best? What information and processes can be shared? What partnerships should be implemented and in which situations? Outsourcing & Procurement Strategies What are our core supply chain capabilities and which are not? Does our product design mandate different outsourcing approaches? Risk management Product Design How are inventory holding and transportation costs affected by product design? How does product design enable mass customization?
  • 17.
    Supply Chain ManagementOperations Strategies Source: Simchi-Levi STRATEGY WHEN TO CHOOSE BENEFITS Make to Stock standardized products, relatively predictable demand Low manufacturing costs; meet customer demands quickly Make to Order customized products, many variations Customization; reduced inventory; improved service levels Configure to Order many variations on finished product; infrequent demand Low inventory levels; wide range of product offerings; simplified planning Engineer to Order complex products, unique customer specifications Enables response to specific customer requirements
  • 18.
    Supply Chain Management– Benefits A 1997 PRTM Integrated Supply Chain Benchmarking Survey of 331 firms found significant benefits to integrating the supply chain Source: Cohen & Roussel Delivery Performance 16%-28% Improvement Inventory Reduction 25%-60% Improvement Fulfillment Cycle Time 30%-50% Improvement Forecast Accuracy 25%-80% Improvement Overall Productivity 10%-16% Improvement Lower Supply-Chain Costs 25%-50% Improvement Fill Rates 20%-30% Improvement Improved Capacity Realization 10%-20% Improvement
  • 19.
    Supply Chain Imperativesfor Success View the supply chain as a strategic asset and a differentiator Wal-Mart’s partnership with Proctor & Gamble to automatically replenish inventory Dell’s innovative direct-to-consumer sales and build-to-order manufacturing Create unique supply chain configurations that align with your company’s strategic objectives Operations strategy Outsourcing strategy Channel strategy Customer service strategy Asset network Reduce uncertainty Forecasting Collaboration Integration Supply chain configuration components
  • 20.
  • 21.
    Information In TheSupply Chain Each facility further away from actual customer demand must make forecasts of demand Lacking actual customer buying data, each facility bases its forecasts on ‘downstream’ orders, which are more variable than actual demand To accommodate variability, inventory levels are overstocked thus increasing inventory carrying costs Source Make Deliver Sell Suppliers Manufacturers Warehouses & Distribution Centers Retailer It’s estimated that the typical pharmaceutical company supply chain carries over 100 days of product to accommodate uncertainty Plan Order Lead Time Delivery Lead Time Production Lead Time
  • 22.
    Taming the BullwhipReduce uncertainty in the supply chain Centralize demand information Keep each stage of the supply chain provided with up-to-date customer demand information More frequent planning (continuous real-time planning the goal) Reduce variability in the supply chain Every-day-low-price strategies for stable demand patterns Reduce lead times Use cross-docking to reduce order lead times Use EDI techniques to reduce information lead times Eliminate the bullwhip through strategic partnerships Vendor-managed inventory (VMI) Collaborative planning, forecasting and replenishment (CPFR) Four critical methods for reducing the Bullwhip effect:
  • 23.
    Methods for ImprovingForecasts Accurate Forecasts Panels of Experts Internal experts External experts Domain experts Delphi technique Moving average Exponential smoothing Trend analysis Seasonality analysis Judgment Methods Time-Series Methods Causal Analysis Market Research Analysis Relies on data other than that being predicted Economic data, commodity data, etc. Market testing Market surveys Focus groups
  • 24.
  • 25.
    Supply Chain Integration– Push Strategies Classical manufacturing supply chain strategy Manufacturing forecasts are long-range Orders from retailers’ warehouses Longer response time to react to marketplace changes Unable to meet changing demand patterns Supply chain inventory becomes obsolete as demand for certain products disappears Increased variability (Bullwhip effect) leading to: Large inventory safety stocks Larger and more variably sized production batches Unacceptable service levels Inventory obsolescence Inefficient use of production facilities (factories) How is demand determined? Peak? Average? How is transportation capacity determined? Examples: Auto industry, large appliances, others?
  • 26.
    Supply Chain Integration– Pull Strategies Production and distribution are demand-driven Coordinated with true customer demand None or little inventory held Only in response to specific orders Fast information flow mechanisms POS data Decreased lead times Decreased retailer inventory Decreased variability in the supply chain and especially at manufacturers Decreased manufacturer inventory More efficient use of resources More difficult to take advantage of scale opportunities Examples: Dell, Amazon
  • 27.
    Supply Chain Integration– Push/Pull Strategies Hybrid of “push” and “pull” strategies to overcome disadvantages of each Early stages of product assembly are done in a “push” manner Partial assembly of product based on aggregate demand forecasts (which are more accurate than individual product demand forecasts) Uncertainty is reduced so safety stock inventory is lower Final product assembly is done based on customer demand for specific product configurations Supply chain timeline determines “push-pull boundary” Supply Chain Timeline Raw Materials End Consumer Push Strategy Pull Strategy Push- Pull Boundary “ Generic” Product “ Customized” Product
  • 28.
    Choosing Between Push/PullStrategies Where do the following industries fit in this model: Automobile? Aircraft? Fashion? Petroleum refining? Pharmaceuticals? Biotechnology? Medical Devices? Pull Push Pull Push Economies of Scale Low High Low High Demand Uncertainty Industries where: Customization is High Demand is uncertain Scale economies are Low Computer equipment Industries where: Standard processes are the norm Demand is stable Scale economies are High Grocery, Beverages Industries where: Uncertainty is low Low economies of scale Push-pull supply chain Books, CD’s Industries where: Demand is uncertain Scale economies are High Low economies of scale Furniture Source: Simchi-Levi
  • 29.
    Characteristics of Push,Pull and Push/Pull Strategies Source: Simchi-Levi PUSH PULL Objective Minimize Cost Maximize Service Level Complexity High Low Focus Resource Allocation Responsiveness Lead Time Long Short Processes Supply Chain Planning Order Fulfillment
  • 30.
    Supply Chain Collaboration– What Is It? Many different definitions depending on perspective The means by which companies within the supply chain work together towards mutual goals by sharing Ideas Information Processes Knowledge Information Risks Rewards Why collaborate? Accelerate entry into new markets Changes the relationship between cost/value/profit equation
  • 31.
    Supply Chain CollaborationCornerstone of effective SCM The focus of many of today’s SCM initiatives The only method that has the potential to eliminate or minimize the Bullwhip effect Manufacturer Distributors/ Wholesalers Suppliers Retailers Collaborative Demand Planning Collaborative Logistics Planning Transportation services Distribution center services Synchronized Production Scheduling Collaborative Product Development Logistics Providers
  • 32.
    Benefits of SupplyChain Collaboration Source: Cohen & Roussel CUSTOMERS MATERIAL SUPPLIERS SERVICE SUPPLIERS Reduced inventory Increased revenue Lower order management costs Higher Gross Margin Better forecast accuracy Better allocation of promotional budgets Reduced inventory Lower warehousing costs Lower material acquisition costs Fewer stockout conditions Lower freight costs Faster and more reliable delivery Lower capital costs Reduced depreciation Lower fixed costs Improved customer service More efficient use of human resources
  • 33.
    Supply Chain CollaborationSpectrum The green arrow describes increasing complexity and sophistication of: Information systems Systems infrastructure Decision support systems Planning mechanisms Information sharing Process understanding Higher levels of collaboration imply the need for both trading partners to have equivalent (or close) levels of supply chain maturity Synchronized collaboration demands joint planning, R&D and sharing of information and processing models Movement to real-time customer demand information throughout the supply chain Source: Cohen & Roussel Number of Relationships Extent of Collaboration Many Few Limited Extensive Transactional Collaboration Synchronized Collaboration Cooperative Collaboration Coordinated Collaboration Not Viable Low Return
  • 34.
    Successful Supply ChainCollaboration Try to collaborate internally before you try external collaboration Help your partners to work with you Share the savings Start small (a limited number of selected partners) and stay focused on what you want to achieve in the collaboration Advance your IT capabilities only to the level that you expect your partners to manage Put a comprehensive metrics program in place that allows you to monitor your partners’ performance Make sure people are kept part of the equation Systems do not replace people Make sure your organization is populated with competent professionals who’ve done this before
  • 35.
    Emerging Best Practicesin SCM Strategy
  • 36.
  • 37.
    Collaboration and theSCOR Model The Supply-Chain Council (SCC) is a global, not-for-profit trade association open to all types of organizations 800 world-wide members Multi-industry SCC sponsors and supports educational programs including conferences, retreats, benchmarking studies, and development of the Supply-Chain Operations Reference-model (SCOR), the process reference model designed to improve users' efficiency and productivity Promotes research and thought leadership in the supply chain management area Adoption of common standards for reference to process, information and material goods flows is essential to enable trading partner collaboration
  • 38.
    Process Reference ModelsProcess reference models integrate the well-known concepts of business process reengineering, benchmarking, and process measurement into a cross-functional framework Quantify the operational performance of similar companies and establish internal targets based on “best-in-class” results Benchmarking Characterize the management practices and software solutions that result in “best-in-class” performance Best Practices Analysis Process Reference Model Capture the “as-is” state of a process and derive the desired “to-be” future state Business Process Reengineering Capture the “as-is” state of a process and derive the desired “to-be” future state Quantify the operational performance of similar companies and establish internal targets based on “best-in-class” results Characterize the management practices and software solutions that result in “best-in-class” performance
  • 39.
    SCOR Structure SupplierPlan Customer Customer’s Customer Suppliers’ Supplier Make Deliver Source Make Deliver Make Source Deliver Source Deliver Internal or External Internal or External Your Company Source SCOR Model Return Return Return Return Return Return Return Return Building Block Approach Processes Metrics Best Practice Technology
  • 40.
    Customers Suppliers P1 Plan Supply Chain Plan P2 Plan Source P3 Plan Make P4 Plan Deliver Source Make Deliver S1 Source Stocked Products M1 Make-to-Stock M2 Make-to-Order M3 Engineer-to-Order D1 Deliver Stocked Products D2 Deliver MTO Products D3 Deliver ETO Products S2 Source MTO Products S3 Source ETO Products Return Source P5 Plan Returns Return Deliver Enable D4 Deliver Retail Products SCOR 7.0 Model Structure
  • 41.
    SCOR Implementation RoadmapMaterial Flow SCOR Level 1 Operations Strategy Analyze Basis of Competition SCOR Level 2 Configure supply chain Align Performance Levels, Practices, and Systems Implement supply chain Processes and Systems Competitive Performance Requirements Performance Metrics Supply Chain Scorecard Scorecard Gap Analysis Project Plan AS IS Geographic Map AS IS Thread Diagram Design Specifications TO BE Thread Diagram TO BE Geographic Map Information and Work Flow AS IS Level 2, 3, and 4 Maps Disconnects Design Specifications TO BE Level 2, 3, and 4 Maps Develop, Test, and Roll Out Organization Technology Process People SCOR Level 3
  • 42.
    Consumer Foods ProjectTime (Start to Finish) – 3 months Investment - $50,000 1 st Year Return - $4,300,000 Electronics Project Time (Start to Finish) – 6 months Investment - $3-5 Million Projected Return on Investment - $ 230 Million Software and Planning SAP bases APO key performance indicators (KPIs) on SCOR Model Aerospace and Defense SCOR Benchmarking and use of SCOR metrics to specify performance criteria and provide basis for contracts / purchase orders Examples of SCOR Adoptions
  • 43.
    The SCOR ModelAs Context for This Course Pharmaceutical sales and marketing activities have their own set of logistics related activities that can be fully described using the SCOR model Supplier Plan Customer Customer’s Customer Suppliers’ Supplier Make Deliver Source Make Deliver Make Source Deliver Source Deliver Internal or External Internal or External Your Company Source Return Return Return Return Return Return Return Return Segment Analysis, Marketing Planning Marketing Data Suppliers Pharmacies, Hospitals, Doctors Marketing and Sales Functions Doctors, Hospitals Patients
  • 44.
    The SCOR ModelAs Context for This Course Two interrelated “supply chains” work together to deliver drugs to market: The Marketing and Sales “supply chain” which is principally information-based The Logistics supply chain which is principally product-based Sales Manufacturing & Distribution Supplier Plan Customer Customer’s Customer Suppliers’ Supplier Make Deliver Source Make Deliver Make Source Deliver Source Deliver Internal or External Internal or External Your Company Source Return Return Return Return Return Return Return Return Supplier Plan Customer Customer’s Customer Suppliers’ Supplier Make Deliver Source Make Deliver Make Source Deliver Source Deliver Internal or External Internal or External Your Company Source Return Return Return Return Return Return Return Return

Editor's Notes

  • #2 Dependent on each instructor’s requirements
  • #3 Dependent on each instructor’s requirements
  • #21 Dependent on each instructor’s requirements
  • #25 Dependent on each instructor’s requirements
  • #37 Dependent on each instructor’s requirements
  • #39 34
  • #40 21 4 Building block approach Source connects to supplier Deliver connects to customer Not all companies have make We can model as far up or down the supply chain as we view important (not limited to two tiers) Customers and / or suppliers can be internal or external
  • #42 Point 1 SCOR is applied in 4 steps...Analyze Basis of Competition defines performance needs, Configure Supply Chain maps the high level material flow, Align Performance, Practices, and Systems maps the general transaction flow, and Implement Design organizes the list of projects to improve SC performance. Point2 This should also be drawn on POST IT POSTER and displayed on the wall OR have one drawn up in advance using VISIO.