Downloaded 76 times
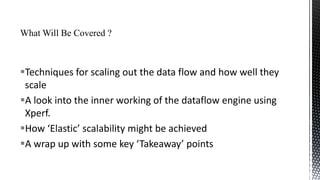
![“WORK PILE”
SSIS “Server Farm”
Package 1
DTEexec . . .
/set Package.variables[MaxThreads].Value;3
/set Package.variables[ThreadNumber].Value;1
SSIS Server 1
Package 2
DTEexec . . .
/set Package.variables[MaxThreads].Value;3
/set Package.variables[ThreadNumber].Value;2
SSIS Server 2
Package N
DTEexec . . .
/set Package.variables[MaxThreads].Value;3
/set Package.variables[ThreadNumber].Value;3
SSIS Server N](https://image.slidesharecdn.com/scalingoutssiswithparallelism-131005053452-phpapp01/85/Scaling-out-SSIS-with-Parallelism-Diving-Deep-Into-The-Dataflow-Engine-34-320.jpg)


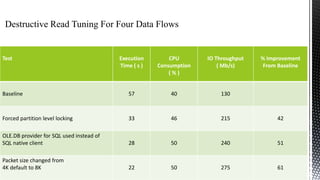
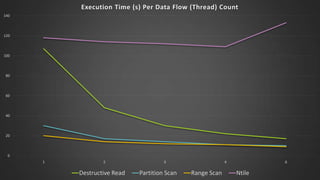
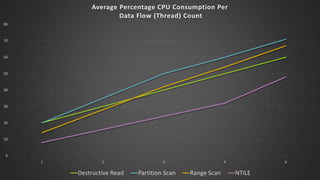
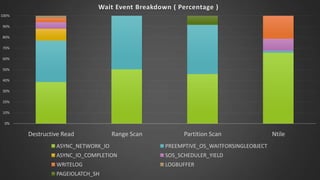
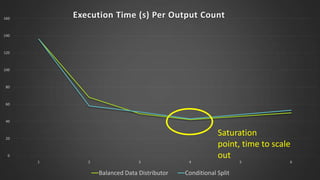
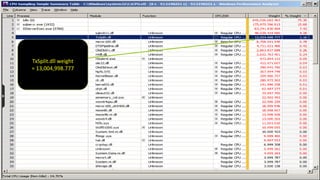
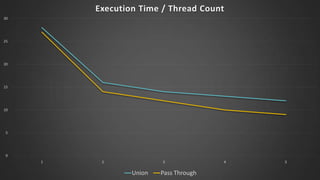
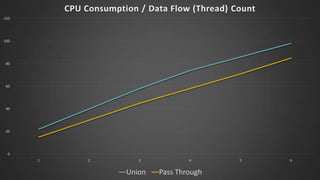
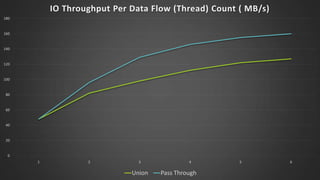
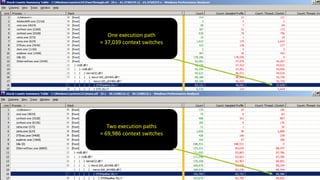
The document discusses advanced SQL Server data flow techniques, highlighting the importance of parallelism, partitioning strategies, and performance tuning to optimize throughput. It outlines various methods for data extraction and scaling, alongside recommendations for configuring SSIS packages and hardware for better resource utilization. Key findings reveal that partitioned data extraction and the balance between synchronous and asynchronous transformations significantly impact CPU consumption and execution time.


![[DBA]_HiramFleitas_SQL_PASS_Summit_2017_Summary](https://cdn.slidesharecdn.com/ss_thumbnails/dbahiramfleitassqlpasssummit2017summary-180202201153-thumbnail.jpg?width=640&height=640&fit=bounds)