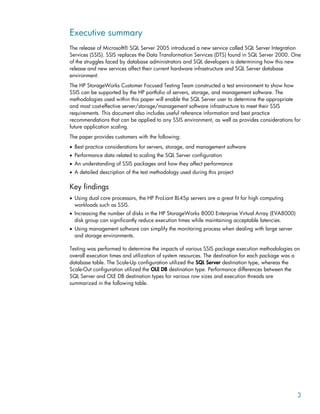
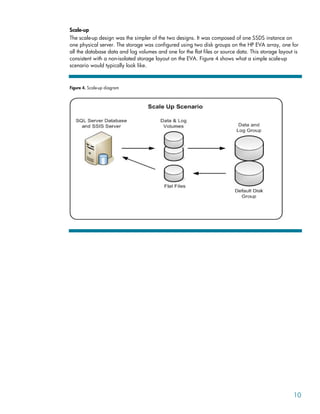
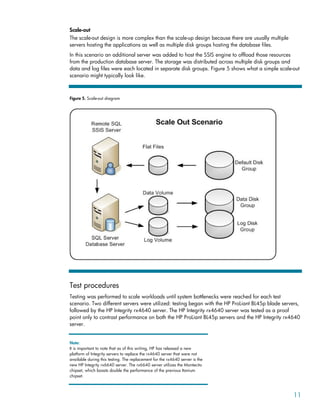
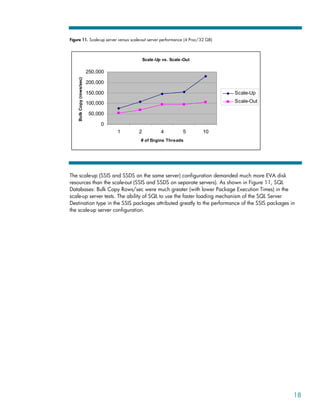
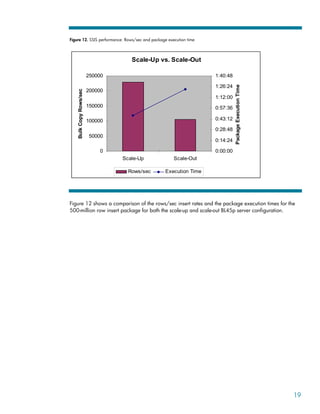
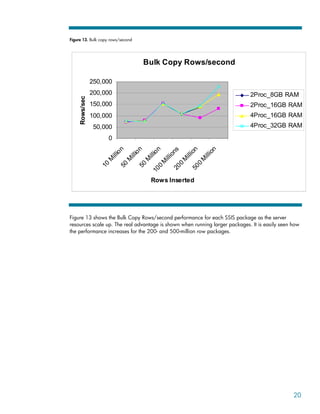
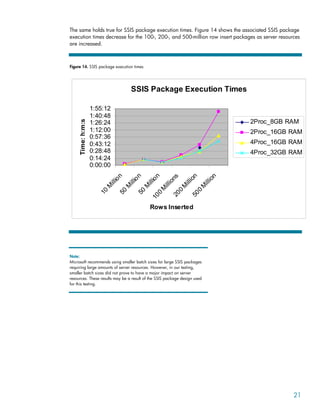
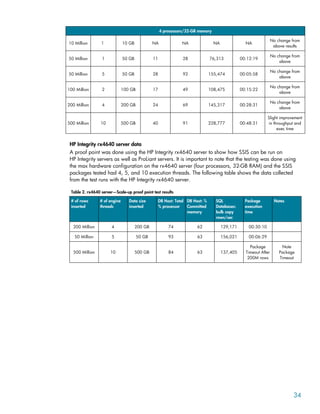
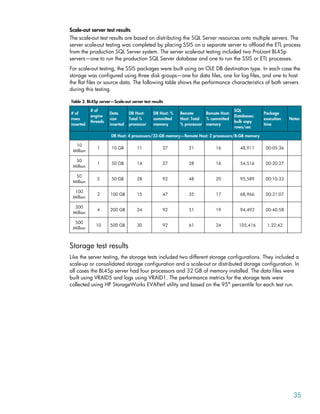
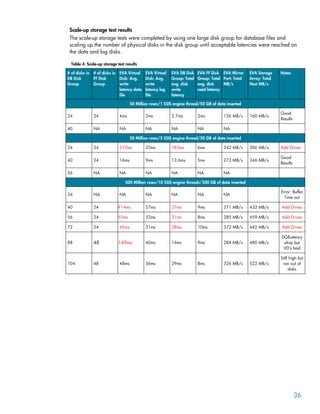
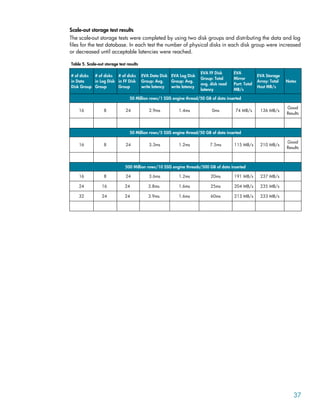
Best practices for Microsoft SQL Server 2005 Databases
with HP Servers and Storage—Business Intelligence, SSIS
Executive summary............................................................................................................................... 3
Key findings .................................................................................................................................... 3
SSIS destination types ................................................................................................................... 4
Parallelism................................................................................................................................... 4
Scale-Up versus Scale-Out ............................................................................................................. 4
Introduction......................................................................................................................................... 4
Project objectives ............................................................................................................................. 5
Key factors for SSIS performance ....................................................................................................... 5
The SSIS package ............................................................................................................................ 5
Source and destination types ......................................................................................................... 5
Data transformations..................................................................................................................... 5
Parallel threads versus single threads .............................................................................................. 6
Configuration and test procedures ......................................................................................................... 7
Configuration .................................................................................................................................. 7
Servers........................................................................................................................................ 7
Storage arrays ............................................................................................................................. 8
Storage area network (SAN) and network infrastructure.................................................................... 8
Management software .................................................................................................................. 8
Server and storage layout ................................................................................................................. 9
Scale-up .................................................................................................................................... 10
Scale-out ................................................................................................................................... 11
Test procedures.............................................................................................................................. 11
SQL Server Integration Services, SSIS-ETL test process..................................................................... 12
Test results ........................................................................................................................................ 12
Server findings............................................................................................................................... 12
Storage findings ............................................................................................................................ 22
Management software.................................................................................................................... 24
Best practices .................................................................................................................................... 29
Best practices for SQL Database administrators ................................................................................. 29
Best practices for server administrators ............................................................................................. 30
Best practices for storage administrators ........................................................................................... 30
Conclusions ...................................................................................................................................... 30
Server configuration conclusions ...................................................................................................... 30
Storage configuration conclusions.................................................................................................... 31
Appendix A—Detailed test results........................................................................................................ 32
Flat file construction and load sizes .................................................................................................. 32
Server test results............................................................................................................................ 32
Scale-up server test results ........................................................................................................... 32
HP Integrity rx4640 server data .................................................................................................. 34
Scale-out server test results........................................................................................................... 35
Storage test results ......................................................................................................................... 35
Scale-up storage test results ......................................................................................................... 36
Scale-out storage test results......................................................................................................... 37
Appendix B—Performance counters and metrics.................................................................................... 38
Appendix C—Acronyms and definitions ............................................................................................... 40
Appendix D—BOM and software revisions........................................................................................... 40
For more information.......................................................................................................................... 42
HP................................................................................................................................................ 42
Microsoft SQL Server Resources....................................................................................................... 42
HP Customer Focused Testing .......................................................................................................... 42
Executive summary
The release of Microsoft® SQL Server 2005 introduced a new service called SQL Server Integration
Services (SSIS). SSIS replaces the Data Transformation Services (DTS) found in SQL Server 2000. One
of the struggles faced by database administrators and SQL developers is determining how this new
release and new services affect their current hardware infrastructure and SQL Server database
environment.
The HP StorageWorks Customer Focused Testing Team constructed a test environment to show how
SSIS can be supported by the HP portfolio of servers, storage, and management software. The
methodologies used within this paper will enable the SQL Server user to determine the appropriate
and most cost-effective server/storage/management software infrastructure to meet their SSIS
requirements. This document also includes useful reference information and best practice
recommendations that can be applied to any SSIS environment, as well as provides considerations for
future application scaling.
The paper provides customers with the following:
• Best practice considerations for servers, storage, and management software
• Performance data related to scaling the SQL Server configuration
• An understanding of SSIS packages and how they affect performance
• A detailed description of the test methodology used during this project
Key findings
• Using dual core processors, the HP ProLiant BL45p servers are a great fit for high computing
workloads such as SSIS.
• Increasing the number of disks in the HP StorageWorks 8000 Enterprise Virtual Array (EVA8000)
disk group can significantly reduce execution times while maintaining acceptable latencies.
• Using management software can simplify the monitoring process when dealing with large server
and storage environments.
Testing was performed to determine the impacts of various SSIS package execution methodologies on
overall execution times and utilization of system resources. The destination for each package was a
database table. The Scale-Up configuration utilized the SQL Server destination type, whereas the
Scale-Out configuration utilized the OLE DB destination type. Performance differences between the
SQL Server and OLE DB destination types for various row sizes and execution threads are
summarized in the following table.
3
Table 1. Package execution times for various parallel execution threads
Rows Inserted
(millions)
Data Size (GB) Package
Execution
Threads
Scale-Up
(Rows/sec)
Scale-Up
Package
Execution Time
(h:m:s)
Scale-Out
(Rows/sec)
Scale-Out
Package
Execution Time
(h:m:s)
10 10 1 75,734 00:02:27 48,911 00:05:36
50 50 1 76,313 00:12:19 54,516 00:20:27
50 50 5 155,474 00:05:58 95,589 00:10:33
100 100 2 108,475 00:15:22 68,966 00:31:07
200 200 4 145,317 00:28:31 94,493 00:40:58
500 500 10 228,777 00:48:31 105,416 1:22:42
SSIS destination types
• On average SSIS packages ran 2x faster using the SSIS SQL Server destination object type in the
Scale-Up configuration versus the SSIS OLE DB destination object type in the Scale-Out
configuration.
• Utilizing the SSIS SQL Server destination object type put the most stress on server and storage
system resources.
Parallelism
• It was found that the number of internal or external parallel execution threads directly impacts
server memory utilization.
• Performance of Bulk Copy Rows/second was 50% greater when running parallel operations for the
same amount of data.
Scale-Up versus Scale-Out
• Scaling up the configuration proved to have the most performance advantage because of the ability
to use the faster loading mechanism of the SSIS SQL Server destination object type.
• Scaling out the configuration does not support the SSIS SQL Server destination object and only
utilizes the SSIS OLE DB destination object type. The Scale-Out configuration had less performance
benefit but put less stress on server and storage system resources.
Introduction
With the introduction of Integration Services in SQL Server 2005, administrators are now faced with
the challenge of determining how the new ETL (replacing DTS in SQL Server 2000) process fits into
their current SQL Server environments. However, it is helpful that SQL Server 2005 Integration
Services, or SSIS, comes bundled with some intelligent applications to help understand and deploy
SSIS packages and simplify the bulk load and update processes.
4
Project objectives
• Describe best practice considerations for configuration of servers, storage, and software
• Review performance data related to scaling the configuration
• Understand SSIS packages and how objects affect performance
• Develop best practices for SSIS package design and object usage
• Provide a detailed test description and SQL Server environment that can be emulated
Key factors for SSIS performance
• Understanding the SSIS package
– Destination types
– Data transformations
– Parallelism
• Server and storage layout
– How can server and storage configurations affect performance of SSIS packages?
The SSIS package
The SQL Server Business Intelligence Development Studio (SSBIDS) is a new addition to the SQL
Server 2005 portfolio and is installed automatically when Integration Services or Analysis Services is
installed on a system. This document explains some of the different SSIS objects in SSBIDS and how
they can affect performance and system resource utilization during an SSIS jobs.
Source and destination types
The source and destination of an SSIS package can play a major role in how the SSIS environment
performs. The location of the SSIS installation can also determine what type of destination to use.
There are many options when choosing SSIS destination objects. In this document only the SQL Server
and OLE DB destination objects will be used.
Microsoft recommends using the SQL Server destination type when running SSIS on the same system
as the SQL Server Database Services (SSDS). The reason for this is that when SSIS and SSDS are
installed on the same system, SSIS can take advantage of the faster loading mechanisms of the SQL
Server destination type.
In our testing the source objects were flat files. The flat files used were created using a specific
number of rows and column widths and were in string format.
Data transformations
Transformation types can dramatically change the performance of an SSIS package. Data
transformations consume buffer resources or server memory. The SSIS engine uses in-memory
processing to manipulate data as it is transferred from source to destination. We classify
transformation types in three categories: synchronous, asynchronous, and blocking.
Synchronous transformations are commonly called row transformations. Row transformations reuse
existing buffers and do not require new buffers to complete the data transformation. They include
Derived Column, Data Conversion, Multicast, and Lookup functions.
Asynchronous transformations are commonly called partially blocking transformations and are used to
combine datasets. In most cases the number of input records will not equal the number of output
records and because of this the output of the transformation is copied into a new buffer. Examples of
partially blocking transformations are Merge, Merge Join, and Union All functions.
5
Blocking transformations perform the most work and therefore can consume the greatest amount of
resources. Similar to asynchronous transformations, blocking transformations create a new buffer for
the transformation output but in addition to this they also create a new thread into the data flow. The
two main blocking transformations are the Aggregate and Sort functions.
Parallel threads versus single threads
In most cases there will be multiple sources from which data is to be pulled from and distributed to.
Within SSIS and the ETL process there are a number of different ways in which you can construct this
process. How you decide to construct this process can have major impacts on system resource
utilization and the overall SSIS package execution times.
For this document we looked at the different ways to run parallel processes and show how they can
benefit as well as burden your environment. The following images show examples of SSIS packages,
Figure 1 is running a single engine thread and Figure 2 is running multiple or parallel internal engine
threads.
Figure 1. Single SSIS engine thread
The preceding example is taking a 50 million row flat file and inserting the rows into a database
table. This example has one engine thread running.
6
Figure 2. Parallel SSIS engine threads
This example is taking the same 50 million rows and distributing them across five flat files with
10 million rows each. In this example there are five engine threads running in parallel.
In each of these cases there is still only one SSIS instance running. Another way to run parallel
operations is to split up the same five flat files into five individual SSIS packages and running them at
the same time. In that case there would be five SSIS instances running. There will be more information
and test results on each of these configurations in the next sections.
Configuration and test procedures
Configuration
The test configuration used for this project encompasses a series of SSIS packages designed to scale
across the most commonly sized configurations for SQL Server 2005 Integration Services and the
Business Intelligence environment.
Servers
Two different server architectures were used to host SQL Server 2005 SSIS and SSDS during testing.
The majority of testing was completed on ProLiant BL45p Blade servers with a proof point comparison
test using the HP Integrity rx4640 server. Test scripts were created to incrementally increase the
workload to show the configuration fit for each server platform. The workloads were designed to push
the resources on each server to their limits.
7
In addition to the server hardware, distributed and consolidated server architectures were tested to
show associated resource requirements for Business Intelligence services.
Using dual core processors, the HP ProLiant BL45p servers are a great fit for high computing
workloads such as SSIS.
SQL Server Application Server Configuration—ProLiant BL45p Blade server
• Hardware configuration
– Up to (4) dual core AMD Opteron 880, 2.4-GHz processors
– Up to 32-GB DDR SDRAM
– Dual port Fibre Channel (FC) HBA
• Software configuration
– Windows® Server 2003 R2 x64 EE
– SQL Server 2005 x64 EE, SP1
– HP MPIO Full Feature Failover for EVA8000
SQL Server Application Server Configuration—HP Integrity rx4640 server (Scale-Up Proof point test
only)
• Hardware configuration
– Up to (4) single core Itanium® 2, 1.6-GHz processors
– 32-GB PC2100 DDR SDRAM
– PCIx 2 Channel FC HBA
• Software configuration
– Windows Server 2003 ia64 EE w/SP1
– SQL Server 2005 ia64 EE
– HP MPIO Full Feature Failover for EVA8000
Additional servers were added to support the distributed server architecture and client access testing
as needed as well as to hose the HP StorageWorks Command View EVA management software and
Windows Active Directory applications.
Storage arrays
The storage consisted of an HP StorageWorks EVA8000 with a 2 controller/12 disk shelf design
(2C12D). Each controller had four FC ports connected to a redundant switch fabric. The data was
spread across (168) 146-GB FC drives. Testing was performed on both isolated (separate disk
groups) and non-isolated (one large disk group) storage configurations to show the performance
differences and determine storage best practices. There were no other applications stored on the
EVA8000 other than SQL Server 2005 for this testing.
Storage area network (SAN) and network infrastructure
The SAN infrastructure used redundant 2-Gb switches and I/O was distributed across all possible
array ports by use of preferred paths from the MPIO software. The IP network ran on an internal 1-Gb
subnet and there was no exposure to outside network activity.
Management software
The following software was configured and tested: HP ProLiant Essentials, HP Storage Essentials, and
HP Insight Manager.
8
Figure 3. Configuration diagram
Server and storage layout
The server and storage layout used two types of methodologies, the “scale-up” methodology and the
“scale-out” methodology. The two methodologies were chosen to show the difference in performance
when running SSIS in each design. In each case the test database was placed in the “Bulk Logged”
recovery mode to reduce logging during the loading process. The database data volume was
configured as VRAID5 and the database log volume was configured as VRAID1 on the HP EVA array.
Note:
Microsoft recommends setting the database recovery mode to “Bulk
Logged” only during the loading process and setting the database back to
“Full Logged” mode when the loading process is complete.
9
Scale-up
The scale-up design was the simpler of the two designs. It was composed of one SSDS instance on
one physical server. The storage was configured using two disk groups on the HP EVA array, one for
all the database data and log volumes and one for the flat files or source data. This storage layout is
consistent with a non-isolated storage layout on the EVA. Figure 4 shows what a simple scale-up
scenario would typically look like.
Figure 4. Scale-up diagram
10
Scale-out
The scale-out design is more complex than the scale-up design because there are usually multiple
servers hosting the applications as well as multiple disk groups hosting the database files.
In this scenario an additional server was added to host the SSIS engine to offload those resources
from the production database server. The storage was distributed across multiple disk groups and
data and log files were each located in separate disk groups. Figure 5 shows what a simple scale-out
scenario might typically look like.
Figure 5. Scale-out diagram
Test procedures
Testing was performed to scale workloads until system bottlenecks were reached for each test
scenario. Two different servers were utilized: testing began with the HP ProLiant BL45p blade servers,
followed by the HP Integrity rx4640 server. The HP Integrity rx4640 server was tested as a proof
point only to contrast performance on both the HP ProLiant BL45p servers and the HP Integrity rx4640
server.
Note:
It is important to note that as of this writing, HP has released a new
platform of Integrity servers to replace the rx4640 server that were not
available during this testing. The replacement for the rx4640 server is the
new HP Integrity rx6640 server. The rx6640 server utilizes the Montecito
chipset, which boasts double the performance of the previous Itanium
chipset.
11
SQL Server Integration Services, SSIS-ETL test process
• Flat files were created using SQLedit DTM Generator software.
• Flat files consist of text files, tab delimited using string variables.
• Load, Insert, and Update tests used flat files for single column tables with 10 million, 50 million,
100 million, and 500 million rows.
• Scale-up tests show how SSIS can scale up by building up the configuration using additional server
resources (processors and memory) and storage resources (physical disks).
• Scale-out tests show how SSIS can scale out by building out the configuration using multiple servers
and disk groups.
• All tests used VRAID5 for the database data files and VRAID1 for the database log files. All source
data was hosted on VRAID5 volumes.
• All tests compare TempDB on local storage to SAN storage.
Test results
The test results on the next few pages describe the key findings. Detailed test metrics are shown in
Appendix A–Detailed test results.
The following outline will be used to order the test results.
• Server findings
• Storage findings
• Management software
• Best practices
Server findings
First, it is important to understand the database recovery model and how it affects bulk loading
operations to the database. The database recovery model is a way to change how a database logs
transactions. During bulk load operations SQL Server is writing large amounts of data to the database
which in turn creates significant activity on the log files. Changing the database recovery model can
therefore have tremendous effects on performance. For more information on database recovery
models, see the For more information section.
Setting the database recovery model to Bulk-Logged has a large impact on server as well as storage
resources. Figure 6 shows the disk write latencies as seen by the database server for the bulk-logged
and full-logged recovery modes.
12
Figure 6. Disk write latencies
Full-Logged
Recovery Mode
Bulk-Logged
Recovery Mode
For the full recovery mode, latencies can reach as high as 20 ms, which is the suggested limit for SQL
Server. The latencies of the volumes rise as the log flushes the data onto the database data volumes.
In contrast, when the database recovery mode is set to Bulk-Logged, the latencies of the volumes stay
below a constant 4 ms as there is no major flushing of the log file to the database data files. The
source data is sent directly to the data files with minimal logging.
The same holds true on the EVA array. As the log flushes data to the database data files the EVA
controller mirror port sees this activity and can become nearly saturated. This could have major
impacts on other array activity. By setting the database recovery model to Bulk-Logged the activity
over the EVA controller mirror port is held constant and at half the rate of that for the log flushing
activity. Figure 7 shows the improvement on the EVA array mirror port utilization by changing the
database recovery mode to Bulk-Logged mode.
13
Figure 7. EVA controller mirror port throughput
Full-Logged
Recovery Mode
Bulk-Logged
Recovery Mode
The rest of this section describes the major server findings for both the scale-up and scale-out test
results. The constants for both test configurations are as follows:
• Test database is set to the Bulk-Logged recovery model.
• Test database data files are built on VRAID5 EVA virtual disks.
• Test database log files are built on VRAID1 EVA virtual disks.
The first area we will look at is memory. What impacts memory utilization when running SSIS
packages? From testing it was found that the two major impacts on server memory utilization are the
number of internal SSIS processes, or execution threads, and the number of actual SSIS instances
running.
Tests were run using SSIS packages with internal parallel operations as well as single operations. The
packages with single operations were then run externally in parallel to see the impact on server
resources.
14
Figure 8 shows the server memory utilization for a given number of internal SSIS engine threads
running in parallel. The legend lists the server configuration by number of processors and amount of
memory installed.
Figure 8. SSIS internal engine threads: % memory utilization
SSIS: % Memory Utilization Per Thread
0
10
20
30
40
50
60
70
80
90
100
1 2 3 4 5 10
SSIS Package: Internal Execution Threads
%
Memory
Utilization
2Proc_8GB RAM
2Proc_16GB RAM
4Proc_16GB RAM
4Proc_32GB RAM
Figure 8 clearly shows that the number of internal SSIS execution threads directly impacts the amount
of memory that SQL Server will use. Note that as the number of execution threads increased, so did
the average bulk copy rate (rows/second). The ProLiant BL45p processor and memory configurations
are shown in the legend to the right of the graph. These BL45p server resources were increased
incrementally to present additional resources to the SQL Server database server.
A similar memory test was performed using individual SSIS packages to show the performance
differences that internal versus external SSIS processes can have. The tests compared the BL45p server
with the max configuration of four processors and 32 GB of SDRAM. Figure 9 shows that there is a
significant change in the percent of memory utilization across the server.
15
Figure 9. BL45p server: SSIS internal versus external engine threads
SSIS: Internal vs. External Execution Threads
0
10
20
30
40
50
60
70
80
90
100
1 2 3 4 5 10
Engine Threads
%
Memory
Utilization
Internal
External
The graph in Figure 9 shows a distinct increase in memory utilization as internal SSIS threads are
introduced. Compared to the external SSIS engine threads, the memory utilization leveled off around
50%.
16
It was found that SSIS execution threads impacted the processor resources as well. Although the effect
was not as demanding as the memory utilization, Figure 10 shows that there was some variance.
Figure 10. SSIS: Processor utilization per engine thread
SSIS: Processor Utilization per Thread
0
10
20
30
40
50
60
70
1 2 4 5 10
Internal Engine Threads
%
Processor
Utilization
2Proc_8GB RAM
2Proc_16GB RAM
4Proc_16GB RAM
4Proc_32GB RAM
The processor utilization plots in Figure 10 show how the dual-core processors on the ProLiant BL45p
server scale as execution threads are added internally to the SSIS packages. The workload never
pushed the processor to its limit even at the smallest server configuration (memory/processor).
17
Figure 11. Scale-up server versus scale-out server performance (4 Proc/32 GB)
Scale-Up vs. Scale-Out
0
50,000
100,000
150,000
200,000
250,000
1 2 4 5 10
# of Engine Threads
Bulk
Copy
(rows/sec)
Scale-Up
Scale-Out
The scale-up (SSIS and SSDS on the same server) configuration demanded much more EVA disk
resources than the scale-out (SSIS and SSDS on separate servers). As shown in Figure 11, SQL
Databases: Bulk Copy Rows/sec were much greater (with lower Package Execution Times) in the
scale-up server tests. The ability of SQL to use the faster loading mechanism of the SQL Server
Destination type in the SSIS packages attributed greatly to the performance of the SSIS packages in
the scale-up server configuration.
18
Figure 12. SSIS performance: Rows/sec and package execution time
Scale-Up vs. Scale-Out
0
50000
100000
150000
200000
250000
Scale-Up Scale-Out
Bulk
Copy
Rows/sec
0:00:00
0:14:24
0:28:48
0:43:12
0:57:36
1:12:00
1:26:24
1:40:48
Package
Execution
Time
Rows/sec Execution Time
Figure 12 shows a comparison of the rows/sec insert rates and the package execution times for the
500-million row insert package for both the scale-up and scale-out BL45p server configuration.
19
Figure 13. Bulk copy rows/second
Bulk Copy Rows/second
0
50,000
100,000
150,000
200,000
250,000
1
0
M
i
l
l
i
o
n
5
0
M
i
l
l
i
o
n
5
0
M
i
l
l
i
o
n
1
0
0
M
i
l
l
i
o
n
s
2
0
0
M
i
l
l
i
o
n
5
0
0
M
i
l
l
i
o
n
Rows Inserted
Rows/sec
2Proc_8GB RAM
2Proc_16GB RAM
4Proc_16GB RAM
4Proc_32GB RAM
Figure 13 shows the Bulk Copy Rows/second performance for each SSIS package as the server
resources scale up. The real advantage is shown when running larger packages. It is easily seen how
the performance increases for the 200- and 500-million row packages.
20
The same holds true for SSIS package execution times. Figure 14 shows the associated SSIS package
execution times decrease for the 100-, 200-, and 500-million row insert packages as server resources
are increased.
Figure 14. SSIS package execution times
SSIS Package Execution Times
0:00:00
0:14:24
0:28:48
0:43:12
0:57:36
1:12:00
1:26:24
1:40:48
1:55:12
1
0
M
i
l
l
i
o
n
5
0
M
i
l
l
i
o
n
5
0
M
i
l
l
i
o
n
1
0
0
M
i
l
l
i
o
n
s
2
0
0
M
i
l
l
i
o
n
5
0
0
M
i
l
l
i
o
n
Rows Inserted
Time:
h:m:s
2Proc_8GB RAM
2Proc_16GB RAM
4Proc_16GB RAM
4Proc_32GB RAM
Note:
Microsoft recommends using smaller batch sizes for large SSIS packages
requiring large amounts of server resources. However, in our testing,
smaller batch sizes did not prove to have a major impact on server
resources. These results may be a result of the SSIS package design used
for this testing.
21
Storage findings
Looking at the storage and comparing the two storage configurations of the database on one disk
group (scale-up) and the database across multiple disk groups (scale-out), it is clear that there was
much greater I/O on the EVA during the single disk group testing. This is likely due to the SSIS
package being used. To clarify, for all scale-out tests, the OLE DB destination type had to be used
because the SQL Server destination type is not supported in a distributed server configuration. Since
the scale-out tests could not take advantage of the fast load mechanism of the SQL Server destination
type, the workload of the ETL system was less than that of the scale-up environment.
Note:
Preferred paths were used on the EVA storage array to separate the read
only activity of the source data and the write only activity of the destination
locations.
Figure 15 shows the throughput (KB/s) across the EVA storage array for both scale-up and scale-out
configurations. The scale-up performance (KB/s) doubles that of the scale-out performance on the EVA
array.
Figure 15. Scale-up versus scale-out: EVA storage array utilization KB/s
Scale-Up
Scale-Out
22
Focusing on a scale-up configuration clearly improves the overall performance, but requires the disk
storage to support high I/O levels. Overall throughput can be further increased (resulting in a direct
decrease in package execution time) by increasing the overall number of threads. However,
increasing the number of threads also places additional I/O burdens on the backend storage.
Figure 16 shows the results of increasing the number of threads on the overall system performance
(measured in write latencies) and the impact of adding additional disks to the storage subsystem to
obtain suitable performance.
With the original configuration of a single thread and 24 disks, the database read and write
latencies were well within the suggested 20-ms threshold for SQL Server. However, this configuration
significantly limited the overall system throughput to just over 160 MB/s. In an effort to increase
throughput, additional threads were added while maintaining the same EVA disk configuration (24
disks). While resulting in a doubling of the throughput (306 MB/s for five threads versus 160 MB/s
for one thread), the additional I/O load on the EVA caused a severe increase in database read and
write latencies. By increasing the number of spindles available to the database LUN (40 disks versus
24 disks), write latencies were significantly reduced to within the targeted 20-ms levels.
Increasing the number of threads again (this time to 10 threads), caused a similar increase in I/O to
the storage array, with the addition of more disks resulting in an associated reduction in latencies
(note the change in virtual disk write latency) while improving overall throughput.
Figure 16. Impact of the number of threads and the number of disks on throughput and latency
Storage Configuration Results
0
10
20
30
40
50
60
70
80
90
100
110
120
1 Thrd /
24 Disks
5 Thrd /
24 Disks
5 Thrd /
40 Disks
10 Thrd /
40 Disks
10 Thrd /
56 Disks
10 Thrd /
72 Disks
10 Thrd /
104 Disks
# of Threads / # of Disks
Latency
(ms)
0
50
100
150
200
250
300
350
400
450
500
550
600
Throughtput
(MB/s)
DB Write
Latency (ms)
DB Read
Latency (ms)
EVA Virtual
Disk Write
Latency (ms)
Total Host
Throughput
(MB/s)
23
Management software
Throughout testing, HP Systems Insight Manager and HP Storage Essentials management software
was used to monitor server and storage system resources. Using management software can simplify
the monitoring process when dealing with large server and storage environments.
HP Systems Insight Manager, HP SIM, is a helpful tool to monitor server resources. HP SIM has the
ability to view actual server resources real time. By using the HP SIM management console, you can
bring up the Diagnostics view for each server in your environment. Figure 17 shows the Insight
Diagnostics view of a server system’s configuration overview.
Figure 17. HP Systems Insight Manager: Server diagnostics view
24
By drilling down deeper you have the ability to check the diagnostics of specific server components.
The following image shows a more detailed view of the memory configuration of a server used during
this testing. Figure 18 shows the memory slot information and the type of memory installed as well as
the total amount of memory in the server and how much memory is available.
Figure 18. Server System Insight diagnostics
25
Another useful tool in the HP management software suite is HP Storage Essentials. Storage Essentials
is bundled with an assortment of useful tools such as Application Viewer, Backup Manager, System
Manager, Capacity Manager, Performance Manager as well as others. Figure 19 is a high-level view
from System Manager.
Figure 19. HP Storage Essentials
26
By a simple right-click, Storage Essentials will pull up a more detailed view of any specific component
in the SAN. Figure 20 shows a detailed view of the topology of part of the SAN used during this
testing. The topology view shows the granularity of the hosts, storage volumes, host bus adapters,
switch port connections, and the rest of the topology for that component (not shown here).
Figure 20. HP Storage Essentials: Topology view
27
HP Storage Essentials also has components that show detailed views of capacity for each element in
the SAN. Figure 21 shows the capacity detail of the EVA8000 used for this testing.
Figure 21. HP Storage Essentials: Capacity Manager
28
HP Storage Essentials Performance Manager can show the performance trends across the storage
array for a period of time determined by the user as in the Figure 22.
Figure 22. HP Storage Essentials: Performance Manager
Management software is there to make things easier for IT professionals to get detailed data quickly
and accurately. HP Systems Insight Manager and HP Storage Essentials are examples of HP software
management products that enable fast, easy management and real-time information of the entire SAN
environment.
Best practices
Best practices for SQL Database administrators
• Before running large bulk load operations, set the database recovery model to Bulk-Logged. Be sure
to reset the recovery model upon completion of SSIS operations.
• Run parallel operations—When possible, run internal parallel SSIS engine threads to decrease
package execution times and run external parallel SSIS engine threads to minimize server
resources.
• When running SSIS packages on local database server, use SQL Server destination types to take
advantage of the fast load option.
29
Best practices for server administrators
• For larger SSIS packages with multiple engine threads, plan on using servers with four processors
and a minimum of 16 GB of memory installed.
• When running SSIS packages on HP ProLiant BL45p servers, plan for higher memory resource
utilization. When running SSIS packages on HP Integrity rx4640 servers, plan for higher processor
resource utilization.
• Use HP Systems Insight Manager software for server diagnostics, driver and firmware management,
and snapshot views of server resource allocations.
Best practices for storage administrators
• Plan for higher storage array utilization when SSIS packages with the SQL Server destination type.
• Use preferred paths to separate read activity of source data and write activity to destinations.
• Use HP Storage Essentials management software for SAN topology, capacity management, and
snapshot views of overall system performance.
Conclusions
SSIS package design and the ability to take advantage of the fast loading mechanism of the SSIS SQL
Server destination object showed the greatest impact on server and storage performance and system
resource.
The scale-up testing took advantage of the SSIS SQL Server destination object and the scale-out testing
utilized the SSIS OLE DB destination object. There proved to be drastic differences in performance
and system resources when testing each SSIS destination type.
Server configuration conclusions
1. The number of SSIS package execution threads had the highest impact on server memory and
processor utilization. The memory utilization tests results were much different when SSIS execution
threads were run internally or externally.
a. Internal SSIS package execution threads consumed up to all server memory
resources.
b. External SSIS package execution threads peaked at 50% memory utilization.
2. Optimal Server Configuration: Four dual-core processors and 16 GB of SDRAM proved to provide
the greatest improvement in package execution times.
a. Processor resource utilization reduced by half compared with tests with two
processors installed.
b. The majority of SSIS package execution times completed in half the time as
compared with tests with two processors installed.
3. Expect higher server resource utilization when using the SSIS SQL Server destination object. It was
clear that the SSIS SQL Server destination object provided much better performance then the SSIS
OLE DB destination object but the cost of systems resources should be accounted for and planned
beforehand.
30
Storage configuration conclusions
1. The SSIS SQL Server destination object proved to have the highest overall impact on both server
and storage resources.
a. SSIS package execution times improved 2x when the SQL Server destination object
was used compared to the OLE DB destination object.
b. The HP EVA array throughput was 50% higher when the SQL Server destination
object was used compared to the OLE DB destination object.
TempDB was examined early in the testing in both the scale-up and scale-out test environments and
was not affected during this testing. TempDB is mostly affected during times of long query activity.
Since the ETL process involves mostly write operations to the database, TempDB is not an issue and
does not need to be accounted for during the ETL process.
TempDB would be affected during operations such as index builds and index rebuilds and should be
accounted for during these operations with SSIS.
When determining to how to use SSIS configurations in your environment, it really narrows down to
two business concerns, performance and system resources.
Business Concern: Better SSIS Package Performance and Execution Times
• Scale-Up
– Use SQL Server destination object
– Use parallel execution threads
– Greatest utilization of server and storage resources
Business Concern: Limited Server and Storage Resources
• Scale-Out
– Use OLE DB destination object
– Use single thread SSIS packages
– Reduced impact on server and storage resources
31
Appendix A—Detailed test results
Testing results based on the following parameters:
• Flat file construction
– 10 million rows, 1 column, 1K byte size, string data type
– 50 million rows, 1 column, 1K byte size, string data type
– 10 million rows, 10 columns, 100 byte size, string data type
• SQL Server Database Settings
– Recovery Model set to “Bulk Logged”
• Database Table Settings
– Column width set to accommodate flat file row size
Flat file construction and load sizes
Flat file name # of rows # of
columns
Column
width
Total row
size
Total flat file
size
Notes
10M10C1K 10 Million 10 100 byte 1K byte 10 GB
10M1C4K 10 Million 1 4K byte 4K byte 40 GB
10M1C1K 10 Million 1 1K byte 1K byte 10 GB
50M1C1K 50 Million 1 1K byte 1K byte 50 GB
10M1C1K_5 50 Million 1 1K byte 1K byte 10 GB 5 engine threads of
10M rows
100M1C1K 100
Million
1 1K byte 1K byte 50 GB 2 engine threads of
50M rows
200M1C1K 200
Million
1 1K byte 1K byte 50 GB 4 engine threads of
50M rows
500M1C1K 500
Million
1 1K byte 1K byte 50 GB 10 engine threads of
50M rows
Server test results
The server testing was completed using the HP ProLiant BL45p Blade server. Two test iterations were
completed using a scale-up server scenario and a scale-out server scenario. All server tests were
completed while the test database was set to “Bulk Logged” recovery. The database data file was
configured VRAID5, and the database log file was configured VRAID1. All performance-related
metrics were collected using Windows Perfmon and based on the 95th
percentile for each test run.
Scale-up server test results
The scale-up test results show the performance results for one server running both SQL Server
Integration Services and Database Services. The storage was configured using two disk groups, one
to host the flat files or source data and one to host the database files. The results are based on the
SSIS packages using the SQL Server destination type.
32
Table 1. BL45p server—Scale-up server test results
# of rows
inserted
# of engine
threads
Data size
inserted
Avg. total %
processor
% committed
memory
Avg. bulk copy
rows/sec
Package
execution time
Notes
2 processors /8-GB memory
10 Million 1 10 GB 29 45 73,337 00:02:33
50 Million 1 50 GB 25 45 79,233 00:11:58
50 Million 5 50 GB 63 88 152,599 00:06:14
Low memory
warnings.
Consuming all
memory resources
100 Million 2 100 GB 41 50 107,213 NA
200 Million 4 200 GB 58 88 138,196 00:35:50
Low memory
warnings.
Consuming all
memory resources
500 Million 10 500 GB NA NA NA NA
Could not run due
to package timeout
2 processors /16-GB memory
10 Million 1 10 GB 26 48 72,075 00:02:29
No change from
above
50 Million 1 50 GB 24 48 78,947 00:12:07
No change from
above
50 Million 5 50 GB 49 92 155,907 00:06:34
Minor change in
processor
100 Million 2 100 GB 37 48 108,582 00:20:51
No change from
above
200 Million 4 200 GB 45 92 89,637 00:41:37
All memory
consumed
500 Million 10 500 GB 64 92 130,516 1:49:05
Completed but
slow. All memory
consumed
4 processors/16-GB memory
10 Million 1 10 GB 11 29 75,734 00:02:27
Server resources cut
in half
50 Million 1 50 GB 12 30 77,871 00:12:07 Proc cut in half
50 Million 5 50 GB 33 90 153,651 00:06:11
No change from
above
100 Million 2 100 GB 17 48 109,499 00:18:04 Proc cut in half
200 Million 4 200 GB 24 67 140,191 00:27:31
Server resources
and exec time cut in
half
500 Million 10 500 GB 35 91 195,042 01:00:59
Cut proc utilize and
exec time in half
33
4 processors/32-GB memory
10 Million 1 10 GB NA NA NA NA
No change from
above results
50 Million 1 50 GB 11 28 76,313 00:12:19
No change from
above
50 Million 5 50 GB 28 92 155,474 00:05:58
No change from
above
100 Million 2 100 GB 17 49 108,475 00:15:22
No change from
above
200 Million 4 200 GB 24 69 145,317 00:28:31
No change from
above
500 Million 10 500 GB 40 91 228,777 00:48:31
Slight improvement
in throughput and
exec time
HP Integrity rx4640 server data
A proof point was done using the HP Integrity rx4640 server to show how SSIS can be run on
HP Integrity servers as well as ProLiant servers. It is important to note that the testing was done using
the max hardware configuration on the rx4640 server (four processors, 32-GB RAM) and the SSIS
packages tested had 4, 5, and 10 execution threads. The following table shows the data collected
from the test runs with the HP Integrity rx4640 server.
Table 2. rx4640 server—Scale-up proof point test results
# of rows
inserted
# of engine
threads
Data size
inserted
DB Host: Total
% processor
DB Host: %
Committed
memory
SQL
Databases:
bulk copy
rows/sec
Package
execution
time
Notes
200 Million 4 200 GB 74 62 129,171 00:30:10
50 Million 5 50 GB 93 63 156,021 00:06:29
500 Million 10 500 GB 84 63 137,405
Package
Timeout After
200M rows
Note
Package
Timeout
34
Scale-out server test results
The scale-out test results are based on distributing the SQL Server resources onto multiple servers. The
server scale-out testing was completed by placing SSIS on a separate server to offload the ETL process
from the production SQL Server system. The server scale-out testing included two ProLiant BL45p
servers—one to run the production SQL Server database and one to run the SSIS or ETL processes.
For scale-out testing, the SSIS packages were built using an OLE DB destination type. In each case the
storage was configured using three disk groups—one for data files, one for log files, and one to host
the flat files or source data. The following table shows the performance characteristics of both servers
during this testing.
Table 3. BL45p server—Scale-out server test results
# of
rows
inserted
# of
engine
threads
Data
size
inserted
DB Host:
Total %
processor
DB Host: %
committed
memory
Remote
Host: Total
% processor
Remote Host:
% committed
memory
SQL
Databases:
bulk copy
rows/sec
Package
execution
time
Notes
DB Host: 4 processors/32-GB memory—Remote Host: 2 processors/8-GB memory
10
Million
1 10 GB 11 27 21 16 48,911 00:05:36
50
Million
1 50 GB 14 27 28 16 54,516 00:20:27
50
Million
5 50 GB 28 92 48 20 95,589 00:10:33
100
Million
2 100 GB 15 47 35 17 68,966 00:31:07
200
Million
4 200 GB 24 92 51 19 94,493 00:40:58
500
Million
10 500 GB 30 92 61 24 105,416 1:22:42
Storage test results
Like the server testing, the storage tests included two different storage configurations. They included a
scale-up or consolidated storage configuration and a scale-out or distributed storage configuration. In
all cases the BL45p server had four processors and 32 GB of memory installed. The data files were
built using VRAID5 and logs using VRAID1. The performance metrics for the storage tests were
collected using HP StorageWorks EVAPerf utility and based on the 95th
percentile for each test run.
35
Scale-up storage test results
The scale-up storage tests were completed by using one large disk group for database files and
scaling up the number of physical disks in the disk group until acceptable latencies were reached on
the data and log disks.
Table 4. Scale-up storage test results
# of disks in
DB Disk
Group
# of disks in
FF Disk
Group
EVA Virtual
Disk: Avg.
write
latency data
file
EVA Virtual
Disk: Avg.
write
latency log
file
EVA DB Disk
Group: Total
avg. disk
write
latency
EVA FF Disk
Group: Total
avg. disk
read latency
EVA Mirror
Port: Total
MB/s
EVA Storage
Array: Total
Host MB/s
Notes
50 Million rows/1 SSIS engine thread/50 GB of data inserted
24 24 4ms 2ms 3.7ms 2ms 126 MB/s 160 MB/s
Good
Results
40 NA NA NA NA NA NA
50 Million rows/5 SSIS engine thread/50 GB of data inserted
24 24 210ms 25ms 183ms 6ms 242 MB/s 306 MB/s Add Drives
40 24 16ms 9ms 13.6ms 5ms 273 MB/s 346 MB/s
Good
Results
56 NA NA NA NA NA NA
500 Million rows/10 SSIS engine threads/500 GB of data inserted
24 NA NA NA NA NA NA
Error: Buffer
Time out
40 24 914ms 27ms 27ms 9ms 371 MB/s 432 MB/s Add Drives
56 24 53ms 32ms 31ms 8ms 385 MB/s 459 MB/s Add Drives
72 24 45ms 31ms 28ms 10ms 372 MB/s 442 MB/s Add Drives
88 48 149ms 40ms 14ms 9ms 284 MB/s 480 MB/s
DGlLatency
okay but
VD’s bad
104 48 48ms 36ms 29ms 8ms 326 MB/s 522 MB/s
Still high but
ran out of
disks
36
Scale-out storage test results
The scale-out storage tests were completed by using two disk groups and distributing the data and log
files for the test database. In each test the number of physical disks in each disk group were increased
or decreased until acceptable latencies were reached.
Table 5. Scale-out storage test results
# of disks
in Data
Disk Group
# of disks
in Log Disk
Group
# of disks
in FF Disk
Group
EVA Data Disk
Group: Avg.
write latency
EVA Log Disk
Group: Avg.
write latency
EVA FF Disk
Group: Total
avg. disk read
latency
EVA
Mirror
Port: Total
MB/s
EVA Storage
Array: Total
Host MB/s
Notes
50 Million rows/1 SSIS engine thread/50 GB of data inserted
16 8 24 2.9ms 1.4ms 0ms 74 MB/s 136 MB/s
Good
Results
50 Million rows/5 SSIS engine thread/50 GB of data inserted
16 8 24 3.3ms 1.2ms 7.5ms 115 MB/s 210 MB/s
Good
Results
500 Million rows/10 SSIS engine threads/500 GB of data inserted
16 8 24 3.6ms 1.2ms 20ms 191 MB/s 237 MB/s
24 16 24 3.8ms 1.6ms 25ms 204 MB/s 235 MB/s
32 24 24 3.9ms 1.6ms 60ms 213 MB/s 233 MB/s
37
Appendix B—Performance counters and metrics
The following performance metrics and counters are the majority of metrics that can determine how
the entire server, storage, and database environment is performing. For this project, only the counters
in BOLD were used to determine how the overall system performed as well as the recorded results in
Appendix A.
• SQL Buffer Manager
– Buffer Cache Hit Ratio > 90%
– Page Reads/sec—want a low value
– Free Buffers—want a consistently high value
– Lazy Writes/sec—want a low value or 0
– Stolen Pages—want a low value
• SQL Cache Manager
– Cache Hit Ratio > 80%
• SQL Databases
– DatabaseInstance: Bulk Copy Rows/sec
• SQL Locks
– Average Wait Time (ms)—steady over time
– Lock Waits/sec
– Number of Deadlocks/sec
• SQL Server Memory Manager
– SQL Cache Memory
– Target Server Memory
– Total Server Memory < 80% Target Server Memory
• SQL Server Statistics
– Batch Requests/sec—high value indicates good throughput
38
39
• SQLServer: Transactions (TempDB Counters)
– Free space in TempDB (KB)
– Version Store Size (KB)—monitor size
– Version Generation Rate (KB/s)
– Version Cleanup Rate (KB/s)—size prediction
– Version Store unit count
– Version Store unit creation
– Version Store unit truncation—high value might suggest TempDB under space stress
– Update Conflict Ratio
– Longest Transaction Running Time
– Transactions
– Snapshot Transactions
– Update Snapshot Transactions
– NonSnapshot Version Transactions—version generation snapshot transactions
• Server
– Processor: %Processor Time
– System: Processor Queue Length < 2
– Memory: % Committed Bytes In Use
• Disk Counters
– Current Disk Queue Length < 2
Example: Current Disk Queue Length on G: is 45 but G: is a storage LUN made up of 28
physical disks so the actual disk queue length is 45/28=1.6
– Disk Reads/sec, Writes/sec
– Disk Bytes/sec; Total, Read, Write, Avg.
– Latency:
o Avg. Disk Sec/Transfer < 0.3 seconds
o PhysicalDisk(drive:) Avg. Disk sec/Read
ƒ Low latency: < 20ms 95th percentile
o PhysicalDisk(drive:) Avg. Disk sec/Write
ƒ Low latency: < 15ms 95th percentile
o Logs: Avg. Disk sec/Writes < 8 ms
40
Appendix C—Acronyms and definitions
• SSIS—SQL Server Integration Services
• SSDS—SQL Server Database Services
• SSBIDS—SQL Server Business Intelligence Development Studio
• DTS—Data Transformation Services, SQL Server 2000
• ETL—Extraction, Transformation, and Load, Replaces DTS in SQL Server 2005
• Internal Execution Thread—Process within a SSIS package
• External Execution Thread—Single running SSIS instance
Appendix D—BOM and software revisions
QTY Part number Description
Storage Array
1 258158-888 CTO/FLAG Storage CTO_FLAG
1 AD522A HP EVA8000 2C12D 60Hz 42U Cabinet
168 364621-B23 HP StorageWorks 146-GB 15K FC HDD
1 T4256C HP EVA4000/6000/8000 5.1 Controller Media Kit
1 T3724C HP Command View EVA v5.0 Media Kit
SAN Infrastructure
2 A7394A HP StorageWorks 4/32 SAN Switch Pwr Pack
64 A7446B HP StorageWorks4gbSW SnglPK SFP Transcvr
SQL Server 2005 Application Servers
1 243564-B22 HP BLp Enhanced Enclosure
2 378926-B21 Cisco BLp Ethernet Switch
2 399598-B21 HP BL25p 2.4-Ghz-1M DC 2G 2P Svr
4 379300-B21 HP 4-GB Reg PC3200 2x2-GB Memory
4 286778-B22 HP 72-GB 15K U320 Pluggable Hard Drive
2 381881-B21 HP BL25/45p Fiber Channel Adapter
Benchmark Factory Load Server
4 399779-001 HP DL580R03 3.00-GHz 4M DC 2P US Svr
32 343057-B21 HP 4-GB REG PC2-3200 2x2GB DDR Memory
8 286778-B22 HP 72-GB 15K U320 Pluggable Hard Drive
4 331903-B21 HP Slim 24X Carbon Combo Drive
8 281541-B21 FCA2214 2-Gb FC HBA for Linux and Windows
8 399889-B21 HP X7040 3.00–4MB/667 570/580 G3 Kit
12 364639-B21 HP DL580R03 Memory Expansion Board
41
Management Server
4 397630-001 HP DL380G4 2.8/800-2M HPM DC US Svr
12 343057-B21 HP 4-GB REG PC2-3200 2x2-GB DDR Memory
8 286778-B22 HP 72-GB 15K U320 Pluggable Hard Drive
4 331903-B21 HP Slim 24X Carbon Combo Drive
8 281541-B21 FCA2214 2-Gb FC HBA for Linux and Windows
Miscellaneous
1 221546-001 TFT5600 RKM, Rack-mounted keyboard/mouse/LCD
2 336045-B21 Console Switch 2x16 KVM, IP-based KVM switch
4 (263474-B22) 6' CAT5e KVM cable 8-pack, KVM connection cable pack
12 (AF100A) Blade System KVM adapter, KVM adapter for blade servers
12 (336047-B21) USB Interface adapter, KVM adapter for ProLiant servers
1 252663-B24 HP 16A High Voltage Modular PDU
3 252663-D74 HP 24A HV Core Only Corded PDU
1 291034-B21 HP 10A IEC320-C14/C19 8ft/2.4m Pwr Cord
2 378284-B21 HP BLp 1U Pwr Encl w/6 Pwr Supply Kit
Software module Build version
Microsoft Windows Server 2003 Enterprise x64 Edition R2
Microsoft Windows Server 2003 Enterprise ia64 Edition SP1
SQL Server 2005 x64 SP1 Build 9.0.2153
SQL Server 2005 ia64 SP1 Build 9.0.2153
SQL Server Business Intelligence Development Studio—
Microsoft Visual Studio 2005
Build 8.0.50727.42
Microsoft SQL Server Integration Services Designer Build 9.00.2047
HP StorageWorks Command View EVA Software Suite Build 6.0.0.44
HP StorageWorks Command View EVA 6.0 Build 6.0.0.193
HP StorageWorks EVA Performance Monitor Build 6.0.0.36
HP MPIO Full Featured DSM for EVA4000/6000/8000 v2.00.02
HP Storage Essentials Enterprise Edition 5.10 Build 5.1.0.226
HP Systems Insight Manager 5.0 with SP5 Build C.05.00.02.00
HP Performance Management Pack v4.1
HP BladeSystem Integrated Manager v2.1
For more information
The following key documents and locations provide a wealth of information regarding successful
deployment of Microsoft SQL Server on HP platforms.
HP
• HP Solutions for Microsoft SQL Server 2005—Always on Technologies
http://h18004.www1.hp.com/products/servers/software/microsoft/sqlserver2005.html?jumpid=reg_R1002
_USEN
• HP Blade System
http://h71028.www7.hp.com/enterprise/cache/80316-0-0-0-121.aspx
• HP StorageWorks Enterprise Virtual Arrays
http://h18006.www1.hp.com/products/storageworks/eva/index.html
• ActiveAnswers on HP.com
http://h71019.www7.hp.com/ActiveAnswers/cache/71108-0-0-225-121.html
• Microsoft SQL Server on HP ActiveAnswers
http://h71019.www7.hp.com/ActiveAnswers/cache/70729-0-0-225-121.html
• HP BladeSystem Solutions for Windows Infrastructure on HP ActiveAnswers
http://h71019.www7.hp.com/ActiveAnswers/cache/251024-0-0-225-121.html
• SQL Server 2005 Integration Services—Improving Performance of Bulk Operations
http://h20000.www2.hp.com/bizsupport/TechSupport/Document.jsp?objectID=c00806483&lang=en&cc=u
s&taskId=101&prodSeriesId=470490&prodTypeId=12169
Microsoft SQL Server Resources
• http://www.microsoft.com/sql/default.mspx
• http://www.microsoft.com/technet/prodtechnol/sql/2005/technologies/ssisperfstrat.mspx
• http://www.microsoft.com/technet/prodtechnol/sql/2005/ssisperf.mspx
HP Customer Focused Testing
• www.hp.com/go/hpcft
The HP Customer Focused Testing team offers pre-tested and fully integrated storage-server-
software solutions that help your business thrive in a constantly changing environment.
© 2007 Hewlett-Packard Development Company, L.P. The information contained
herein is subject to change without notice. The only warranties for HP products and
services are set forth in the express warranty statements accompanying such
products and services. Nothing herein should be construed as constituting an
additional warranty. HP shall not be liable for technical or editorial errors or
omissions contained herein.
Itanium is a trademark or registered trademark of Intel Corporation or its
subsidiaries in the United States and other countries. Microsoft and Windows are
U.S. registered trademarks of Microsoft Corporation.
4AA1-1028ENW, March 2007

Best Practices SQL 2005 SSIS

  • 1.
    Best practices forMicrosoft SQL Server 2005 Databases with HP Servers and Storage—Business Intelligence, SSIS Executive summary............................................................................................................................... 3 Key findings .................................................................................................................................... 3 SSIS destination types ................................................................................................................... 4 Parallelism................................................................................................................................... 4 Scale-Up versus Scale-Out ............................................................................................................. 4 Introduction......................................................................................................................................... 4 Project objectives ............................................................................................................................. 5 Key factors for SSIS performance ....................................................................................................... 5 The SSIS package ............................................................................................................................ 5 Source and destination types ......................................................................................................... 5 Data transformations..................................................................................................................... 5 Parallel threads versus single threads .............................................................................................. 6 Configuration and test procedures ......................................................................................................... 7 Configuration .................................................................................................................................. 7 Servers........................................................................................................................................ 7 Storage arrays ............................................................................................................................. 8 Storage area network (SAN) and network infrastructure.................................................................... 8 Management software .................................................................................................................. 8 Server and storage layout ................................................................................................................. 9 Scale-up .................................................................................................................................... 10 Scale-out ................................................................................................................................... 11 Test procedures.............................................................................................................................. 11 SQL Server Integration Services, SSIS-ETL test process..................................................................... 12 Test results ........................................................................................................................................ 12 Server findings............................................................................................................................... 12 Storage findings ............................................................................................................................ 22 Management software.................................................................................................................... 24 Best practices .................................................................................................................................... 29 Best practices for SQL Database administrators ................................................................................. 29 Best practices for server administrators ............................................................................................. 30 Best practices for storage administrators ........................................................................................... 30 Conclusions ...................................................................................................................................... 30
  • 2.
    Server configuration conclusions...................................................................................................... 30 Storage configuration conclusions.................................................................................................... 31 Appendix A—Detailed test results........................................................................................................ 32 Flat file construction and load sizes .................................................................................................. 32 Server test results............................................................................................................................ 32 Scale-up server test results ........................................................................................................... 32 HP Integrity rx4640 server data .................................................................................................. 34 Scale-out server test results........................................................................................................... 35 Storage test results ......................................................................................................................... 35 Scale-up storage test results ......................................................................................................... 36 Scale-out storage test results......................................................................................................... 37 Appendix B—Performance counters and metrics.................................................................................... 38 Appendix C—Acronyms and definitions ............................................................................................... 40 Appendix D—BOM and software revisions........................................................................................... 40 For more information.......................................................................................................................... 42 HP................................................................................................................................................ 42 Microsoft SQL Server Resources....................................................................................................... 42 HP Customer Focused Testing .......................................................................................................... 42
  • 3.
    Executive summary The releaseof Microsoft® SQL Server 2005 introduced a new service called SQL Server Integration Services (SSIS). SSIS replaces the Data Transformation Services (DTS) found in SQL Server 2000. One of the struggles faced by database administrators and SQL developers is determining how this new release and new services affect their current hardware infrastructure and SQL Server database environment. The HP StorageWorks Customer Focused Testing Team constructed a test environment to show how SSIS can be supported by the HP portfolio of servers, storage, and management software. The methodologies used within this paper will enable the SQL Server user to determine the appropriate and most cost-effective server/storage/management software infrastructure to meet their SSIS requirements. This document also includes useful reference information and best practice recommendations that can be applied to any SSIS environment, as well as provides considerations for future application scaling. The paper provides customers with the following: • Best practice considerations for servers, storage, and management software • Performance data related to scaling the SQL Server configuration • An understanding of SSIS packages and how they affect performance • A detailed description of the test methodology used during this project Key findings • Using dual core processors, the HP ProLiant BL45p servers are a great fit for high computing workloads such as SSIS. • Increasing the number of disks in the HP StorageWorks 8000 Enterprise Virtual Array (EVA8000) disk group can significantly reduce execution times while maintaining acceptable latencies. • Using management software can simplify the monitoring process when dealing with large server and storage environments. Testing was performed to determine the impacts of various SSIS package execution methodologies on overall execution times and utilization of system resources. The destination for each package was a database table. The Scale-Up configuration utilized the SQL Server destination type, whereas the Scale-Out configuration utilized the OLE DB destination type. Performance differences between the SQL Server and OLE DB destination types for various row sizes and execution threads are summarized in the following table. 3
  • 4.
    Table 1. Packageexecution times for various parallel execution threads Rows Inserted (millions) Data Size (GB) Package Execution Threads Scale-Up (Rows/sec) Scale-Up Package Execution Time (h:m:s) Scale-Out (Rows/sec) Scale-Out Package Execution Time (h:m:s) 10 10 1 75,734 00:02:27 48,911 00:05:36 50 50 1 76,313 00:12:19 54,516 00:20:27 50 50 5 155,474 00:05:58 95,589 00:10:33 100 100 2 108,475 00:15:22 68,966 00:31:07 200 200 4 145,317 00:28:31 94,493 00:40:58 500 500 10 228,777 00:48:31 105,416 1:22:42 SSIS destination types • On average SSIS packages ran 2x faster using the SSIS SQL Server destination object type in the Scale-Up configuration versus the SSIS OLE DB destination object type in the Scale-Out configuration. • Utilizing the SSIS SQL Server destination object type put the most stress on server and storage system resources. Parallelism • It was found that the number of internal or external parallel execution threads directly impacts server memory utilization. • Performance of Bulk Copy Rows/second was 50% greater when running parallel operations for the same amount of data. Scale-Up versus Scale-Out • Scaling up the configuration proved to have the most performance advantage because of the ability to use the faster loading mechanism of the SSIS SQL Server destination object type. • Scaling out the configuration does not support the SSIS SQL Server destination object and only utilizes the SSIS OLE DB destination object type. The Scale-Out configuration had less performance benefit but put less stress on server and storage system resources. Introduction With the introduction of Integration Services in SQL Server 2005, administrators are now faced with the challenge of determining how the new ETL (replacing DTS in SQL Server 2000) process fits into their current SQL Server environments. However, it is helpful that SQL Server 2005 Integration Services, or SSIS, comes bundled with some intelligent applications to help understand and deploy SSIS packages and simplify the bulk load and update processes. 4
  • 5.
    Project objectives • Describebest practice considerations for configuration of servers, storage, and software • Review performance data related to scaling the configuration • Understand SSIS packages and how objects affect performance • Develop best practices for SSIS package design and object usage • Provide a detailed test description and SQL Server environment that can be emulated Key factors for SSIS performance • Understanding the SSIS package – Destination types – Data transformations – Parallelism • Server and storage layout – How can server and storage configurations affect performance of SSIS packages? The SSIS package The SQL Server Business Intelligence Development Studio (SSBIDS) is a new addition to the SQL Server 2005 portfolio and is installed automatically when Integration Services or Analysis Services is installed on a system. This document explains some of the different SSIS objects in SSBIDS and how they can affect performance and system resource utilization during an SSIS jobs. Source and destination types The source and destination of an SSIS package can play a major role in how the SSIS environment performs. The location of the SSIS installation can also determine what type of destination to use. There are many options when choosing SSIS destination objects. In this document only the SQL Server and OLE DB destination objects will be used. Microsoft recommends using the SQL Server destination type when running SSIS on the same system as the SQL Server Database Services (SSDS). The reason for this is that when SSIS and SSDS are installed on the same system, SSIS can take advantage of the faster loading mechanisms of the SQL Server destination type. In our testing the source objects were flat files. The flat files used were created using a specific number of rows and column widths and were in string format. Data transformations Transformation types can dramatically change the performance of an SSIS package. Data transformations consume buffer resources or server memory. The SSIS engine uses in-memory processing to manipulate data as it is transferred from source to destination. We classify transformation types in three categories: synchronous, asynchronous, and blocking. Synchronous transformations are commonly called row transformations. Row transformations reuse existing buffers and do not require new buffers to complete the data transformation. They include Derived Column, Data Conversion, Multicast, and Lookup functions. Asynchronous transformations are commonly called partially blocking transformations and are used to combine datasets. In most cases the number of input records will not equal the number of output records and because of this the output of the transformation is copied into a new buffer. Examples of partially blocking transformations are Merge, Merge Join, and Union All functions. 5
  • 6.
    Blocking transformations performthe most work and therefore can consume the greatest amount of resources. Similar to asynchronous transformations, blocking transformations create a new buffer for the transformation output but in addition to this they also create a new thread into the data flow. The two main blocking transformations are the Aggregate and Sort functions. Parallel threads versus single threads In most cases there will be multiple sources from which data is to be pulled from and distributed to. Within SSIS and the ETL process there are a number of different ways in which you can construct this process. How you decide to construct this process can have major impacts on system resource utilization and the overall SSIS package execution times. For this document we looked at the different ways to run parallel processes and show how they can benefit as well as burden your environment. The following images show examples of SSIS packages, Figure 1 is running a single engine thread and Figure 2 is running multiple or parallel internal engine threads. Figure 1. Single SSIS engine thread The preceding example is taking a 50 million row flat file and inserting the rows into a database table. This example has one engine thread running. 6
  • 7.
    Figure 2. ParallelSSIS engine threads This example is taking the same 50 million rows and distributing them across five flat files with 10 million rows each. In this example there are five engine threads running in parallel. In each of these cases there is still only one SSIS instance running. Another way to run parallel operations is to split up the same five flat files into five individual SSIS packages and running them at the same time. In that case there would be five SSIS instances running. There will be more information and test results on each of these configurations in the next sections. Configuration and test procedures Configuration The test configuration used for this project encompasses a series of SSIS packages designed to scale across the most commonly sized configurations for SQL Server 2005 Integration Services and the Business Intelligence environment. Servers Two different server architectures were used to host SQL Server 2005 SSIS and SSDS during testing. The majority of testing was completed on ProLiant BL45p Blade servers with a proof point comparison test using the HP Integrity rx4640 server. Test scripts were created to incrementally increase the workload to show the configuration fit for each server platform. The workloads were designed to push the resources on each server to their limits. 7
  • 8.
    In addition tothe server hardware, distributed and consolidated server architectures were tested to show associated resource requirements for Business Intelligence services. Using dual core processors, the HP ProLiant BL45p servers are a great fit for high computing workloads such as SSIS. SQL Server Application Server Configuration—ProLiant BL45p Blade server • Hardware configuration – Up to (4) dual core AMD Opteron 880, 2.4-GHz processors – Up to 32-GB DDR SDRAM – Dual port Fibre Channel (FC) HBA • Software configuration – Windows® Server 2003 R2 x64 EE – SQL Server 2005 x64 EE, SP1 – HP MPIO Full Feature Failover for EVA8000 SQL Server Application Server Configuration—HP Integrity rx4640 server (Scale-Up Proof point test only) • Hardware configuration – Up to (4) single core Itanium® 2, 1.6-GHz processors – 32-GB PC2100 DDR SDRAM – PCIx 2 Channel FC HBA • Software configuration – Windows Server 2003 ia64 EE w/SP1 – SQL Server 2005 ia64 EE – HP MPIO Full Feature Failover for EVA8000 Additional servers were added to support the distributed server architecture and client access testing as needed as well as to hose the HP StorageWorks Command View EVA management software and Windows Active Directory applications. Storage arrays The storage consisted of an HP StorageWorks EVA8000 with a 2 controller/12 disk shelf design (2C12D). Each controller had four FC ports connected to a redundant switch fabric. The data was spread across (168) 146-GB FC drives. Testing was performed on both isolated (separate disk groups) and non-isolated (one large disk group) storage configurations to show the performance differences and determine storage best practices. There were no other applications stored on the EVA8000 other than SQL Server 2005 for this testing. Storage area network (SAN) and network infrastructure The SAN infrastructure used redundant 2-Gb switches and I/O was distributed across all possible array ports by use of preferred paths from the MPIO software. The IP network ran on an internal 1-Gb subnet and there was no exposure to outside network activity. Management software The following software was configured and tested: HP ProLiant Essentials, HP Storage Essentials, and HP Insight Manager. 8
  • 9.
    Figure 3. Configurationdiagram Server and storage layout The server and storage layout used two types of methodologies, the “scale-up” methodology and the “scale-out” methodology. The two methodologies were chosen to show the difference in performance when running SSIS in each design. In each case the test database was placed in the “Bulk Logged” recovery mode to reduce logging during the loading process. The database data volume was configured as VRAID5 and the database log volume was configured as VRAID1 on the HP EVA array. Note: Microsoft recommends setting the database recovery mode to “Bulk Logged” only during the loading process and setting the database back to “Full Logged” mode when the loading process is complete. 9
  • 10.
    Scale-up The scale-up designwas the simpler of the two designs. It was composed of one SSDS instance on one physical server. The storage was configured using two disk groups on the HP EVA array, one for all the database data and log volumes and one for the flat files or source data. This storage layout is consistent with a non-isolated storage layout on the EVA. Figure 4 shows what a simple scale-up scenario would typically look like. Figure 4. Scale-up diagram 10
  • 11.
    Scale-out The scale-out designis more complex than the scale-up design because there are usually multiple servers hosting the applications as well as multiple disk groups hosting the database files. In this scenario an additional server was added to host the SSIS engine to offload those resources from the production database server. The storage was distributed across multiple disk groups and data and log files were each located in separate disk groups. Figure 5 shows what a simple scale-out scenario might typically look like. Figure 5. Scale-out diagram Test procedures Testing was performed to scale workloads until system bottlenecks were reached for each test scenario. Two different servers were utilized: testing began with the HP ProLiant BL45p blade servers, followed by the HP Integrity rx4640 server. The HP Integrity rx4640 server was tested as a proof point only to contrast performance on both the HP ProLiant BL45p servers and the HP Integrity rx4640 server. Note: It is important to note that as of this writing, HP has released a new platform of Integrity servers to replace the rx4640 server that were not available during this testing. The replacement for the rx4640 server is the new HP Integrity rx6640 server. The rx6640 server utilizes the Montecito chipset, which boasts double the performance of the previous Itanium chipset. 11
  • 12.
    SQL Server IntegrationServices, SSIS-ETL test process • Flat files were created using SQLedit DTM Generator software. • Flat files consist of text files, tab delimited using string variables. • Load, Insert, and Update tests used flat files for single column tables with 10 million, 50 million, 100 million, and 500 million rows. • Scale-up tests show how SSIS can scale up by building up the configuration using additional server resources (processors and memory) and storage resources (physical disks). • Scale-out tests show how SSIS can scale out by building out the configuration using multiple servers and disk groups. • All tests used VRAID5 for the database data files and VRAID1 for the database log files. All source data was hosted on VRAID5 volumes. • All tests compare TempDB on local storage to SAN storage. Test results The test results on the next few pages describe the key findings. Detailed test metrics are shown in Appendix A–Detailed test results. The following outline will be used to order the test results. • Server findings • Storage findings • Management software • Best practices Server findings First, it is important to understand the database recovery model and how it affects bulk loading operations to the database. The database recovery model is a way to change how a database logs transactions. During bulk load operations SQL Server is writing large amounts of data to the database which in turn creates significant activity on the log files. Changing the database recovery model can therefore have tremendous effects on performance. For more information on database recovery models, see the For more information section. Setting the database recovery model to Bulk-Logged has a large impact on server as well as storage resources. Figure 6 shows the disk write latencies as seen by the database server for the bulk-logged and full-logged recovery modes. 12
  • 13.
    Figure 6. Diskwrite latencies Full-Logged Recovery Mode Bulk-Logged Recovery Mode For the full recovery mode, latencies can reach as high as 20 ms, which is the suggested limit for SQL Server. The latencies of the volumes rise as the log flushes the data onto the database data volumes. In contrast, when the database recovery mode is set to Bulk-Logged, the latencies of the volumes stay below a constant 4 ms as there is no major flushing of the log file to the database data files. The source data is sent directly to the data files with minimal logging. The same holds true on the EVA array. As the log flushes data to the database data files the EVA controller mirror port sees this activity and can become nearly saturated. This could have major impacts on other array activity. By setting the database recovery model to Bulk-Logged the activity over the EVA controller mirror port is held constant and at half the rate of that for the log flushing activity. Figure 7 shows the improvement on the EVA array mirror port utilization by changing the database recovery mode to Bulk-Logged mode. 13
  • 14.
    Figure 7. EVAcontroller mirror port throughput Full-Logged Recovery Mode Bulk-Logged Recovery Mode The rest of this section describes the major server findings for both the scale-up and scale-out test results. The constants for both test configurations are as follows: • Test database is set to the Bulk-Logged recovery model. • Test database data files are built on VRAID5 EVA virtual disks. • Test database log files are built on VRAID1 EVA virtual disks. The first area we will look at is memory. What impacts memory utilization when running SSIS packages? From testing it was found that the two major impacts on server memory utilization are the number of internal SSIS processes, or execution threads, and the number of actual SSIS instances running. Tests were run using SSIS packages with internal parallel operations as well as single operations. The packages with single operations were then run externally in parallel to see the impact on server resources. 14
  • 15.
    Figure 8 showsthe server memory utilization for a given number of internal SSIS engine threads running in parallel. The legend lists the server configuration by number of processors and amount of memory installed. Figure 8. SSIS internal engine threads: % memory utilization SSIS: % Memory Utilization Per Thread 0 10 20 30 40 50 60 70 80 90 100 1 2 3 4 5 10 SSIS Package: Internal Execution Threads % Memory Utilization 2Proc_8GB RAM 2Proc_16GB RAM 4Proc_16GB RAM 4Proc_32GB RAM Figure 8 clearly shows that the number of internal SSIS execution threads directly impacts the amount of memory that SQL Server will use. Note that as the number of execution threads increased, so did the average bulk copy rate (rows/second). The ProLiant BL45p processor and memory configurations are shown in the legend to the right of the graph. These BL45p server resources were increased incrementally to present additional resources to the SQL Server database server. A similar memory test was performed using individual SSIS packages to show the performance differences that internal versus external SSIS processes can have. The tests compared the BL45p server with the max configuration of four processors and 32 GB of SDRAM. Figure 9 shows that there is a significant change in the percent of memory utilization across the server. 15
  • 16.
    Figure 9. BL45pserver: SSIS internal versus external engine threads SSIS: Internal vs. External Execution Threads 0 10 20 30 40 50 60 70 80 90 100 1 2 3 4 5 10 Engine Threads % Memory Utilization Internal External The graph in Figure 9 shows a distinct increase in memory utilization as internal SSIS threads are introduced. Compared to the external SSIS engine threads, the memory utilization leveled off around 50%. 16
  • 17.
    It was foundthat SSIS execution threads impacted the processor resources as well. Although the effect was not as demanding as the memory utilization, Figure 10 shows that there was some variance. Figure 10. SSIS: Processor utilization per engine thread SSIS: Processor Utilization per Thread 0 10 20 30 40 50 60 70 1 2 4 5 10 Internal Engine Threads % Processor Utilization 2Proc_8GB RAM 2Proc_16GB RAM 4Proc_16GB RAM 4Proc_32GB RAM The processor utilization plots in Figure 10 show how the dual-core processors on the ProLiant BL45p server scale as execution threads are added internally to the SSIS packages. The workload never pushed the processor to its limit even at the smallest server configuration (memory/processor). 17
  • 18.
    Figure 11. Scale-upserver versus scale-out server performance (4 Proc/32 GB) Scale-Up vs. Scale-Out 0 50,000 100,000 150,000 200,000 250,000 1 2 4 5 10 # of Engine Threads Bulk Copy (rows/sec) Scale-Up Scale-Out The scale-up (SSIS and SSDS on the same server) configuration demanded much more EVA disk resources than the scale-out (SSIS and SSDS on separate servers). As shown in Figure 11, SQL Databases: Bulk Copy Rows/sec were much greater (with lower Package Execution Times) in the scale-up server tests. The ability of SQL to use the faster loading mechanism of the SQL Server Destination type in the SSIS packages attributed greatly to the performance of the SSIS packages in the scale-up server configuration. 18
  • 19.
    Figure 12. SSISperformance: Rows/sec and package execution time Scale-Up vs. Scale-Out 0 50000 100000 150000 200000 250000 Scale-Up Scale-Out Bulk Copy Rows/sec 0:00:00 0:14:24 0:28:48 0:43:12 0:57:36 1:12:00 1:26:24 1:40:48 Package Execution Time Rows/sec Execution Time Figure 12 shows a comparison of the rows/sec insert rates and the package execution times for the 500-million row insert package for both the scale-up and scale-out BL45p server configuration. 19
  • 20.
    Figure 13. Bulkcopy rows/second Bulk Copy Rows/second 0 50,000 100,000 150,000 200,000 250,000 1 0 M i l l i o n 5 0 M i l l i o n 5 0 M i l l i o n 1 0 0 M i l l i o n s 2 0 0 M i l l i o n 5 0 0 M i l l i o n Rows Inserted Rows/sec 2Proc_8GB RAM 2Proc_16GB RAM 4Proc_16GB RAM 4Proc_32GB RAM Figure 13 shows the Bulk Copy Rows/second performance for each SSIS package as the server resources scale up. The real advantage is shown when running larger packages. It is easily seen how the performance increases for the 200- and 500-million row packages. 20
  • 21.
    The same holdstrue for SSIS package execution times. Figure 14 shows the associated SSIS package execution times decrease for the 100-, 200-, and 500-million row insert packages as server resources are increased. Figure 14. SSIS package execution times SSIS Package Execution Times 0:00:00 0:14:24 0:28:48 0:43:12 0:57:36 1:12:00 1:26:24 1:40:48 1:55:12 1 0 M i l l i o n 5 0 M i l l i o n 5 0 M i l l i o n 1 0 0 M i l l i o n s 2 0 0 M i l l i o n 5 0 0 M i l l i o n Rows Inserted Time: h:m:s 2Proc_8GB RAM 2Proc_16GB RAM 4Proc_16GB RAM 4Proc_32GB RAM Note: Microsoft recommends using smaller batch sizes for large SSIS packages requiring large amounts of server resources. However, in our testing, smaller batch sizes did not prove to have a major impact on server resources. These results may be a result of the SSIS package design used for this testing. 21
  • 22.
    Storage findings Looking atthe storage and comparing the two storage configurations of the database on one disk group (scale-up) and the database across multiple disk groups (scale-out), it is clear that there was much greater I/O on the EVA during the single disk group testing. This is likely due to the SSIS package being used. To clarify, for all scale-out tests, the OLE DB destination type had to be used because the SQL Server destination type is not supported in a distributed server configuration. Since the scale-out tests could not take advantage of the fast load mechanism of the SQL Server destination type, the workload of the ETL system was less than that of the scale-up environment. Note: Preferred paths were used on the EVA storage array to separate the read only activity of the source data and the write only activity of the destination locations. Figure 15 shows the throughput (KB/s) across the EVA storage array for both scale-up and scale-out configurations. The scale-up performance (KB/s) doubles that of the scale-out performance on the EVA array. Figure 15. Scale-up versus scale-out: EVA storage array utilization KB/s Scale-Up Scale-Out 22
  • 23.
    Focusing on ascale-up configuration clearly improves the overall performance, but requires the disk storage to support high I/O levels. Overall throughput can be further increased (resulting in a direct decrease in package execution time) by increasing the overall number of threads. However, increasing the number of threads also places additional I/O burdens on the backend storage. Figure 16 shows the results of increasing the number of threads on the overall system performance (measured in write latencies) and the impact of adding additional disks to the storage subsystem to obtain suitable performance. With the original configuration of a single thread and 24 disks, the database read and write latencies were well within the suggested 20-ms threshold for SQL Server. However, this configuration significantly limited the overall system throughput to just over 160 MB/s. In an effort to increase throughput, additional threads were added while maintaining the same EVA disk configuration (24 disks). While resulting in a doubling of the throughput (306 MB/s for five threads versus 160 MB/s for one thread), the additional I/O load on the EVA caused a severe increase in database read and write latencies. By increasing the number of spindles available to the database LUN (40 disks versus 24 disks), write latencies were significantly reduced to within the targeted 20-ms levels. Increasing the number of threads again (this time to 10 threads), caused a similar increase in I/O to the storage array, with the addition of more disks resulting in an associated reduction in latencies (note the change in virtual disk write latency) while improving overall throughput. Figure 16. Impact of the number of threads and the number of disks on throughput and latency Storage Configuration Results 0 10 20 30 40 50 60 70 80 90 100 110 120 1 Thrd / 24 Disks 5 Thrd / 24 Disks 5 Thrd / 40 Disks 10 Thrd / 40 Disks 10 Thrd / 56 Disks 10 Thrd / 72 Disks 10 Thrd / 104 Disks # of Threads / # of Disks Latency (ms) 0 50 100 150 200 250 300 350 400 450 500 550 600 Throughtput (MB/s) DB Write Latency (ms) DB Read Latency (ms) EVA Virtual Disk Write Latency (ms) Total Host Throughput (MB/s) 23
  • 24.
    Management software Throughout testing,HP Systems Insight Manager and HP Storage Essentials management software was used to monitor server and storage system resources. Using management software can simplify the monitoring process when dealing with large server and storage environments. HP Systems Insight Manager, HP SIM, is a helpful tool to monitor server resources. HP SIM has the ability to view actual server resources real time. By using the HP SIM management console, you can bring up the Diagnostics view for each server in your environment. Figure 17 shows the Insight Diagnostics view of a server system’s configuration overview. Figure 17. HP Systems Insight Manager: Server diagnostics view 24
  • 25.
    By drilling downdeeper you have the ability to check the diagnostics of specific server components. The following image shows a more detailed view of the memory configuration of a server used during this testing. Figure 18 shows the memory slot information and the type of memory installed as well as the total amount of memory in the server and how much memory is available. Figure 18. Server System Insight diagnostics 25
  • 26.
    Another useful toolin the HP management software suite is HP Storage Essentials. Storage Essentials is bundled with an assortment of useful tools such as Application Viewer, Backup Manager, System Manager, Capacity Manager, Performance Manager as well as others. Figure 19 is a high-level view from System Manager. Figure 19. HP Storage Essentials 26
  • 27.
    By a simpleright-click, Storage Essentials will pull up a more detailed view of any specific component in the SAN. Figure 20 shows a detailed view of the topology of part of the SAN used during this testing. The topology view shows the granularity of the hosts, storage volumes, host bus adapters, switch port connections, and the rest of the topology for that component (not shown here). Figure 20. HP Storage Essentials: Topology view 27
  • 28.
    HP Storage Essentialsalso has components that show detailed views of capacity for each element in the SAN. Figure 21 shows the capacity detail of the EVA8000 used for this testing. Figure 21. HP Storage Essentials: Capacity Manager 28
  • 29.
    HP Storage EssentialsPerformance Manager can show the performance trends across the storage array for a period of time determined by the user as in the Figure 22. Figure 22. HP Storage Essentials: Performance Manager Management software is there to make things easier for IT professionals to get detailed data quickly and accurately. HP Systems Insight Manager and HP Storage Essentials are examples of HP software management products that enable fast, easy management and real-time information of the entire SAN environment. Best practices Best practices for SQL Database administrators • Before running large bulk load operations, set the database recovery model to Bulk-Logged. Be sure to reset the recovery model upon completion of SSIS operations. • Run parallel operations—When possible, run internal parallel SSIS engine threads to decrease package execution times and run external parallel SSIS engine threads to minimize server resources. • When running SSIS packages on local database server, use SQL Server destination types to take advantage of the fast load option. 29
  • 30.
    Best practices forserver administrators • For larger SSIS packages with multiple engine threads, plan on using servers with four processors and a minimum of 16 GB of memory installed. • When running SSIS packages on HP ProLiant BL45p servers, plan for higher memory resource utilization. When running SSIS packages on HP Integrity rx4640 servers, plan for higher processor resource utilization. • Use HP Systems Insight Manager software for server diagnostics, driver and firmware management, and snapshot views of server resource allocations. Best practices for storage administrators • Plan for higher storage array utilization when SSIS packages with the SQL Server destination type. • Use preferred paths to separate read activity of source data and write activity to destinations. • Use HP Storage Essentials management software for SAN topology, capacity management, and snapshot views of overall system performance. Conclusions SSIS package design and the ability to take advantage of the fast loading mechanism of the SSIS SQL Server destination object showed the greatest impact on server and storage performance and system resource. The scale-up testing took advantage of the SSIS SQL Server destination object and the scale-out testing utilized the SSIS OLE DB destination object. There proved to be drastic differences in performance and system resources when testing each SSIS destination type. Server configuration conclusions 1. The number of SSIS package execution threads had the highest impact on server memory and processor utilization. The memory utilization tests results were much different when SSIS execution threads were run internally or externally. a. Internal SSIS package execution threads consumed up to all server memory resources. b. External SSIS package execution threads peaked at 50% memory utilization. 2. Optimal Server Configuration: Four dual-core processors and 16 GB of SDRAM proved to provide the greatest improvement in package execution times. a. Processor resource utilization reduced by half compared with tests with two processors installed. b. The majority of SSIS package execution times completed in half the time as compared with tests with two processors installed. 3. Expect higher server resource utilization when using the SSIS SQL Server destination object. It was clear that the SSIS SQL Server destination object provided much better performance then the SSIS OLE DB destination object but the cost of systems resources should be accounted for and planned beforehand. 30
  • 31.
    Storage configuration conclusions 1.The SSIS SQL Server destination object proved to have the highest overall impact on both server and storage resources. a. SSIS package execution times improved 2x when the SQL Server destination object was used compared to the OLE DB destination object. b. The HP EVA array throughput was 50% higher when the SQL Server destination object was used compared to the OLE DB destination object. TempDB was examined early in the testing in both the scale-up and scale-out test environments and was not affected during this testing. TempDB is mostly affected during times of long query activity. Since the ETL process involves mostly write operations to the database, TempDB is not an issue and does not need to be accounted for during the ETL process. TempDB would be affected during operations such as index builds and index rebuilds and should be accounted for during these operations with SSIS. When determining to how to use SSIS configurations in your environment, it really narrows down to two business concerns, performance and system resources. Business Concern: Better SSIS Package Performance and Execution Times • Scale-Up – Use SQL Server destination object – Use parallel execution threads – Greatest utilization of server and storage resources Business Concern: Limited Server and Storage Resources • Scale-Out – Use OLE DB destination object – Use single thread SSIS packages – Reduced impact on server and storage resources 31
  • 32.
    Appendix A—Detailed testresults Testing results based on the following parameters: • Flat file construction – 10 million rows, 1 column, 1K byte size, string data type – 50 million rows, 1 column, 1K byte size, string data type – 10 million rows, 10 columns, 100 byte size, string data type • SQL Server Database Settings – Recovery Model set to “Bulk Logged” • Database Table Settings – Column width set to accommodate flat file row size Flat file construction and load sizes Flat file name # of rows # of columns Column width Total row size Total flat file size Notes 10M10C1K 10 Million 10 100 byte 1K byte 10 GB 10M1C4K 10 Million 1 4K byte 4K byte 40 GB 10M1C1K 10 Million 1 1K byte 1K byte 10 GB 50M1C1K 50 Million 1 1K byte 1K byte 50 GB 10M1C1K_5 50 Million 1 1K byte 1K byte 10 GB 5 engine threads of 10M rows 100M1C1K 100 Million 1 1K byte 1K byte 50 GB 2 engine threads of 50M rows 200M1C1K 200 Million 1 1K byte 1K byte 50 GB 4 engine threads of 50M rows 500M1C1K 500 Million 1 1K byte 1K byte 50 GB 10 engine threads of 50M rows Server test results The server testing was completed using the HP ProLiant BL45p Blade server. Two test iterations were completed using a scale-up server scenario and a scale-out server scenario. All server tests were completed while the test database was set to “Bulk Logged” recovery. The database data file was configured VRAID5, and the database log file was configured VRAID1. All performance-related metrics were collected using Windows Perfmon and based on the 95th percentile for each test run. Scale-up server test results The scale-up test results show the performance results for one server running both SQL Server Integration Services and Database Services. The storage was configured using two disk groups, one to host the flat files or source data and one to host the database files. The results are based on the SSIS packages using the SQL Server destination type. 32
  • 33.
    Table 1. BL45pserver—Scale-up server test results # of rows inserted # of engine threads Data size inserted Avg. total % processor % committed memory Avg. bulk copy rows/sec Package execution time Notes 2 processors /8-GB memory 10 Million 1 10 GB 29 45 73,337 00:02:33 50 Million 1 50 GB 25 45 79,233 00:11:58 50 Million 5 50 GB 63 88 152,599 00:06:14 Low memory warnings. Consuming all memory resources 100 Million 2 100 GB 41 50 107,213 NA 200 Million 4 200 GB 58 88 138,196 00:35:50 Low memory warnings. Consuming all memory resources 500 Million 10 500 GB NA NA NA NA Could not run due to package timeout 2 processors /16-GB memory 10 Million 1 10 GB 26 48 72,075 00:02:29 No change from above 50 Million 1 50 GB 24 48 78,947 00:12:07 No change from above 50 Million 5 50 GB 49 92 155,907 00:06:34 Minor change in processor 100 Million 2 100 GB 37 48 108,582 00:20:51 No change from above 200 Million 4 200 GB 45 92 89,637 00:41:37 All memory consumed 500 Million 10 500 GB 64 92 130,516 1:49:05 Completed but slow. All memory consumed 4 processors/16-GB memory 10 Million 1 10 GB 11 29 75,734 00:02:27 Server resources cut in half 50 Million 1 50 GB 12 30 77,871 00:12:07 Proc cut in half 50 Million 5 50 GB 33 90 153,651 00:06:11 No change from above 100 Million 2 100 GB 17 48 109,499 00:18:04 Proc cut in half 200 Million 4 200 GB 24 67 140,191 00:27:31 Server resources and exec time cut in half 500 Million 10 500 GB 35 91 195,042 01:00:59 Cut proc utilize and exec time in half 33
  • 34.
    4 processors/32-GB memory 10Million 1 10 GB NA NA NA NA No change from above results 50 Million 1 50 GB 11 28 76,313 00:12:19 No change from above 50 Million 5 50 GB 28 92 155,474 00:05:58 No change from above 100 Million 2 100 GB 17 49 108,475 00:15:22 No change from above 200 Million 4 200 GB 24 69 145,317 00:28:31 No change from above 500 Million 10 500 GB 40 91 228,777 00:48:31 Slight improvement in throughput and exec time HP Integrity rx4640 server data A proof point was done using the HP Integrity rx4640 server to show how SSIS can be run on HP Integrity servers as well as ProLiant servers. It is important to note that the testing was done using the max hardware configuration on the rx4640 server (four processors, 32-GB RAM) and the SSIS packages tested had 4, 5, and 10 execution threads. The following table shows the data collected from the test runs with the HP Integrity rx4640 server. Table 2. rx4640 server—Scale-up proof point test results # of rows inserted # of engine threads Data size inserted DB Host: Total % processor DB Host: % Committed memory SQL Databases: bulk copy rows/sec Package execution time Notes 200 Million 4 200 GB 74 62 129,171 00:30:10 50 Million 5 50 GB 93 63 156,021 00:06:29 500 Million 10 500 GB 84 63 137,405 Package Timeout After 200M rows Note Package Timeout 34
  • 35.
    Scale-out server testresults The scale-out test results are based on distributing the SQL Server resources onto multiple servers. The server scale-out testing was completed by placing SSIS on a separate server to offload the ETL process from the production SQL Server system. The server scale-out testing included two ProLiant BL45p servers—one to run the production SQL Server database and one to run the SSIS or ETL processes. For scale-out testing, the SSIS packages were built using an OLE DB destination type. In each case the storage was configured using three disk groups—one for data files, one for log files, and one to host the flat files or source data. The following table shows the performance characteristics of both servers during this testing. Table 3. BL45p server—Scale-out server test results # of rows inserted # of engine threads Data size inserted DB Host: Total % processor DB Host: % committed memory Remote Host: Total % processor Remote Host: % committed memory SQL Databases: bulk copy rows/sec Package execution time Notes DB Host: 4 processors/32-GB memory—Remote Host: 2 processors/8-GB memory 10 Million 1 10 GB 11 27 21 16 48,911 00:05:36 50 Million 1 50 GB 14 27 28 16 54,516 00:20:27 50 Million 5 50 GB 28 92 48 20 95,589 00:10:33 100 Million 2 100 GB 15 47 35 17 68,966 00:31:07 200 Million 4 200 GB 24 92 51 19 94,493 00:40:58 500 Million 10 500 GB 30 92 61 24 105,416 1:22:42 Storage test results Like the server testing, the storage tests included two different storage configurations. They included a scale-up or consolidated storage configuration and a scale-out or distributed storage configuration. In all cases the BL45p server had four processors and 32 GB of memory installed. The data files were built using VRAID5 and logs using VRAID1. The performance metrics for the storage tests were collected using HP StorageWorks EVAPerf utility and based on the 95th percentile for each test run. 35
  • 36.
    Scale-up storage testresults The scale-up storage tests were completed by using one large disk group for database files and scaling up the number of physical disks in the disk group until acceptable latencies were reached on the data and log disks. Table 4. Scale-up storage test results # of disks in DB Disk Group # of disks in FF Disk Group EVA Virtual Disk: Avg. write latency data file EVA Virtual Disk: Avg. write latency log file EVA DB Disk Group: Total avg. disk write latency EVA FF Disk Group: Total avg. disk read latency EVA Mirror Port: Total MB/s EVA Storage Array: Total Host MB/s Notes 50 Million rows/1 SSIS engine thread/50 GB of data inserted 24 24 4ms 2ms 3.7ms 2ms 126 MB/s 160 MB/s Good Results 40 NA NA NA NA NA NA 50 Million rows/5 SSIS engine thread/50 GB of data inserted 24 24 210ms 25ms 183ms 6ms 242 MB/s 306 MB/s Add Drives 40 24 16ms 9ms 13.6ms 5ms 273 MB/s 346 MB/s Good Results 56 NA NA NA NA NA NA 500 Million rows/10 SSIS engine threads/500 GB of data inserted 24 NA NA NA NA NA NA Error: Buffer Time out 40 24 914ms 27ms 27ms 9ms 371 MB/s 432 MB/s Add Drives 56 24 53ms 32ms 31ms 8ms 385 MB/s 459 MB/s Add Drives 72 24 45ms 31ms 28ms 10ms 372 MB/s 442 MB/s Add Drives 88 48 149ms 40ms 14ms 9ms 284 MB/s 480 MB/s DGlLatency okay but VD’s bad 104 48 48ms 36ms 29ms 8ms 326 MB/s 522 MB/s Still high but ran out of disks 36
  • 37.
    Scale-out storage testresults The scale-out storage tests were completed by using two disk groups and distributing the data and log files for the test database. In each test the number of physical disks in each disk group were increased or decreased until acceptable latencies were reached. Table 5. Scale-out storage test results # of disks in Data Disk Group # of disks in Log Disk Group # of disks in FF Disk Group EVA Data Disk Group: Avg. write latency EVA Log Disk Group: Avg. write latency EVA FF Disk Group: Total avg. disk read latency EVA Mirror Port: Total MB/s EVA Storage Array: Total Host MB/s Notes 50 Million rows/1 SSIS engine thread/50 GB of data inserted 16 8 24 2.9ms 1.4ms 0ms 74 MB/s 136 MB/s Good Results 50 Million rows/5 SSIS engine thread/50 GB of data inserted 16 8 24 3.3ms 1.2ms 7.5ms 115 MB/s 210 MB/s Good Results 500 Million rows/10 SSIS engine threads/500 GB of data inserted 16 8 24 3.6ms 1.2ms 20ms 191 MB/s 237 MB/s 24 16 24 3.8ms 1.6ms 25ms 204 MB/s 235 MB/s 32 24 24 3.9ms 1.6ms 60ms 213 MB/s 233 MB/s 37
  • 38.
    Appendix B—Performance countersand metrics The following performance metrics and counters are the majority of metrics that can determine how the entire server, storage, and database environment is performing. For this project, only the counters in BOLD were used to determine how the overall system performed as well as the recorded results in Appendix A. • SQL Buffer Manager – Buffer Cache Hit Ratio > 90% – Page Reads/sec—want a low value – Free Buffers—want a consistently high value – Lazy Writes/sec—want a low value or 0 – Stolen Pages—want a low value • SQL Cache Manager – Cache Hit Ratio > 80% • SQL Databases – DatabaseInstance: Bulk Copy Rows/sec • SQL Locks – Average Wait Time (ms)—steady over time – Lock Waits/sec – Number of Deadlocks/sec • SQL Server Memory Manager – SQL Cache Memory – Target Server Memory – Total Server Memory < 80% Target Server Memory • SQL Server Statistics – Batch Requests/sec—high value indicates good throughput 38
  • 39.
    39 • SQLServer: Transactions(TempDB Counters) – Free space in TempDB (KB) – Version Store Size (KB)—monitor size – Version Generation Rate (KB/s) – Version Cleanup Rate (KB/s)—size prediction – Version Store unit count – Version Store unit creation – Version Store unit truncation—high value might suggest TempDB under space stress – Update Conflict Ratio – Longest Transaction Running Time – Transactions – Snapshot Transactions – Update Snapshot Transactions – NonSnapshot Version Transactions—version generation snapshot transactions • Server – Processor: %Processor Time – System: Processor Queue Length < 2 – Memory: % Committed Bytes In Use • Disk Counters – Current Disk Queue Length < 2 Example: Current Disk Queue Length on G: is 45 but G: is a storage LUN made up of 28 physical disks so the actual disk queue length is 45/28=1.6 – Disk Reads/sec, Writes/sec – Disk Bytes/sec; Total, Read, Write, Avg. – Latency: o Avg. Disk Sec/Transfer < 0.3 seconds o PhysicalDisk(drive:) Avg. Disk sec/Read ƒ Low latency: < 20ms 95th percentile o PhysicalDisk(drive:) Avg. Disk sec/Write ƒ Low latency: < 15ms 95th percentile o Logs: Avg. Disk sec/Writes < 8 ms
  • 40.
    40 Appendix C—Acronyms anddefinitions • SSIS—SQL Server Integration Services • SSDS—SQL Server Database Services • SSBIDS—SQL Server Business Intelligence Development Studio • DTS—Data Transformation Services, SQL Server 2000 • ETL—Extraction, Transformation, and Load, Replaces DTS in SQL Server 2005 • Internal Execution Thread—Process within a SSIS package • External Execution Thread—Single running SSIS instance Appendix D—BOM and software revisions QTY Part number Description Storage Array 1 258158-888 CTO/FLAG Storage CTO_FLAG 1 AD522A HP EVA8000 2C12D 60Hz 42U Cabinet 168 364621-B23 HP StorageWorks 146-GB 15K FC HDD 1 T4256C HP EVA4000/6000/8000 5.1 Controller Media Kit 1 T3724C HP Command View EVA v5.0 Media Kit SAN Infrastructure 2 A7394A HP StorageWorks 4/32 SAN Switch Pwr Pack 64 A7446B HP StorageWorks4gbSW SnglPK SFP Transcvr SQL Server 2005 Application Servers 1 243564-B22 HP BLp Enhanced Enclosure 2 378926-B21 Cisco BLp Ethernet Switch 2 399598-B21 HP BL25p 2.4-Ghz-1M DC 2G 2P Svr 4 379300-B21 HP 4-GB Reg PC3200 2x2-GB Memory 4 286778-B22 HP 72-GB 15K U320 Pluggable Hard Drive 2 381881-B21 HP BL25/45p Fiber Channel Adapter Benchmark Factory Load Server 4 399779-001 HP DL580R03 3.00-GHz 4M DC 2P US Svr 32 343057-B21 HP 4-GB REG PC2-3200 2x2GB DDR Memory 8 286778-B22 HP 72-GB 15K U320 Pluggable Hard Drive 4 331903-B21 HP Slim 24X Carbon Combo Drive 8 281541-B21 FCA2214 2-Gb FC HBA for Linux and Windows 8 399889-B21 HP X7040 3.00–4MB/667 570/580 G3 Kit 12 364639-B21 HP DL580R03 Memory Expansion Board
  • 41.
    41 Management Server 4 397630-001HP DL380G4 2.8/800-2M HPM DC US Svr 12 343057-B21 HP 4-GB REG PC2-3200 2x2-GB DDR Memory 8 286778-B22 HP 72-GB 15K U320 Pluggable Hard Drive 4 331903-B21 HP Slim 24X Carbon Combo Drive 8 281541-B21 FCA2214 2-Gb FC HBA for Linux and Windows Miscellaneous 1 221546-001 TFT5600 RKM, Rack-mounted keyboard/mouse/LCD 2 336045-B21 Console Switch 2x16 KVM, IP-based KVM switch 4 (263474-B22) 6' CAT5e KVM cable 8-pack, KVM connection cable pack 12 (AF100A) Blade System KVM adapter, KVM adapter for blade servers 12 (336047-B21) USB Interface adapter, KVM adapter for ProLiant servers 1 252663-B24 HP 16A High Voltage Modular PDU 3 252663-D74 HP 24A HV Core Only Corded PDU 1 291034-B21 HP 10A IEC320-C14/C19 8ft/2.4m Pwr Cord 2 378284-B21 HP BLp 1U Pwr Encl w/6 Pwr Supply Kit Software module Build version Microsoft Windows Server 2003 Enterprise x64 Edition R2 Microsoft Windows Server 2003 Enterprise ia64 Edition SP1 SQL Server 2005 x64 SP1 Build 9.0.2153 SQL Server 2005 ia64 SP1 Build 9.0.2153 SQL Server Business Intelligence Development Studio— Microsoft Visual Studio 2005 Build 8.0.50727.42 Microsoft SQL Server Integration Services Designer Build 9.00.2047 HP StorageWorks Command View EVA Software Suite Build 6.0.0.44 HP StorageWorks Command View EVA 6.0 Build 6.0.0.193 HP StorageWorks EVA Performance Monitor Build 6.0.0.36 HP MPIO Full Featured DSM for EVA4000/6000/8000 v2.00.02 HP Storage Essentials Enterprise Edition 5.10 Build 5.1.0.226 HP Systems Insight Manager 5.0 with SP5 Build C.05.00.02.00 HP Performance Management Pack v4.1 HP BladeSystem Integrated Manager v2.1
  • 42.
    For more information Thefollowing key documents and locations provide a wealth of information regarding successful deployment of Microsoft SQL Server on HP platforms. HP • HP Solutions for Microsoft SQL Server 2005—Always on Technologies http://h18004.www1.hp.com/products/servers/software/microsoft/sqlserver2005.html?jumpid=reg_R1002 _USEN • HP Blade System http://h71028.www7.hp.com/enterprise/cache/80316-0-0-0-121.aspx • HP StorageWorks Enterprise Virtual Arrays http://h18006.www1.hp.com/products/storageworks/eva/index.html • ActiveAnswers on HP.com http://h71019.www7.hp.com/ActiveAnswers/cache/71108-0-0-225-121.html • Microsoft SQL Server on HP ActiveAnswers http://h71019.www7.hp.com/ActiveAnswers/cache/70729-0-0-225-121.html • HP BladeSystem Solutions for Windows Infrastructure on HP ActiveAnswers http://h71019.www7.hp.com/ActiveAnswers/cache/251024-0-0-225-121.html • SQL Server 2005 Integration Services—Improving Performance of Bulk Operations http://h20000.www2.hp.com/bizsupport/TechSupport/Document.jsp?objectID=c00806483&lang=en&cc=u s&taskId=101&prodSeriesId=470490&prodTypeId=12169 Microsoft SQL Server Resources • http://www.microsoft.com/sql/default.mspx • http://www.microsoft.com/technet/prodtechnol/sql/2005/technologies/ssisperfstrat.mspx • http://www.microsoft.com/technet/prodtechnol/sql/2005/ssisperf.mspx HP Customer Focused Testing • www.hp.com/go/hpcft The HP Customer Focused Testing team offers pre-tested and fully integrated storage-server- software solutions that help your business thrive in a constantly changing environment. © 2007 Hewlett-Packard Development Company, L.P. The information contained herein is subject to change without notice. The only warranties for HP products and services are set forth in the express warranty statements accompanying such products and services. Nothing herein should be construed as constituting an additional warranty. HP shall not be liable for technical or editorial errors or omissions contained herein. Itanium is a trademark or registered trademark of Intel Corporation or its subsidiaries in the United States and other countries. Microsoft and Windows are U.S. registered trademarks of Microsoft Corporation. 4AA1-1028ENW, March 2007