SlideShare a Scribd company logo
1 of 7
Download to read offline
SAS and R Code
For
Basic Statistics
Avjinder Singh Kaler
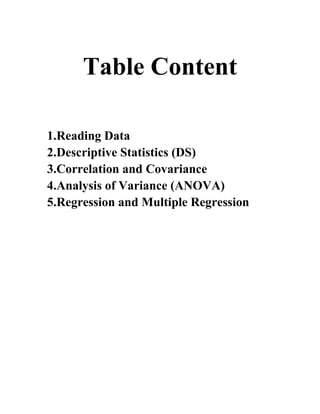
Table Content
1.Reading Data
2.Descriptive Statistics (DS)
3.Correlation and Covariance
4.Analysis of Variance (ANOVA)
5.Regression and Multiple Regression
1.Reading Data
1.SAS
I. There are many way of data reading in SAS, but the most common one is
Data data_name; data name used for file
Input x y z; variables
Datalines;
1 2 4
4 5 7
. . . Copy and paste data here
;
Run;
II. Data can be read from the folder of computer.
data data_name;
infile 'C:Avi soy.txt';
input GE ENV YIELD;
run;
filename avi 'C:Avi soy.txt';
data data_name;
infile avi;
input GE ENV YIELD;
run;
III. Data can be imported using the import option under File tab.
2.R
> getwd() # get current working directory
> setwd("C:/MyFolder") # set working directory
First Set working directory to the folder where data is present
If data is in text format, then data can be read as:
I. mydata <- read.table(“data_name.txt”)
If data is in csv format, then data can be read as:
II. mydata <- read.csv(“data_name.csv”)
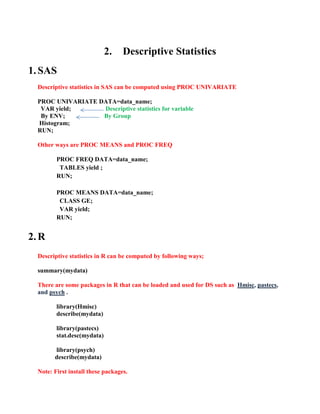
2. Descriptive Statistics
1.SAS
Descriptive statistics in SAS can be computed using PROC UNIVARIATE
PROC UNIVARIATE DATA=data_name;
VAR yield; Descriptive statistics for variable
By ENV; By Group
Histogram;
RUN;
Other ways are PROC MEANS and PROC FREQ
PROC FREQ DATA=data_name;
TABLES yield ;
RUN;
PROC MEANS DATA=data_name;
CLASS GE;
VAR yield;
RUN;
2.R
Descriptive statistics in R can be computed by following ways;
summary(mydata)
There are some packages in R that can be loaded and used for DS such as Hmisc, pastecs,
and psych .
library(Hmisc)
describe(mydata)
library(pastecs)
stat.desc(mydata)
library(psych)
describe(mydata)
Note: First install these packages.
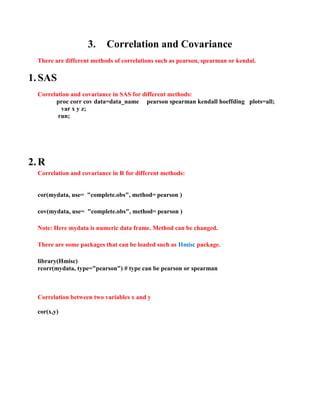
3. Correlation and Covariance
There are different methods of correlations such as pearson, spearman or kendal.
1.SAS
Correlation and covariance in SAS for different methods:
proc corr cov data=data_name pearson spearman kendall hoeffding plots=all;
var x y z;
run;
2.R
Correlation and covariance in R for different methods:
cor(mydata, use= "complete.obs", method= pearson )
cov(mydata, use= "complete.obs", method= pearson )
Note: Here mydata is numeric data frame. Method can be changed.
There are some packages that can be loaded such as Hmisc package.
library(Hmisc)
rcorr(mydata, type="pearson") # type can be pearson or spearman
Correlation between two variables x and y
cor(x,y)
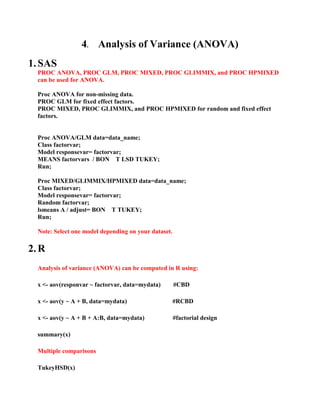
4. Analysis of Variance (ANOVA)
1.SAS
PROC ANOVA, PROC GLM, PROC MIXED, PROC GLIMMIX, and PROC HPMIXED
can be used for ANOVA.
Proc ANOVA for non-missing data.
PROC GLM for fixed effect factors.
PROC MIXED, PROC GLIMMIX, and PROC HPMIXED for random and fixed effect
factors.
Proc ANOVA/GLM data=data_name;
Class factorvar;
Model responsevar= factorvar;
MEANS factorvars / BON T LSD TUKEY;
Run;
Proc MIXED/GLIMMIX/HPMIXED data=data_name;
Class factorvar;
Model responsevar= factorvar;
Random factorvar;
lsmeans A / adjust= BON T TUKEY;
Run;
Note: Select one model depending on your dataset.
2.R
Analysis of variance (ANOVA) can be computed in R using:
x <- aov(responvar ~ factorvar, data=mydata) #CBD
x <- aov(y ~ A + B, data=mydata) #RCBD
x <- aov(y ~ A + B + A:B, data=mydata) #factorial design
summary(x)
Multiple comparisons
TukeyHSD(x)
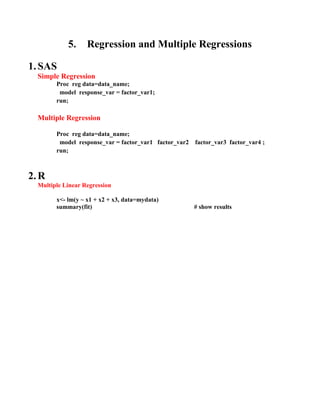
5. Regression and Multiple Regressions
1.SAS
Simple Regression
Proc reg data=data_name;
model response_var = factor_var1;
run;
Multiple Regression
Proc reg data=data_name;
model response_var = factor_var1 factor_var2 factor_var3 factor_var4 ;
run;
2.R
Multiple Linear Regression
x<- lm(y ~ x1 + x2 + x3, data=mydata)
summary(fit) # show results

More Related Content

What's hot

Data manipulation on r
Data manipulation on rData manipulation on r
Data manipulation on rAbhik Seal
 
Handling Missing Values
Handling Missing Values Handling Missing Values
Handling Missing Values Rupak Roy
 
Data handling in r
Data handling in rData handling in r
Data handling in rAbhik Seal
 
Manipulating Data using DPLYR in R Studio
Manipulating Data using DPLYR in R StudioManipulating Data using DPLYR in R Studio
Manipulating Data using DPLYR in R StudioRupak Roy
 
Next Generation Programming in R
Next Generation Programming in RNext Generation Programming in R
Next Generation Programming in RFlorian Uhlitz
 
2. R-basics, Vectors, Arrays, Matrices, Factors
2. R-basics, Vectors, Arrays, Matrices, Factors2. R-basics, Vectors, Arrays, Matrices, Factors
2. R-basics, Vectors, Arrays, Matrices, Factorskrishna singh
 
Data Visualization using base graphics
Data Visualization using base graphicsData Visualization using base graphics
Data Visualization using base graphicsRupak Roy
 
Introduction to Data Mining with R and Data Import/Export in R
Introduction to Data Mining with R and Data Import/Export in RIntroduction to Data Mining with R and Data Import/Export in R
Introduction to Data Mining with R and Data Import/Export in RYanchang Zhao
 
Export Data using R Studio
Export Data using R StudioExport Data using R Studio
Export Data using R StudioRupak Roy
 
Introduction To R Language
Introduction To R LanguageIntroduction To R Language
Introduction To R LanguageGaurang Dobariya
 
Data manipulation with dplyr
Data manipulation with dplyrData manipulation with dplyr
Data manipulation with dplyrRomain Francois
 
Data tidying with tidyr meetup
Data tidying with tidyr  meetupData tidying with tidyr  meetup
Data tidying with tidyr meetupMatthew Samelson
 
3 searching algorithms in Java
3 searching algorithms in Java3 searching algorithms in Java
3 searching algorithms in JavaMahmoud Alfarra
 
5 R Tutorial Data Visualization
5 R Tutorial Data Visualization5 R Tutorial Data Visualization
5 R Tutorial Data VisualizationSakthi Dasans
 
Grouping & Summarizing Data in R
Grouping & Summarizing Data in RGrouping & Summarizing Data in R
Grouping & Summarizing Data in RJeffrey Breen
 
Import Data using R
Import Data using R Import Data using R
Import Data using R Rupak Roy
 
R Brown-bag seminars : Seminar-8
R Brown-bag seminars : Seminar-8R Brown-bag seminars : Seminar-8
R Brown-bag seminars : Seminar-8Muhammad Nabi Ahmad
 
Introduction to data.table in R
Introduction to data.table in RIntroduction to data.table in R
Introduction to data.table in RPaul Richards
 

What's hot (20)

Data manipulation on r
Data manipulation on rData manipulation on r
Data manipulation on r
 
Handling Missing Values
Handling Missing Values Handling Missing Values
Handling Missing Values
 
Data handling in r
Data handling in rData handling in r
Data handling in r
 
Manipulating Data using DPLYR in R Studio
Manipulating Data using DPLYR in R StudioManipulating Data using DPLYR in R Studio
Manipulating Data using DPLYR in R Studio
 
Next Generation Programming in R
Next Generation Programming in RNext Generation Programming in R
Next Generation Programming in R
 
2. R-basics, Vectors, Arrays, Matrices, Factors
2. R-basics, Vectors, Arrays, Matrices, Factors2. R-basics, Vectors, Arrays, Matrices, Factors
2. R-basics, Vectors, Arrays, Matrices, Factors
 
Data Visualization using base graphics
Data Visualization using base graphicsData Visualization using base graphics
Data Visualization using base graphics
 
Introduction to Data Mining with R and Data Import/Export in R
Introduction to Data Mining with R and Data Import/Export in RIntroduction to Data Mining with R and Data Import/Export in R
Introduction to Data Mining with R and Data Import/Export in R
 
Export Data using R Studio
Export Data using R StudioExport Data using R Studio
Export Data using R Studio
 
Introduction To R Language
Introduction To R LanguageIntroduction To R Language
Introduction To R Language
 
Data manipulation with dplyr
Data manipulation with dplyrData manipulation with dplyr
Data manipulation with dplyr
 
Data tidying with tidyr meetup
Data tidying with tidyr  meetupData tidying with tidyr  meetup
Data tidying with tidyr meetup
 
R seminar dplyr package
R seminar dplyr packageR seminar dplyr package
R seminar dplyr package
 
3 searching algorithms in Java
3 searching algorithms in Java3 searching algorithms in Java
3 searching algorithms in Java
 
5 R Tutorial Data Visualization
5 R Tutorial Data Visualization5 R Tutorial Data Visualization
5 R Tutorial Data Visualization
 
R language introduction
R language introductionR language introduction
R language introduction
 
Grouping & Summarizing Data in R
Grouping & Summarizing Data in RGrouping & Summarizing Data in R
Grouping & Summarizing Data in R
 
Import Data using R
Import Data using R Import Data using R
Import Data using R
 
R Brown-bag seminars : Seminar-8
R Brown-bag seminars : Seminar-8R Brown-bag seminars : Seminar-8
R Brown-bag seminars : Seminar-8
 
Introduction to data.table in R
Introduction to data.table in RIntroduction to data.table in R
Introduction to data.table in R
 

Viewers also liked

Genome-Wide Association Mapping of Carbon Isotope and Oxygen Isotope Ratios i...
Genome-Wide Association Mapping of Carbon Isotope and Oxygen Isotope Ratios i...Genome-Wide Association Mapping of Carbon Isotope and Oxygen Isotope Ratios i...
Genome-Wide Association Mapping of Carbon Isotope and Oxygen Isotope Ratios i...Avjinder (Avi) Kaler
 
Genome-wide association mapping of canopy wilting in diverse soybean genotypes
Genome-wide association mapping of canopy wilting in diverse soybean genotypesGenome-wide association mapping of canopy wilting in diverse soybean genotypes
Genome-wide association mapping of canopy wilting in diverse soybean genotypesAvjinder (Avi) Kaler
 
Tutorial for Circular and Rectangular Manhattan plots
Tutorial for Circular and Rectangular Manhattan plotsTutorial for Circular and Rectangular Manhattan plots
Tutorial for Circular and Rectangular Manhattan plotsAvjinder (Avi) Kaler
 
Sugarcane yield and plant nutrient response to sulfur amended everglades hist...
Sugarcane yield and plant nutrient response to sulfur amended everglades hist...Sugarcane yield and plant nutrient response to sulfur amended everglades hist...
Sugarcane yield and plant nutrient response to sulfur amended everglades hist...Avjinder (Avi) Kaler
 
Nutrient availability response to sulfur amendment in histosols having variab...
Nutrient availability response to sulfur amendment in histosols having variab...Nutrient availability response to sulfur amendment in histosols having variab...
Nutrient availability response to sulfur amendment in histosols having variab...Avjinder (Avi) Kaler
 
Seed rate calculation for experiment
Seed rate calculation for experimentSeed rate calculation for experiment
Seed rate calculation for experimentAvjinder (Avi) Kaler
 

Viewers also liked (8)

Genome-Wide Association Mapping of Carbon Isotope and Oxygen Isotope Ratios i...
Genome-Wide Association Mapping of Carbon Isotope and Oxygen Isotope Ratios i...Genome-Wide Association Mapping of Carbon Isotope and Oxygen Isotope Ratios i...
Genome-Wide Association Mapping of Carbon Isotope and Oxygen Isotope Ratios i...
 
Genome-wide association mapping of canopy wilting in diverse soybean genotypes
Genome-wide association mapping of canopy wilting in diverse soybean genotypesGenome-wide association mapping of canopy wilting in diverse soybean genotypes
Genome-wide association mapping of canopy wilting in diverse soybean genotypes
 
R code for data manipulation
R code for data manipulationR code for data manipulation
R code for data manipulation
 
Tutorial for Circular and Rectangular Manhattan plots
Tutorial for Circular and Rectangular Manhattan plotsTutorial for Circular and Rectangular Manhattan plots
Tutorial for Circular and Rectangular Manhattan plots
 
Sugarcane yield and plant nutrient response to sulfur amended everglades hist...
Sugarcane yield and plant nutrient response to sulfur amended everglades hist...Sugarcane yield and plant nutrient response to sulfur amended everglades hist...
Sugarcane yield and plant nutrient response to sulfur amended everglades hist...
 
Nutrient availability response to sulfur amendment in histosols having variab...
Nutrient availability response to sulfur amendment in histosols having variab...Nutrient availability response to sulfur amendment in histosols having variab...
Nutrient availability response to sulfur amendment in histosols having variab...
 
R Code for EM Algorithm
R Code for EM AlgorithmR Code for EM Algorithm
R Code for EM Algorithm
 
Seed rate calculation for experiment
Seed rate calculation for experimentSeed rate calculation for experiment
Seed rate calculation for experiment
 

Similar to SAS and R Code for Basic Statistics

SAS cheat sheet
SAS cheat sheetSAS cheat sheet
SAS cheat sheetAli Ajouz
 
Introduction to SAS Data Set Options
Introduction to SAS Data Set OptionsIntroduction to SAS Data Set Options
Introduction to SAS Data Set OptionsMark Tabladillo
 
Apache Spark - Loading & Saving data | Big Data Hadoop Spark Tutorial | Cloud...
Apache Spark - Loading & Saving data | Big Data Hadoop Spark Tutorial | Cloud...Apache Spark - Loading & Saving data | Big Data Hadoop Spark Tutorial | Cloud...
Apache Spark - Loading & Saving data | Big Data Hadoop Spark Tutorial | Cloud...CloudxLab
 
Bringing OpenClinica Data into SAS
Bringing OpenClinica Data into SASBringing OpenClinica Data into SAS
Bringing OpenClinica Data into SASRick Watts
 
Data Science Academy Student Demo day--Michael blecher,the importance of clea...
Data Science Academy Student Demo day--Michael blecher,the importance of clea...Data Science Academy Student Demo day--Michael blecher,the importance of clea...
Data Science Academy Student Demo day--Michael blecher,the importance of clea...Vivian S. Zhang
 
Comparing EDA with classical and Bayesian analysis.pptx
Comparing EDA with classical and Bayesian analysis.pptxComparing EDA with classical and Bayesian analysis.pptx
Comparing EDA with classical and Bayesian analysis.pptxPremaGanesh1
 
HEPData Open Repositories 2016 Talk
HEPData Open Repositories 2016 TalkHEPData Open Repositories 2016 Talk
HEPData Open Repositories 2016 TalkEamonn Maguire
 
How PROC SQL and SAS® Macro Programming Made My Statistical Analysis Easy? A ...
How PROC SQL and SAS® Macro Programming Made My Statistical Analysis Easy? A ...How PROC SQL and SAS® Macro Programming Made My Statistical Analysis Easy? A ...
How PROC SQL and SAS® Macro Programming Made My Statistical Analysis Easy? A ...Venu Perla
 
Introduction to Python , Overview
Introduction to Python , OverviewIntroduction to Python , Overview
Introduction to Python , OverviewNB Veeresh
 
Learning spark ch05 - Loading and Saving Your Data
Learning spark ch05 - Loading and Saving Your DataLearning spark ch05 - Loading and Saving Your Data
Learning spark ch05 - Loading and Saving Your Dataphanleson
 
Unit 4_Working with Graphs _python (2).pptx
Unit 4_Working with Graphs _python (2).pptxUnit 4_Working with Graphs _python (2).pptx
Unit 4_Working with Graphs _python (2).pptxprakashvs7
 
20130215 Reading data into R
20130215 Reading data into R20130215 Reading data into R
20130215 Reading data into RKazuki Yoshida
 
4-Introduction to Machine Learning Lecture # 4.pdf
4-Introduction to Machine Learning Lecture # 4.pdf4-Introduction to Machine Learning Lecture # 4.pdf
4-Introduction to Machine Learning Lecture # 4.pdfssuser47ab7b2
 
Session 04 pig - slides
Session 04   pig - slidesSession 04   pig - slides
Session 04 pig - slidesAnandMHadoop
 
Sas-training-in-mumbai
Sas-training-in-mumbaiSas-training-in-mumbai
Sas-training-in-mumbaiUnmesh Baile
 

Similar to SAS and R Code for Basic Statistics (20)

PheWAS-package.pdf
PheWAS-package.pdfPheWAS-package.pdf
PheWAS-package.pdf
 
SAS cheat sheet
SAS cheat sheetSAS cheat sheet
SAS cheat sheet
 
Introduction to SAS Data Set Options
Introduction to SAS Data Set OptionsIntroduction to SAS Data Set Options
Introduction to SAS Data Set Options
 
Apache Spark - Loading & Saving data | Big Data Hadoop Spark Tutorial | Cloud...
Apache Spark - Loading & Saving data | Big Data Hadoop Spark Tutorial | Cloud...Apache Spark - Loading & Saving data | Big Data Hadoop Spark Tutorial | Cloud...
Apache Spark - Loading & Saving data | Big Data Hadoop Spark Tutorial | Cloud...
 
Bringing OpenClinica Data into SAS
Bringing OpenClinica Data into SASBringing OpenClinica Data into SAS
Bringing OpenClinica Data into SAS
 
User biglm
User biglmUser biglm
User biglm
 
Data Science Academy Student Demo day--Michael blecher,the importance of clea...
Data Science Academy Student Demo day--Michael blecher,the importance of clea...Data Science Academy Student Demo day--Michael blecher,the importance of clea...
Data Science Academy Student Demo day--Michael blecher,the importance of clea...
 
Comparing EDA with classical and Bayesian analysis.pptx
Comparing EDA with classical and Bayesian analysis.pptxComparing EDA with classical and Bayesian analysis.pptx
Comparing EDA with classical and Bayesian analysis.pptx
 
HEPData Open Repositories 2016 Talk
HEPData Open Repositories 2016 TalkHEPData Open Repositories 2016 Talk
HEPData Open Repositories 2016 Talk
 
How PROC SQL and SAS® Macro Programming Made My Statistical Analysis Easy? A ...
How PROC SQL and SAS® Macro Programming Made My Statistical Analysis Easy? A ...How PROC SQL and SAS® Macro Programming Made My Statistical Analysis Easy? A ...
How PROC SQL and SAS® Macro Programming Made My Statistical Analysis Easy? A ...
 
Introduction to Python , Overview
Introduction to Python , OverviewIntroduction to Python , Overview
Introduction to Python , Overview
 
Data Management in Python
Data Management in PythonData Management in Python
Data Management in Python
 
Learning spark ch05 - Loading and Saving Your Data
Learning spark ch05 - Loading and Saving Your DataLearning spark ch05 - Loading and Saving Your Data
Learning spark ch05 - Loading and Saving Your Data
 
Unit 4_Working with Graphs _python (2).pptx
Unit 4_Working with Graphs _python (2).pptxUnit 4_Working with Graphs _python (2).pptx
Unit 4_Working with Graphs _python (2).pptx
 
20130215 Reading data into R
20130215 Reading data into R20130215 Reading data into R
20130215 Reading data into R
 
4-Introduction to Machine Learning Lecture # 4.pdf
4-Introduction to Machine Learning Lecture # 4.pdf4-Introduction to Machine Learning Lecture # 4.pdf
4-Introduction to Machine Learning Lecture # 4.pdf
 
Session 04 pig - slides
Session 04   pig - slidesSession 04   pig - slides
Session 04 pig - slides
 
Perl tutorial final
Perl tutorial finalPerl tutorial final
Perl tutorial final
 
Sas-training-in-mumbai
Sas-training-in-mumbaiSas-training-in-mumbai
Sas-training-in-mumbai
 
HEPData workshop talk
HEPData workshop talkHEPData workshop talk
HEPData workshop talk
 

More from Avjinder (Avi) Kaler

Unleashing Real-World Simulations: A Python Tutorial by Avjinder Kaler
Unleashing Real-World Simulations: A Python Tutorial by Avjinder KalerUnleashing Real-World Simulations: A Python Tutorial by Avjinder Kaler
Unleashing Real-World Simulations: A Python Tutorial by Avjinder KalerAvjinder (Avi) Kaler
 
Tutorial for Deep Learning Project with Keras
Tutorial for Deep Learning Project  with KerasTutorial for Deep Learning Project  with Keras
Tutorial for Deep Learning Project with KerasAvjinder (Avi) Kaler
 
Tutorial for DBSCAN Clustering in Machine Learning
Tutorial for DBSCAN Clustering in Machine LearningTutorial for DBSCAN Clustering in Machine Learning
Tutorial for DBSCAN Clustering in Machine LearningAvjinder (Avi) Kaler
 
Python Code for Classification Supervised Machine Learning.pdf
Python Code for Classification Supervised Machine Learning.pdfPython Code for Classification Supervised Machine Learning.pdf
Python Code for Classification Supervised Machine Learning.pdfAvjinder (Avi) Kaler
 
Sql tutorial for select, where, order by, null, insert functions
Sql tutorial for select, where, order by, null, insert functionsSql tutorial for select, where, order by, null, insert functions
Sql tutorial for select, where, order by, null, insert functionsAvjinder (Avi) Kaler
 
Association mapping identifies loci for canopy coverage in diverse soybean ge...
Association mapping identifies loci for canopy coverage in diverse soybean ge...Association mapping identifies loci for canopy coverage in diverse soybean ge...
Association mapping identifies loci for canopy coverage in diverse soybean ge...Avjinder (Avi) Kaler
 

More from Avjinder (Avi) Kaler (18)

Unleashing Real-World Simulations: A Python Tutorial by Avjinder Kaler
Unleashing Real-World Simulations: A Python Tutorial by Avjinder KalerUnleashing Real-World Simulations: A Python Tutorial by Avjinder Kaler
Unleashing Real-World Simulations: A Python Tutorial by Avjinder Kaler
 
Tutorial for Deep Learning Project with Keras
Tutorial for Deep Learning Project  with KerasTutorial for Deep Learning Project  with Keras
Tutorial for Deep Learning Project with Keras
 
Tutorial for DBSCAN Clustering in Machine Learning
Tutorial for DBSCAN Clustering in Machine LearningTutorial for DBSCAN Clustering in Machine Learning
Tutorial for DBSCAN Clustering in Machine Learning
 
Python Code for Classification Supervised Machine Learning.pdf
Python Code for Classification Supervised Machine Learning.pdfPython Code for Classification Supervised Machine Learning.pdf
Python Code for Classification Supervised Machine Learning.pdf
 
Sql tutorial for select, where, order by, null, insert functions
Sql tutorial for select, where, order by, null, insert functionsSql tutorial for select, where, order by, null, insert functions
Sql tutorial for select, where, order by, null, insert functions
 
Kaler et al 2018 euphytica
Kaler et al 2018 euphyticaKaler et al 2018 euphytica
Kaler et al 2018 euphytica
 
Association mapping identifies loci for canopy coverage in diverse soybean ge...
Association mapping identifies loci for canopy coverage in diverse soybean ge...Association mapping identifies loci for canopy coverage in diverse soybean ge...
Association mapping identifies loci for canopy coverage in diverse soybean ge...
 
Genome wide association mapping
Genome wide association mappingGenome wide association mapping
Genome wide association mapping
 
Population genetics
Population geneticsPopulation genetics
Population genetics
 
Quantitative genetics
Quantitative geneticsQuantitative genetics
Quantitative genetics
 
Abiotic stresses in plant
Abiotic stresses in plantAbiotic stresses in plant
Abiotic stresses in plant
 
Multiple linear regression
Multiple linear regressionMultiple linear regression
Multiple linear regression
 
Correlation in Statistics
Correlation in StatisticsCorrelation in Statistics
Correlation in Statistics
 
Simple linear regression
Simple linear regressionSimple linear regression
Simple linear regression
 
Analysis of Variance (ANOVA)
Analysis of Variance (ANOVA)Analysis of Variance (ANOVA)
Analysis of Variance (ANOVA)
 
Population and sample mean
Population and sample meanPopulation and sample mean
Population and sample mean
 
Descriptive statistics and graphs
Descriptive statistics and graphsDescriptive statistics and graphs
Descriptive statistics and graphs
 
Hypothesis and Test
Hypothesis and TestHypothesis and Test
Hypothesis and Test
 

Recently uploaded

ECONOMIC CONTEXT - LONG FORM TV DRAMA - PPT
ECONOMIC CONTEXT - LONG FORM TV DRAMA - PPTECONOMIC CONTEXT - LONG FORM TV DRAMA - PPT
ECONOMIC CONTEXT - LONG FORM TV DRAMA - PPTiammrhaywood
 
BASLIQ CURRENT LOOKBOOK LOOKBOOK(1) (1).pdf
BASLIQ CURRENT LOOKBOOK  LOOKBOOK(1) (1).pdfBASLIQ CURRENT LOOKBOOK  LOOKBOOK(1) (1).pdf
BASLIQ CURRENT LOOKBOOK LOOKBOOK(1) (1).pdfSoniaTolstoy
 
Concept of Vouching. B.Com(Hons) /B.Compdf
Concept of Vouching. B.Com(Hons) /B.CompdfConcept of Vouching. B.Com(Hons) /B.Compdf
Concept of Vouching. B.Com(Hons) /B.CompdfUmakantAnnand
 
“Oh GOSH! Reflecting on Hackteria's Collaborative Practices in a Global Do-It...
“Oh GOSH! Reflecting on Hackteria's Collaborative Practices in a Global Do-It...“Oh GOSH! Reflecting on Hackteria's Collaborative Practices in a Global Do-It...
“Oh GOSH! Reflecting on Hackteria's Collaborative Practices in a Global Do-It...Marc Dusseiller Dusjagr
 
URLs and Routing in the Odoo 17 Website App
URLs and Routing in the Odoo 17 Website AppURLs and Routing in the Odoo 17 Website App
URLs and Routing in the Odoo 17 Website AppCeline George
 
Accessible design: Minimum effort, maximum impact
Accessible design: Minimum effort, maximum impactAccessible design: Minimum effort, maximum impact
Accessible design: Minimum effort, maximum impactdawncurless
 
How to Make a Pirate ship Primary Education.pptx
How to Make a Pirate ship Primary Education.pptxHow to Make a Pirate ship Primary Education.pptx
How to Make a Pirate ship Primary Education.pptxmanuelaromero2013
 
Contemporary philippine arts from the regions_PPT_Module_12 [Autosaved] (1).pptx
Contemporary philippine arts from the regions_PPT_Module_12 [Autosaved] (1).pptxContemporary philippine arts from the regions_PPT_Module_12 [Autosaved] (1).pptx
Contemporary philippine arts from the regions_PPT_Module_12 [Autosaved] (1).pptxRoyAbrique
 
Kisan Call Centre - To harness potential of ICT in Agriculture by answer farm...
Kisan Call Centre - To harness potential of ICT in Agriculture by answer farm...Kisan Call Centre - To harness potential of ICT in Agriculture by answer farm...
Kisan Call Centre - To harness potential of ICT in Agriculture by answer farm...Krashi Coaching
 
Hybridoma Technology ( Production , Purification , and Application )
Hybridoma Technology  ( Production , Purification , and Application  ) Hybridoma Technology  ( Production , Purification , and Application  )
Hybridoma Technology ( Production , Purification , and Application ) Sakshi Ghasle
 
Introduction to AI in Higher Education_draft.pptx
Introduction to AI in Higher Education_draft.pptxIntroduction to AI in Higher Education_draft.pptx
Introduction to AI in Higher Education_draft.pptxpboyjonauth
 
Software Engineering Methodologies (overview)
Software Engineering Methodologies (overview)Software Engineering Methodologies (overview)
Software Engineering Methodologies (overview)eniolaolutunde
 
Incoming and Outgoing Shipments in 1 STEP Using Odoo 17
Incoming and Outgoing Shipments in 1 STEP Using Odoo 17Incoming and Outgoing Shipments in 1 STEP Using Odoo 17
Incoming and Outgoing Shipments in 1 STEP Using Odoo 17Celine George
 
call girls in Kamla Market (DELHI) 🔝 >༒9953330565🔝 genuine Escort Service 🔝✔️✔️
call girls in Kamla Market (DELHI) 🔝 >༒9953330565🔝 genuine Escort Service 🔝✔️✔️call girls in Kamla Market (DELHI) 🔝 >༒9953330565🔝 genuine Escort Service 🔝✔️✔️
call girls in Kamla Market (DELHI) 🔝 >༒9953330565🔝 genuine Escort Service 🔝✔️✔️9953056974 Low Rate Call Girls In Saket, Delhi NCR
 
Paris 2024 Olympic Geographies - an activity
Paris 2024 Olympic Geographies - an activityParis 2024 Olympic Geographies - an activity
Paris 2024 Olympic Geographies - an activityGeoBlogs
 
Presentation by Andreas Schleicher Tackling the School Absenteeism Crisis 30 ...
Presentation by Andreas Schleicher Tackling the School Absenteeism Crisis 30 ...Presentation by Andreas Schleicher Tackling the School Absenteeism Crisis 30 ...
Presentation by Andreas Schleicher Tackling the School Absenteeism Crisis 30 ...EduSkills OECD
 
How to Configure Email Server in Odoo 17
How to Configure Email Server in Odoo 17How to Configure Email Server in Odoo 17
How to Configure Email Server in Odoo 17Celine George
 
SOCIAL AND HISTORICAL CONTEXT - LFTVD.pptx
SOCIAL AND HISTORICAL CONTEXT - LFTVD.pptxSOCIAL AND HISTORICAL CONTEXT - LFTVD.pptx
SOCIAL AND HISTORICAL CONTEXT - LFTVD.pptxiammrhaywood
 
The basics of sentences session 2pptx copy.pptx
The basics of sentences session 2pptx copy.pptxThe basics of sentences session 2pptx copy.pptx
The basics of sentences session 2pptx copy.pptxheathfieldcps1
 

Recently uploaded (20)

ECONOMIC CONTEXT - LONG FORM TV DRAMA - PPT
ECONOMIC CONTEXT - LONG FORM TV DRAMA - PPTECONOMIC CONTEXT - LONG FORM TV DRAMA - PPT
ECONOMIC CONTEXT - LONG FORM TV DRAMA - PPT
 
BASLIQ CURRENT LOOKBOOK LOOKBOOK(1) (1).pdf
BASLIQ CURRENT LOOKBOOK  LOOKBOOK(1) (1).pdfBASLIQ CURRENT LOOKBOOK  LOOKBOOK(1) (1).pdf
BASLIQ CURRENT LOOKBOOK LOOKBOOK(1) (1).pdf
 
Concept of Vouching. B.Com(Hons) /B.Compdf
Concept of Vouching. B.Com(Hons) /B.CompdfConcept of Vouching. B.Com(Hons) /B.Compdf
Concept of Vouching. B.Com(Hons) /B.Compdf
 
Staff of Color (SOC) Retention Efforts DDSD
Staff of Color (SOC) Retention Efforts DDSDStaff of Color (SOC) Retention Efforts DDSD
Staff of Color (SOC) Retention Efforts DDSD
 
“Oh GOSH! Reflecting on Hackteria's Collaborative Practices in a Global Do-It...
“Oh GOSH! Reflecting on Hackteria's Collaborative Practices in a Global Do-It...“Oh GOSH! Reflecting on Hackteria's Collaborative Practices in a Global Do-It...
“Oh GOSH! Reflecting on Hackteria's Collaborative Practices in a Global Do-It...
 
URLs and Routing in the Odoo 17 Website App
URLs and Routing in the Odoo 17 Website AppURLs and Routing in the Odoo 17 Website App
URLs and Routing in the Odoo 17 Website App
 
Accessible design: Minimum effort, maximum impact
Accessible design: Minimum effort, maximum impactAccessible design: Minimum effort, maximum impact
Accessible design: Minimum effort, maximum impact
 
How to Make a Pirate ship Primary Education.pptx
How to Make a Pirate ship Primary Education.pptxHow to Make a Pirate ship Primary Education.pptx
How to Make a Pirate ship Primary Education.pptx
 
Contemporary philippine arts from the regions_PPT_Module_12 [Autosaved] (1).pptx
Contemporary philippine arts from the regions_PPT_Module_12 [Autosaved] (1).pptxContemporary philippine arts from the regions_PPT_Module_12 [Autosaved] (1).pptx
Contemporary philippine arts from the regions_PPT_Module_12 [Autosaved] (1).pptx
 
Kisan Call Centre - To harness potential of ICT in Agriculture by answer farm...
Kisan Call Centre - To harness potential of ICT in Agriculture by answer farm...Kisan Call Centre - To harness potential of ICT in Agriculture by answer farm...
Kisan Call Centre - To harness potential of ICT in Agriculture by answer farm...
 
Hybridoma Technology ( Production , Purification , and Application )
Hybridoma Technology  ( Production , Purification , and Application  ) Hybridoma Technology  ( Production , Purification , and Application  )
Hybridoma Technology ( Production , Purification , and Application )
 
Introduction to AI in Higher Education_draft.pptx
Introduction to AI in Higher Education_draft.pptxIntroduction to AI in Higher Education_draft.pptx
Introduction to AI in Higher Education_draft.pptx
 
Software Engineering Methodologies (overview)
Software Engineering Methodologies (overview)Software Engineering Methodologies (overview)
Software Engineering Methodologies (overview)
 
Incoming and Outgoing Shipments in 1 STEP Using Odoo 17
Incoming and Outgoing Shipments in 1 STEP Using Odoo 17Incoming and Outgoing Shipments in 1 STEP Using Odoo 17
Incoming and Outgoing Shipments in 1 STEP Using Odoo 17
 
call girls in Kamla Market (DELHI) 🔝 >༒9953330565🔝 genuine Escort Service 🔝✔️✔️
call girls in Kamla Market (DELHI) 🔝 >༒9953330565🔝 genuine Escort Service 🔝✔️✔️call girls in Kamla Market (DELHI) 🔝 >༒9953330565🔝 genuine Escort Service 🔝✔️✔️
call girls in Kamla Market (DELHI) 🔝 >༒9953330565🔝 genuine Escort Service 🔝✔️✔️
 
Paris 2024 Olympic Geographies - an activity
Paris 2024 Olympic Geographies - an activityParis 2024 Olympic Geographies - an activity
Paris 2024 Olympic Geographies - an activity
 
Presentation by Andreas Schleicher Tackling the School Absenteeism Crisis 30 ...
Presentation by Andreas Schleicher Tackling the School Absenteeism Crisis 30 ...Presentation by Andreas Schleicher Tackling the School Absenteeism Crisis 30 ...
Presentation by Andreas Schleicher Tackling the School Absenteeism Crisis 30 ...
 
How to Configure Email Server in Odoo 17
How to Configure Email Server in Odoo 17How to Configure Email Server in Odoo 17
How to Configure Email Server in Odoo 17
 
SOCIAL AND HISTORICAL CONTEXT - LFTVD.pptx
SOCIAL AND HISTORICAL CONTEXT - LFTVD.pptxSOCIAL AND HISTORICAL CONTEXT - LFTVD.pptx
SOCIAL AND HISTORICAL CONTEXT - LFTVD.pptx
 
The basics of sentences session 2pptx copy.pptx
The basics of sentences session 2pptx copy.pptxThe basics of sentences session 2pptx copy.pptx
The basics of sentences session 2pptx copy.pptx
 

SAS and R Code for Basic Statistics

  • 1. SAS and R Code For Basic Statistics Avjinder Singh Kaler
  • 2. Table Content 1.Reading Data 2.Descriptive Statistics (DS) 3.Correlation and Covariance 4.Analysis of Variance (ANOVA) 5.Regression and Multiple Regression
  • 3. 1.Reading Data 1.SAS I. There are many way of data reading in SAS, but the most common one is Data data_name; data name used for file Input x y z; variables Datalines; 1 2 4 4 5 7 . . . Copy and paste data here ; Run; II. Data can be read from the folder of computer. data data_name; infile 'C:Avi soy.txt'; input GE ENV YIELD; run; filename avi 'C:Avi soy.txt'; data data_name; infile avi; input GE ENV YIELD; run; III. Data can be imported using the import option under File tab. 2.R > getwd() # get current working directory > setwd("C:/MyFolder") # set working directory First Set working directory to the folder where data is present If data is in text format, then data can be read as: I. mydata <- read.table(“data_name.txt”) If data is in csv format, then data can be read as: II. mydata <- read.csv(“data_name.csv”)
  • 4. 2. Descriptive Statistics 1.SAS Descriptive statistics in SAS can be computed using PROC UNIVARIATE PROC UNIVARIATE DATA=data_name; VAR yield; Descriptive statistics for variable By ENV; By Group Histogram; RUN; Other ways are PROC MEANS and PROC FREQ PROC FREQ DATA=data_name; TABLES yield ; RUN; PROC MEANS DATA=data_name; CLASS GE; VAR yield; RUN; 2.R Descriptive statistics in R can be computed by following ways; summary(mydata) There are some packages in R that can be loaded and used for DS such as Hmisc, pastecs, and psych . library(Hmisc) describe(mydata) library(pastecs) stat.desc(mydata) library(psych) describe(mydata) Note: First install these packages.
  • 5. 3. Correlation and Covariance There are different methods of correlations such as pearson, spearman or kendal. 1.SAS Correlation and covariance in SAS for different methods: proc corr cov data=data_name pearson spearman kendall hoeffding plots=all; var x y z; run; 2.R Correlation and covariance in R for different methods: cor(mydata, use= "complete.obs", method= pearson ) cov(mydata, use= "complete.obs", method= pearson ) Note: Here mydata is numeric data frame. Method can be changed. There are some packages that can be loaded such as Hmisc package. library(Hmisc) rcorr(mydata, type="pearson") # type can be pearson or spearman Correlation between two variables x and y cor(x,y)
  • 6. 4. Analysis of Variance (ANOVA) 1.SAS PROC ANOVA, PROC GLM, PROC MIXED, PROC GLIMMIX, and PROC HPMIXED can be used for ANOVA. Proc ANOVA for non-missing data. PROC GLM for fixed effect factors. PROC MIXED, PROC GLIMMIX, and PROC HPMIXED for random and fixed effect factors. Proc ANOVA/GLM data=data_name; Class factorvar; Model responsevar= factorvar; MEANS factorvars / BON T LSD TUKEY; Run; Proc MIXED/GLIMMIX/HPMIXED data=data_name; Class factorvar; Model responsevar= factorvar; Random factorvar; lsmeans A / adjust= BON T TUKEY; Run; Note: Select one model depending on your dataset. 2.R Analysis of variance (ANOVA) can be computed in R using: x <- aov(responvar ~ factorvar, data=mydata) #CBD x <- aov(y ~ A + B, data=mydata) #RCBD x <- aov(y ~ A + B + A:B, data=mydata) #factorial design summary(x) Multiple comparisons TukeyHSD(x)
  • 7. 5. Regression and Multiple Regressions 1.SAS Simple Regression Proc reg data=data_name; model response_var = factor_var1; run; Multiple Regression Proc reg data=data_name; model response_var = factor_var1 factor_var2 factor_var3 factor_var4 ; run; 2.R Multiple Linear Regression x<- lm(y ~ x1 + x2 + x3, data=mydata) summary(fit) # show results