SlideShare a Scribd company logo
1 of 16
Download to read offline
February 2022 Monthly Snapshot
One-Year Change in One-Year Change in
Median Sales Price Single
Family
Median Sales Price
Condo/TIC/Coop
2
3
4
5
6
7
8
9
10
11
12
13
14
15
16
Monthly Indicators
+ 17.9% + 2.8% + 7.7%
One-Year Change in
The U.S. real estate market remains hot ahead of the spring selling season, with
existing home sales up 6.7% as of last measure, according to the National
Association of REALTORS®. Experts attribute the growth in sales to an uptick
in mortgage interest rates, as buyers rushed to lock down their home purchases
before rates move higher. Mortgage rates have increased almost a full
percentage point since December, with the average 30-year fixed-rate
mortgage briefly exceeding 4% in February, the highest level since May 2019.
New Listings were down 32.4 percent for single family homes and 26.5 percent
for Condo/TIC/Coop properties. Pending Sales decreased 4.9 percent for single
family homes and 25.5 percent for Condo/TIC/Coop properties.
The Median Sales Price was up 17.9 percent to $1,945,000 for single family
homes and 2.8 percent to $1,230,000 for Condo/TIC/Coop properties. Months
Supply of Inventory decreased 50.0 percent for single family units and 50.8
percent for Condo/TIC/Coop units.
Inventory was at an all-time low of 860,000 as February began, down 17% from
a year ago and equivalent to 1.6 months supply. According to Lawrence Yun,
Chief Economist at the National Association of REALTORS®, much of the
current housing supply is concentrated at the upper end of the market, where
inventory is increasing, while homes priced at the lower end of the market are
quickly disappearing, leaving many first-time buyers behind. The shortage of
homes is boosting demand even further, and with bidding wars common in
many markets, it’s no surprise sales prices continue to soar.
Median Sales Price
All Property Types
Residential real estate activity in San Francisco County (Districts 1-10)
composed of single-family properties, townhomes and condominiums. Percent
changes are calculated using rounded figures.
Single Family Activity Overview
Months Supply of Inventory
For questions or more information, contact
communications@sfrealtors.com.
Current as of March 11, 2022. All data from the San Francisco Association of REALTORS® MLS. Report © 2022 ShowingTime.
Condo/TIC/Coop Activity Overview
Inventory of Active Listings
% of Properties Sold Over List Price
% of List Price Received
Housing Affordability Ratio
All Properties Activity Overview
New Listings
Pending Sales
Sold Listings
Median Sales Price
Average Sales Price
Days on Market Until Sale
Activity by District
Single Family Activity Overview
Key metrics by report month and for year-to-date (YTD) starting from the first of the year.
Key Metrics Historical Sparkbars 2-2021 2-2022 Percent Change YTD 2021 YTD 2022 Percent Change
Current as of March 11, 2022. All data from the San Francisco Association of REALTORS® MLS. Report © 2022 ShowingTime. | 2
Months Supply 2.8 1.4 - 50.0% -- -- --
Affordability Ratio 33 27 - 18.2%
% of List Price Received 109.7% 121.3% + 10.6% 107.5%
34
82.1% + 30.3%
+ 11.3%
28 - 17.6%
119.7%
% of Properties Sold Over List Price 68.1% 87.2% + 28.0% 63.0%
Active Listings 628 357 - 43.2% --
Avg. Sales Price $2,257,454 $2,402,602 + 6.4% $2,102,627
Days on Market 30 19 - 36.7% 33 28 - 15.2%
$2,210,127
-- --
Median Sales Price $1,650,000 $1,945,000 + 17.9% $1,600,000
Sold Listings 163 156 - 4.3% 324
New Listings 306 207 - 32.4% 563
Pending Sales 225 214 - 4.9% - 9.6%
395 357
- 22.7%
435
285 - 12.0%
$1,820,000 + 13.8%
+ 5.1%
2-2019 2-2020 2-2021 2-2022
2-2019 2-2020 2-2021 2-2022
2-2019 2-2020 2-2021 2-2022
2-2019 2-2020 2-2021 2-2022
2-2019 2-2020 2-2021 2-2022
2-2019 2-2020 2-2021 2-2022
2-2019 2-2020 2-2021 2-2022
2-2019 2-2020 2-2021 2-2022
2-2019 2-2020 2-2021 2-2022
2-2019 2-2020 2-2021 2-2022
2-2019 2-2020 2-2021 2-2022
Condo/TIC/Coop Activity Overview
Key metrics by report month and for year-to-date (YTD) starting from the first of the year.
Key Metrics Historical Sparkbars 2-2021 2-2022 Percent Change YTD 2021 YTD 2022 Percent Change
Current as of March 11, 2022. All data from the San Francisco Association of REALTORS® MLS. Report © 2022 ShowingTime. | 3
Months Supply 6.1 3.0 - 50.8% -- -- --
Affordability Ratio 53 49 - 7.5%
% of List Price Received 100.7% 106.1% + 5.4% 99.7%
56
49.9% + 74.5%
+ 4.2%
51 - 8.9%
103.9%
% of Properties Sold Over List Price 35.3% 58.7% + 66.3% 28.6%
Active Listings 1,591 1,085 - 31.8% --
Avg. Sales Price $1,344,643 $1,400,333 + 4.1% $1,278,817
Days on Market 62 34 - 45.2% 66
$1,195,000 + 5.3%
+ 6.7%
46 - 30.3%
$1,364,622
-- --
Sold Listings 278 249 - 10.4% 548 433 - 21.0%
Median Sales Price $1,196,500 $1,230,000 + 2.8% $1,135,000
- 21.8%
Pending Sales 381 284 - 25.5% 673 536 - 20.4%
New Listings 502 369 - 26.5% 1,036 810
2-2019 2-2020 2-2021 2-2022
2-2019 2-2020 2-2021 2-2022
2-2019 2-2020 2-2021 2-2022
2-2019 2-2020 2-2021 2-2022
2-2019 2-2020 2-2021 2-2022
2-2019 2-2020 2-2021 2-2022
2-2019 2-2020 2-2021 2-2022
2-2019 2-2020 2-2021 2-2022
2-2019 2-2020 2-2021 2-2022
2-2019 2-2020 2-2021 2-2022
2-2019 2-2020 2-2021 2-2022
New Listings
New Listings
Single
Family
Year-Over-Year
Change
Condo/TIC/
Coop
Year-Over-Year
Change
Mar-2021 345 +98.3% 619 +142.7%
Apr-2021 351 +99.4% 514 +123.5%
May-2021 313 +13.8% 525 +4.2%
Jun-2021 324 -9.7% 494 -14.5%
Jul-2021 301 -26.0% 425 -39.1%
Aug-2021 301 -15.0% 436 -33.1%
Sep-2021 373 +5.1% 584 -12.3%
Oct-2021 267 -28.2% 454 -12.9%
Nov-2021 156 -35.5% 267 +4.7%
Dec-2021 95 -35.8% 196 -21.0%
Jan-2022 228 -11.3% 441 -17.4%
Feb-2022 207 -32.4% 369 -26.5%
12-Month Avg 272 -4.8% 444 -5.7%
Historical New Listings by Month
Current as of March 11, 2022. All data from the San Francisco Association of REALTORS® MLS. Report © 2022 ShowingTime. | 4
A count of the properties that have been newly listed on the market in a given month.
272
406
306
502
207
369
Single Family Condo/TIC/Coop
February
0
200
400
600
800
1-2005 1-2006 1-2007 1-2008 1-2009 1-2010 1-2011 1-2012 1-2013 1-2014 1-2015 1-2016 1-2017 1-2018 1-2019 1-2020 1-2021 1-2022
Single Family Condo/TIC/Coop
531
788
563
1,036
435
810
Single Family Condo/TIC/Coop
Year to Date
2020 2021 2022
- 26.5%
+ 23.6%
- 32.4%
+ 12.5% + 31.5%
- 22.7%
+ 6.0% - 21.8%
2020 2021 2022 2020 2021 2022 2020 2021 2022
+ 27.1% + 15.9% + 15.7%
+ 31.0%
Pending Sales
Pending Sales
Single
Family
Year-Over-Year
Change
Condo/TIC/
Coop
Year-Over-Year
Change
Mar-2021 290 +68.6% 474 +157.6%
Apr-2021 286 +262.0% 479 +420.7%
May-2021 307 +89.5% 462 +225.4%
Jun-2021 275 +21.1% 390 +66.7%
Jul-2021 259 -6.2% 364 +50.4%
Aug-2021 226 -3.8% 316 -1.9%
Sep-2021 331 +17.8% 336 +9.8%
Oct-2021 274 -11.9% 404 +21.3%
Nov-2021 261 -15.0% 360 +20.0%
Dec-2021 129 -37.4% 225 -26.7%
Jan-2022 143 -15.9% 252 -13.7%
Feb-2022 214 -4.9% 284 -25.5%
12-Month Avg 250 +13.0% 362 +38.6%
Historical Pending Sales by Month
A count of the properties on which offers have been accepted in a given month.
Current as of March 11, 2022. All data from the San Francisco Association of REALTORS® MLS. Report © 2022 ShowingTime. | 5
148
227
225
381
214
284
Single Family Condo/TIC/Coop
February
0
100
200
300
400
500
1-2005 1-2006 1-2007 1-2008 1-2009 1-2010 1-2011 1-2012 1-2013 1-2014 1-2015 1-2016 1-2017 1-2018 1-2019 1-2020 1-2021 1-2022
Single Family Condo/TIC/Coop
266
388
395
673
357
536
Single Family Condo/TIC/Coop
Year to Date
2020 2021 2022
- 25.5%
+ 67.8%
- 4.9%
+ 52.0% + 73.5%
- 9.6%
+ 48.5% - 20.4%
2020 2021 2022 2020 2021 2022 2020 2021 2022
- 9.2% + 3.1% + 9.3%
- 2.6%
Sold Listings
Sold Listings
Single
Family
Year-Over-Year
Change
Condo/TIC/
Coop
Year-Over-Year
Change
Mar-2021 270 +50.8% 457 +93.6%
Apr-2021 289 +140.8% 462 +294.9%
May-2021 266 +133.3% 444 +289.5%
Jun-2021 325 +79.6% 471 +166.1%
Jul-2021 255 +7.1% 371 +39.5%
Aug-2021 256 +5.3% 348 +45.0%
Sep-2021 245 -4.7% 291 -9.9%
Oct-2021 310 +1.6% 361 +23.6%
Nov-2021 293 +3.2% 424 +24.3%
Dec-2021 215 -28.8% 325 -7.9%
Jan-2022 129 -19.9% 184 -31.9%
Feb-2022 156 -4.3% 249 -10.4%
12-Month Avg 251 +18.1% 366 +45.9%
Historical Sold Listings by Month
A count of the actual sales that closed in a given month.
Current as of March 11, 2022. All data from the San Francisco Association of REALTORS® MLS. Report © 2022 ShowingTime. | 6
131
178
163
278
156
249
Single Family Condo/TIC/Coop
February
0
100
200
300
400
500
1-2005 1-2006 1-2007 1-2008 1-2009 1-2010 1-2011 1-2012 1-2013 1-2014 1-2015 1-2016 1-2017 1-2018 1-2019 1-2020 1-2021 1-2022
Single Family Condo/TIC/Coop
240
329
324
548
285
433
Single Family Condo/TIC/Coop
Year to Date
2020 2021 2022
- 10.4%
+ 56.2%
- 4.3%
+ 24.4% + 66.6%
- 12.0%
+ 35.0% - 21.0%
2020 2021 2022 2020 2021 2022 2020 2021 2022
+ 4.0% + 1.7% + 17.5%
+ 11.3%
Median Sales Price
Median Sales Price
Single
Family
Year-Over-Year
Change
Condo/TIC/
Coop
Year-Over-Year
Change
Mar-2021 $1,725,000 +9.5% $1,221,184 -2.3%
Apr-2021 $1,800,000 +12.1% $1,200,000 -5.9%
May-2021 $1,886,500 +18.8% $1,226,000 +12.7%
Jun-2021 $1,950,000 +12.7% $1,250,000 +2.0%
Jul-2021 $1,850,000 +15.3% $1,208,000 -4.2%
Aug-2021 $1,847,500 +13.7% $1,150,000 -5.0%
Sep-2021 $1,750,000 +6.1% $1,200,000 +2.1%
Oct-2021 $1,805,000 +12.5% $1,245,000 +8.0%
Nov-2021 $1,888,888 +15.4% $1,265,000 +7.9%
Dec-2021 $1,680,000 +8.4% $1,300,000 +18.2%
Jan-2022 $1,630,000 +3.5% $1,075,000 +0.2%
Feb-2022 $1,945,000 +17.9% $1,230,000 +2.8%
12-Month Avg* $1,825,000 +13.4% $1,225,000 +4.3%
Historical Median Sales Price by Month
Point at which half of the sales sold for more and half sold for less, not accounting for seller concessions, in a given month.
* Median Sales Price for all properties from March 2021 through February 2022. This is not the
average of the individual figures above.
Current as of March 11, 2022. All data from the San Francisco Association of REALTORS® MLS. Report © 2022 ShowingTime. | 7
$1,610,000
$1,260,000
$1,650,000
$1,196,500
$1,945,000
$1,230,000
Single Family Condo/TIC/Coop
February
$500,000
$750,000
$1,000,000
$1,250,000
$1,500,000
$1,750,000
$2,000,000
$2,250,000
1-2005 1-2006 1-2007 1-2008 1-2009 1-2010 1-2011 1-2012 1-2013 1-2014 1-2015 1-2016 1-2017 1-2018 1-2019 1-2020 1-2021 1-2022
Single Family Condo/TIC/Coop
$1,502,000
$1,190,000
$1,600,000
$1,135,000
$1,820,000
$1,195,000
Single Family Condo/TIC/Coop
Year to Date
2020 2021 2022
+ 2.8%
- 5.0%
+ 17.9%
+ 2.5% - 4.6%
+ 13.8%
+ 6.5% + 5.3%
2020 2021 2022 2020 2021 2022 2020 2021 2022
+ 9.7% + 6.3% + 10.1%
+ 14.6%
Average Sales Price
Average Sales
Price
Single
Family
Year-Over-Year
Change
Condo/TIC/
Coop
Year-Over-Year
Change
Mar-2021 $2,214,726 +9.2% $1,369,434 +0.2%
Apr-2021 $2,430,795 +11.3% $1,347,315 -0.0%
May-2021 $2,479,992 +32.1% $1,376,307 +10.0%
Jun-2021 $2,504,876 +13.8% $1,388,929 -1.9%
Jul-2021 $2,292,230 +13.8% $1,355,128 -3.0%
Aug-2021 $2,128,296 +7.1% $1,425,053 +7.4%
Sep-2021 $2,165,489 +14.2% $1,330,272 +1.9%
Oct-2021 $2,359,157 +23.7% $1,459,545 +16.5%
Nov-2021 $2,359,605 +15.9% $1,541,854 +21.3%
Dec-2021 $2,365,357 +17.5% $1,488,857 +16.2%
Jan-2022 $1,977,367 +1.6% $1,316,684 +8.7%
Feb-2022 $2,402,602 +6.4% $1,400,333 +4.1%
12-Month Avg* $2,324,788 +15.3% $1,402,967 +7.1%
Historical Average Sales Price by Month
Average sales price for all closed sales, not accounting for seller concessions, in a given month.
* Avg. Sales Price for all properties from March 2021 through February 2022. This is not the
average of the individual figures above.
Current as of March 11, 2022. All data from the San Francisco Association of REALTORS® MLS. Report © 2022 ShowingTime. | 8
$1,910,349
$1,351,412
$2,257,454
$1,344,643
$2,402,602
$1,400,333
Single Family Condo/TIC/Coop
February
$500,000
$1,000,000
$1,500,000
$2,000,000
$2,500,000
$3,000,000
1-2005 1-2006 1-2007 1-2008 1-2009 1-2010 1-2011 1-2012 1-2013 1-2014 1-2015 1-2016 1-2017 1-2018 1-2019 1-2020 1-2021 1-2022
Single Family Condo/TIC/Coop
$2,007,642
$1,313,251
$2,102,627
$1,278,817
$2,210,127
$1,364,622
Single Family Condo/TIC/Coop
Year to Date
2020 2021 2022
+ 4.1%
- 0.5%
+ 6.4%
+ 18.2% - 2.6%
+ 5.1%
+ 4.7% + 6.7%
2020 2021 2022 2020 2021 2022 2020 2021 2022
+ 6.1% + 15.3% + 3.1%
- 0.2%
Days on Market Until Sale
Days on Market
Until Sale
Single
Family
Year-Over-Year
Change
Condo/TIC/
Coop
Year-Over-Year
Change
Mar-2021 23 +9.5% 45 +66.7%
Apr-2021 19 -5.0% 45 +40.6%
May-2021 18 -25.0% 36 -10.0%
Jun-2021 17 -34.6% 35 +2.9%
Jul-2021 18 -28.0% 40 +5.3%
Aug-2021 24 0.0% 40 0.0%
Sep-2021 22 -12.0% 37 -17.8%
Oct-2021 19 -29.6% 34 -17.1%
Nov-2021 20 -39.4% 40 -20.0%
Dec-2021 30 -14.3% 45 -27.4%
Jan-2022 37 +2.8% 62 -11.4%
Feb-2022 19 -36.7% 34 -45.2%
12-Month Avg* 21 -23.0% 40 -14.5%
Historical Days on Market Until Sale by Month
Average number of days between when a property is listed and when an offer is accepted in a given month.
* Days on Market for all properties from March 2021 through February 2022. This is not the
average of the individual figures above.
Current as of March 11, 2022. All data from the San Francisco Association of REALTORS® MLS. Report © 2022 ShowingTime. | 9
25
28
30
62
19
34
Single Family Condo/TIC/Coop
February
0
20
40
60
80
100
120
1-2005 1-2006 1-2007 1-2008 1-2009 1-2010 1-2011 1-2012 1-2013 1-2014 1-2015 1-2016 1-2017 1-2018 1-2019 1-2020 1-2021 1-2022
Single Family Condo/TIC/Coop
30
43
33
66
28
46
Single Family Condo/TIC/Coop
Year to Date
2020 2021 2022
- 45.2%
+ 121.4%
- 36.7%
+ 20.0% + 53.5%
- 15.2%
+ 10.0% - 30.3%
2020 2021 2022 2020 2021 2022 2020 2021 2022
- 13.8% - 11.8% - 10.4%
- 31.7%
Inventory of Active Listings
Inventory of Active
Listings
Single
Family
Year-Over-Year
Change
Condo/TIC/
Coop
Year-Over-Year
Change
Mar-2021 634 +15.1% 1,581 +58.6%
Apr-2021 667 +9.7% 1,519 +41.8%
May-2021 636 -7.6% 1,494 +11.3%
Jun-2021 634 -19.0% 1,475 -5.8%
Jul-2021 639 -25.7% 1,444 -25.1%
Aug-2021 671 -27.4% 1,456 -30.9%
Sep-2021 666 -28.3% 1,597 -31.1%
Oct-2021 615 -33.7% 1,526 -35.1%
Nov-2021 477 -39.8% 1,319 -36.9%
Dec-2021 331 -43.5% 955 -36.4%
Jan-2022 393 -33.8% 1,081 -32.5%
Feb-2022 357 -43.2% 1,085 -31.8%
12-Month Avg* 560 -24.2% 1,378 -19.2%
Historical Inventory of Active Listings by Month
The number of properties available for sale in active status at the end of a given month.
* Active Listings for all properties from March 2021 through February 2022. This is not the
average of the individual figures above.
Current as of March 11, 2022. All data from the San Francisco Association of REALTORS® MLS. Report © 2022 ShowingTime. | 10
584
990
628
1,591
357
1,085
Single Family Condo/TIC/Coop
February
0
500
1,000
1,500
2,000
2,500
1-2005 1-2006 1-2007 1-2008 1-2009 1-2010 1-2011 1-2012 1-2013 1-2014 1-2015 1-2016 1-2017 1-2018 1-2019 1-2020 1-2021 1-2022
Single Family Condo/TIC/Coop
2020 2021 2022
- 31.8%
+ 60.7%
- 43.2%
+ 7.5%
2020 2021 2022
+ 8.6% + 16.9%
% of Properties Sold Over List Price
% of Properties
Sold Over List Price
Single
Family
Year-Over-Year
Change
Condo/TIC/
Coop
Year-Over-Year
Change
Mar-2021 74.1% -5.2% 42.9% -28.7%
Apr-2021 76.1% +8.7% 45.0% -24.7%
May-2021 79.7% +26.1% 53.4% +26.8%
Jun-2021 82.5% +49.5% 54.4% +74.9%
Jul-2021 83.5% +29.1% 55.8% +25.7%
Aug-2021 84.4% +28.3% 54.6% +59.6%
Sep-2021 84.5% +30.0% 54.6% +58.7%
Oct-2021 84.5% +25.2% 61.2% +43.0%
Nov-2021 79.5% +29.1% 55.4% +68.9%
Dec-2021 79.1% +25.8% 46.5% +62.6%
Jan-2022 76.0% +31.5% 38.0% +73.5%
Feb-2022 87.2% +28.0% 58.7% +66.3%
12-Month Avg 80.9% +24.8% 51.9% +39.2%
Historical % of Properties Sold Over List Price by Month
Percentage found when dividing the number of properties sold by properties sold over its original list price, not accounting for seller
concessions.
* % of Properties Sold Over List Price for all properties from March 2021 through February 2022.
This is not the average of the individual figures above.
Current as of March 11, 2022. All data from the San Francisco Association of REALTORS® MLS. Report © 2022 ShowingTime. | 11
73.3%
63.5%
68.1%
35.3%
87.2%
58.7%
Single Family Condo/TIC/Coop
February
0.0%
20.0%
40.0%
60.0%
80.0%
100.0%
1-2005 1-2006 1-2007 1-2008 1-2009 1-2010 1-2011 1-2012 1-2013 1-2014 1-2015 1-2016 1-2017 1-2018 1-2019 1-2020 1-2021 1-2022
Single Family Condo/TIC/Coop
68.5%
49.2%
63.0%
28.6%
82.1%
49.9%
Single Family Condo/TIC/Coop
Year to Date
2020 2021 2022
+ 66.3%
- 44.4%
+ 28.0%
- 7.1% - 41.9%
+ 30.3%
- 8.0% + 74.5%
2020 2021 2022 2020 2021 2022 2020 2021 2022
- 4.8% - 0.9% + 3.6%
+ 21.0%
% of List Price Received
% of List Price
Received
Single
Family
Year-Over-Year
Change
Condo/TIC/
Coop
Year-Over-Year
Change
Mar-2021 112.2% -1.7% 102.4% -1.6%
Apr-2021 113.8% +4.6% 103.7% -1.5%
May-2021 116.8% +10.4% 105.2% +4.8%
Jun-2021 116.3% +10.1% 105.3% +5.4%
Jul-2021 118.5% +11.8% 104.8% +3.8%
Aug-2021 116.1% +8.0% 104.3% +3.9%
Sep-2021 116.3% +8.9% 105.0% +4.8%
Oct-2021 117.0% +8.2% 105.6% +4.2%
Nov-2021 114.9% +8.4% 104.6% +4.4%
Dec-2021 114.4% +7.9% 103.5% +4.2%
Jan-2022 117.7% +11.8% 101.0% +2.3%
Feb-2022 121.3% +10.6% 106.1% +5.4%
12-Month Avg* 116.0% +8.1% 104.4% +3.6%
Historical % of List Price Received by Month
Percentage found when dividing a property’s sales price by its most recent list price, then taking the average for all properties sold in a given
month, not accounting for seller concessions.
* % of List Price Received for all properties from March 2021 through February 2022. This is not
the average of the individual figures above.
Current as of March 11, 2022. All data from the San Francisco Association of REALTORS® MLS. Report © 2022 ShowingTime. | 12
111.6%
105.2%
109.7%
100.7%
121.3%
106.1%
Single Family Condo/TIC/Coop
February
109.5%
103.0%
107.5%
99.7%
119.7%
103.9%
Single Family Condo/TIC/Coop
Year to Date
90.0%
100.0%
110.0%
120.0%
130.0%
1-2005 1-2006 1-2007 1-2008 1-2009 1-2010 1-2011 1-2012 1-2013 1-2014 1-2015 1-2016 1-2017 1-2018 1-2019 1-2020 1-2021 1-2022
Single Family Condo/TIC/Coop
2020 2021 2022
+ 5.4%
- 4.3%
+ 10.6%
- 1.7%
2020 2021 2022
- 1.0% + 1.3%
2020 2021 2022
+ 4.2%
- 3.2%
+ 11.3%
- 1.8%
2020 2021 2022
+ 0.1% + 0.3%
Housing Affordability Ratio
Housing
Affordability Ratio
Single
Family
Year-Over-Year
Change
Condo/TIC/
Coop
Year-Over-Year
Change
Mar-2021 32 -3.0% 52 +6.1%
Apr-2021 31 -8.8% 55 +7.8%
May-2021 30 -14.3% 54 -8.5%
Jun-2021 28 -12.5% 52 -3.7%
Jul-2021 30 -14.3% 55 +3.8%
Aug-2021 30 -14.3% 57 +1.8%
Sep-2021 32 -8.6% 55 -3.5%
Oct-2021 31 -13.9% 53 -10.2%
Nov-2021 30 -14.3% 54 -8.5%
Dec-2021 32 -13.5% 49 -21.0%
Jan-2022 32 -11.1% 57 -9.5%
Feb-2022 27 -18.2% 49 -7.5%
12-Month Avg* 30 -22.2% 53 -13.0%
Historical Housing Affordability Ratio by Month
This index measures housing affordability for the region. For example, an index of 120 means the median household income is 120% of what is
necessary to qualify for the median-priced home under prevailing interest rates. A higher number means greater affordability.
* Affordability Ratio for all properties from March 2021 through February 2022. This is not the
average of the individual figures above.
Current as of March 11, 2022. All data from the San Francisco Association of REALTORS® MLS. Report © 2022 ShowingTime. | 13
34
51
33
53
27
49
Single Family Condo/TIC/Coop
February
20
40
60
80
100
1-2005 1-2006 1-2007 1-2008 1-2009 1-2010 1-2011 1-2012 1-2013 1-2014 1-2015 1-2016 1-2017 1-2018 1-2019 1-2020 1-2021 1-2022
Single Family Condo/TIC/Coop
2020 2021 2022
- 7.5%
+ 3.9%
- 18.2%
- 2.9%
2020 2021 2022
0.0% - 1.9%
36
54
34
56
28
51
Single Family Condo/TIC/Coop
Year to Date
2020 2021 2022
- 8.9%
+ 3.7%
- 17.6%
- 5.6%
2020 2021 2022
+ 2.9% + 1.9%
Months Supply of Inventory
Months Supply of
Inventory
Single
Family
Year-Over-Year
Change
Condo/TIC/
Coop
Year-Over-Year
Change
Mar-2021 2.7 -3.6% 5.5 +31.0%
Apr-2021 2.7 -18.2% 4.8 -2.0%
May-2021 2.4 -38.5% 4.3 -35.8%
Jun-2021 2.4 -45.5% 4.1 -47.4%
Jul-2021 2.4 -48.9% 3.9 -58.9%
Aug-2021 2.6 -46.9% 4.0 -60.0%
Sep-2021 2.5 -47.9% 4.3 -59.4%
Oct-2021 2.3 -51.1% 4.1 -61.7%
Nov-2021 1.8 -53.8% 3.5 -62.4%
Dec-2021 1.3 -53.6% 2.6 -58.7%
Jan-2022 1.6 -42.9% 2.9 -54.7%
Feb-2022 1.4 -50.0% 3.0 -50.8%
12-Month Avg* 2.2 -42.7% 3.9 -49.3%
Historical Months Supply of Inventory by Month
The inventory of homes for sale at the end of a given month, divided by the average monthly pending sales from the last 12 months.
* Months Supply for all properties from March 2021 through February 2022. This is not the
average of the individual figures above.
Current as of March 11, 2022. All data from the San Francisco Association of REALTORS® MLS. Report © 2022 ShowingTime. | 14
2.9
4.0
2.8
6.1
1.4
3.0
Single Family Condo/TIC/Coop
February
0.0
2.0
4.0
6.0
8.0
10.0
12.0
1-2005 1-2006 1-2007 1-2008 1-2009 1-2010 1-2011 1-2012 1-2013 1-2014 1-2015 1-2016 1-2017 1-2018 1-2019 1-2020 1-2021 1-2022
Single Family Condo/TIC/Coop
2020 2021 2022
- 50.8%
+ 52.5%
- 50.0%
- 3.4%
2020 2021 2022
+ 11.5% + 17.6%
All Properties Activity Overview
Key metrics by report month and for year-to-date (YTD) starting from the first of the year.
Key Metrics Historical Sparkbars 2-2021 2-2022 Percent Change YTD 2021 YTD 2022 Percent Change
Current as of March 11, 2022. All data from the San Francisco Association of REALTORS® MLS. Report © 2022 ShowingTime. | 15
Months Supply 4.6 2.4 - 47.8% -- -- --
Affordability Ratio 38 34 - 10.5%
% of List Price Received 104.0% 111.9% + 7.6% 102.6%
41
62.6% + 51.6%
+ 7.3%
36 - 12.2%
110.1%
% of Properties Sold Over List Price 47.2% 69.7% + 47.7% 41.3%
Active Listings 2,256 1,474 - 34.7% --
Avg. Sales Price $1,681,125 $1,783,838 + 6.1% $1,590,583
Days on Market 51 28 - 45.1% 54
$1,408,000 + 8.9%
+ 6.6%
39 - 27.8%
$1,696,194
-- --
Sold Listings 447 408 - 8.7% 890 727 - 18.3%
Median Sales Price $1,349,500 $1,453,500 + 7.7% $1,292,500
- 22.3%
Pending Sales 609 504 - 17.2% 1,083 903 - 16.6%
New Listings 819 585 - 28.6% 1,617 1,257
2-2019 2-2020 2-2021 2-2022
2-2019 2-2020 2-2021 2-2022
2-2019 2-2020 2-2021 2-2022
2-2019 2-2020 2-2021 2-2022
2-2019 2-2020 2-2021 2-2022
2-2019 2-2020 2-2021 2-2022
2-2019 2-2020 2-2021 2-2022
2-2019 2-2020 2-2021 2-2022
2-2019 2-2020 2-2021 2-2022
2-2019 2-2020 2-2021 2-2022
2-2019 2-2020 2-2021 2-2022
Activity by District
SF District 1: Northwest (Sea Cliff, Lake, Jordan Park / Laurel Heights, Outer Richmond, Central Ric The U.S.
SF District 2: Central West (Outer Sunset, Central Sunset, Inner Sunset, Outer Parkside, Parkside, Inner Parkside, Golden Gate Heights)
SF District 3: Southwest (Pine Lake Park, Lake Shore, Merced Manor, Stonestown, Lakeside, Merced Heights, Ingleside, Ingleside Heights, Oceanview)
SF District 4: Twin Peaks W (Forest Hill (& Ext), W Portal, St Francis Wd, Balboa Terr, Mt Dav Manor, Ingleside Terr, Monterey Hts, Wstwd Pk & H'lnds, Shrwd Fst, Miraloma Pk, Dmnd Hts, Mdtwn Terr)
SF District 5: Central (Haight Ashbury, Cole Vly / Prnssus Hts, Clarndn Hts, Corona Hts, Twin Pks, Glen Pk, Noe Vly, Eureka Vly / Dolores Hts, Mission Dolores, Duboce Trngl, Buena Vista / Ashbury Hts)
SF District 6: Central North (Lower Pacific Heights, Anza Vista, Western Addition, North Panhandle, Alamo Square, Hayes Valley)
SF District 7: North (Marina, Cow Hollow, Presidio Heights, Pacific Heights)
SF District 8: Northeast (North Waterfront, North Beach, Russian Hill, Telegraph Hill, Nob Hill, Financial District / Barbary Coast, Downtown, Van Ness / Civic Center, Tenderloin)
SF District 9: Central East (Yerba Buena, South Beach, South of Market, Mission Bay, Inner Mission, Potrero Hill, Central Waterfront / Dogpatch, Bernal Heights)
SF District 10: Southeast (Outer Mission, Mission Terr, Excelsior, Portola, Bayview, Silver Terr, Hunters Pt, Candlestick Pt, Bayview Hts, Little Hollywood, Visitation Vly, Crocker Amazon)
2-2021 2-2022 + / – 2-2021 2-2022 + / – 2-2021 2-2022 + / – 2-2021 2-2022 + / – 2-2021 2-2022 + / –
Single Family
1 SF District 1 33 34 +3.0% 13 15 +15.4% $2,625,000 $2,505,000 -4.6% 25 30 +20.0% 1.8 1.7 -5.6%
2 SF District 2 72 41 -43.1% 24 33 +37.5% $1,407,500 $1,830,000 +30.0% 13 17 +30.8% 1.9 0.9 -52.6%
3 SF District 3 37 24 -35.1% 9 9 0.0% $1,260,000 $1,365,000 +8.3% 37 22 -40.5% 2.6 1.4 -46.2%
4 SF District 4 59 26 -55.9% 28 24 -14.3% $1,720,000 $2,650,000 +54.1% 26 19 -26.9% 1.8 0.7 -61.1%
5 SF District 5 127 47 -63.0% 30 26 -13.3% $2,700,000 $2,487,500 -7.9% 32 17 -46.9% 3.8 1.2 -68.4%
6 SF District 6 18 10 -44.4% 4 2 -50.0% $3,000,000 $1,425,000 -52.5% 38 8 -78.9% 3.5 2.1 -40.0%
7 SF District 7 57 32 -43.9% 6 6 0.0% $6,756,250 $4,706,250 -30.3% 12 31 +158.3% 6.8 2.4 -64.7%
8 SF District 8 19 22 +15.8% 1 1 0.0% $3,025,000 $815,000 -73.1% 14 10 -28.6% 8.6 7.9 -8.1%
9 SF District 9 96 48 -50.0% 17 11 -35.3% $1,700,000 $2,210,000 +30.0% 37 22 -40.5% 3.7 1.7 -54.1%
10 SF District 10 110 73 -33.6% 31 29 -6.5% $1,060,000 $1,350,000 +27.4% 46 15 -67.4% 2.6 1.6 -38.5%
Condo/TIC/Coop
1 SF District 1 59 36 -39.0% 14 10 -28.6% $1,100,000 $1,280,000 +16.4% 46 17 -63.0% 3.7 2.0 -45.9%
2 SF District 2 12 16 +33.3% 8 1 -87.5% $861,000 $1,250,000 +45.2% 20 0 -100.0% 2.3 3.0 +30.4%
3 SF District 3 11 4 -63.6% 3 2 -33.3% $827,500 $621,500 -24.9% 153 43 -71.9% 3.3 1.0 -69.7%
4 SF District 4 13 21 +61.5% 2 6 +200.0% $681,866 $870,000 +27.6% 108 26 -75.9% 2.7 4.2 +55.6%
5 SF District 5 146 86 -41.1% 43 38 -11.6% $1,430,000 $1,482,500 +3.7% 44 20 -54.5% 3.2 1.6 -50.0%
6 SF District 6 119 97 -18.5% 40 30 -25.0% $1,117,500 $1,327,500 +18.8% 59 31 -47.5% 3.8 2.5 -34.2%
7 SF District 7 154 78 -49.4% 35 23 -34.3% $1,602,500 $1,495,000 -6.7% 65 27 -58.5% 5.4 2.0 -63.0%
8 SF District 8 305 225 -26.2% 44 42 -4.5% $1,275,000 $1,000,000 -21.6% 77 41 -46.8% 7.7 3.5 -54.5%
9 SF District 9 723 476 -34.2% 84 91 +8.3% $1,100,000 $1,166,000 +6.0% 64 41 -35.9% 8.8 3.8 -56.8%
10 SF District 10 49 46 -6.1% 5 6 +20.0% $640,000 $910,000 +42.2% 66 32 -51.5% 8.3 5.7 -31.3%
Key metrics by report month for the districts of San Fransisco.
Current as of March 11, 2022. All data from the San Francisco Association of REALTORS® MLS. Report © 2022 ShowingTime. | 16
Active Listings Sold Listings Median Sales Price Days on Market Months Supply

More Related Content

Similar to San Francisco Market Report February 2022

San Francisco Market Report December 2021
San Francisco Market Report December 2021San Francisco Market Report December 2021
San Francisco Market Report December 2021Ronny Budiutama
 
San Francisco Market Report September 2022.pdf
San Francisco Market Report September 2022.pdfSan Francisco Market Report September 2022.pdf
San Francisco Market Report September 2022.pdfRonny Budiutama
 
San Francisco Market Report February 2023
San Francisco Market Report February 2023San Francisco Market Report February 2023
San Francisco Market Report February 2023Ronny Budiutama
 
San Francisco Market Report October 2022.pdf
San Francisco Market Report October 2022.pdfSan Francisco Market Report October 2022.pdf
San Francisco Market Report October 2022.pdfRonny Budiutama
 
San Francisco Market Report November 2022.pdf
San Francisco Market Report November 2022.pdfSan Francisco Market Report November 2022.pdf
San Francisco Market Report November 2022.pdfRonny Budiutama
 
San Francisco Market Report January 2023.pdf
San Francisco Market Report January 2023.pdfSan Francisco Market Report January 2023.pdf
San Francisco Market Report January 2023.pdfRonny Budiutama
 
San Francisco May 2023 Market Report.pdf
San Francisco May 2023 Market Report.pdfSan Francisco May 2023 Market Report.pdf
San Francisco May 2023 Market Report.pdfRonny Budiutama
 
San Francisco Market Report March 2023.pdf
San Francisco Market Report March 2023.pdfSan Francisco Market Report March 2023.pdf
San Francisco Market Report March 2023.pdfRonny Budiutama
 
San Francisco December 2023 Market Report
San Francisco December 2023 Market ReportSan Francisco December 2023 Market Report
San Francisco December 2023 Market ReportRonny Budiutama
 
San Francisco Market Report October 2021
San Francisco Market Report October 2021San Francisco Market Report October 2021
San Francisco Market Report October 2021Ronny Budiutama
 
San Francisco June 2023 Market Report.pdf
San Francisco June 2023 Market Report.pdfSan Francisco June 2023 Market Report.pdf
San Francisco June 2023 Market Report.pdfRonny Budiutama
 
San Francisco Market Report June 2021
San Francisco Market Report June 2021San Francisco Market Report June 2021
San Francisco Market Report June 2021Ronny Budiutama
 
October 2023 Report: San Francisco Real Estate Market Insights
October 2023 Report: San Francisco Real Estate Market InsightsOctober 2023 Report: San Francisco Real Estate Market Insights
October 2023 Report: San Francisco Real Estate Market InsightsRonny Budiutama
 
San Francisco Market Report February 2021
San Francisco Market Report February 2021San Francisco Market Report February 2021
San Francisco Market Report February 2021Ronny Budiutama
 
San Francisco Market Report November 2021
San Francisco Market Report November 2021San Francisco Market Report November 2021
San Francisco Market Report November 2021Ronny Budiutama
 
San Francisco Market Report September 2021
San Francisco Market Report September 2021San Francisco Market Report September 2021
San Francisco Market Report September 2021Ronny Budiutama
 
San Francisco Market Report August 2021
San Francisco Market Report August 2021San Francisco Market Report August 2021
San Francisco Market Report August 2021Ronny Budiutama
 
San Francisco market focus report December 2019
San Francisco market focus report December 2019San Francisco market focus report December 2019
San Francisco market focus report December 2019Ronny Budiutama
 
San Francisco November 2023 Market Report
San Francisco November 2023 Market ReportSan Francisco November 2023 Market Report
San Francisco November 2023 Market ReportRonny Budiutama
 
San Francisco Market Report For July 2021
San Francisco Market Report For July 2021San Francisco Market Report For July 2021
San Francisco Market Report For July 2021Ronny Budiutama
 

Similar to San Francisco Market Report February 2022 (20)

San Francisco Market Report December 2021
San Francisco Market Report December 2021San Francisco Market Report December 2021
San Francisco Market Report December 2021
 
San Francisco Market Report September 2022.pdf
San Francisco Market Report September 2022.pdfSan Francisco Market Report September 2022.pdf
San Francisco Market Report September 2022.pdf
 
San Francisco Market Report February 2023
San Francisco Market Report February 2023San Francisco Market Report February 2023
San Francisco Market Report February 2023
 
San Francisco Market Report October 2022.pdf
San Francisco Market Report October 2022.pdfSan Francisco Market Report October 2022.pdf
San Francisco Market Report October 2022.pdf
 
San Francisco Market Report November 2022.pdf
San Francisco Market Report November 2022.pdfSan Francisco Market Report November 2022.pdf
San Francisco Market Report November 2022.pdf
 
San Francisco Market Report January 2023.pdf
San Francisco Market Report January 2023.pdfSan Francisco Market Report January 2023.pdf
San Francisco Market Report January 2023.pdf
 
San Francisco May 2023 Market Report.pdf
San Francisco May 2023 Market Report.pdfSan Francisco May 2023 Market Report.pdf
San Francisco May 2023 Market Report.pdf
 
San Francisco Market Report March 2023.pdf
San Francisco Market Report March 2023.pdfSan Francisco Market Report March 2023.pdf
San Francisco Market Report March 2023.pdf
 
San Francisco December 2023 Market Report
San Francisco December 2023 Market ReportSan Francisco December 2023 Market Report
San Francisco December 2023 Market Report
 
San Francisco Market Report October 2021
San Francisco Market Report October 2021San Francisco Market Report October 2021
San Francisco Market Report October 2021
 
San Francisco June 2023 Market Report.pdf
San Francisco June 2023 Market Report.pdfSan Francisco June 2023 Market Report.pdf
San Francisco June 2023 Market Report.pdf
 
San Francisco Market Report June 2021
San Francisco Market Report June 2021San Francisco Market Report June 2021
San Francisco Market Report June 2021
 
October 2023 Report: San Francisco Real Estate Market Insights
October 2023 Report: San Francisco Real Estate Market InsightsOctober 2023 Report: San Francisco Real Estate Market Insights
October 2023 Report: San Francisco Real Estate Market Insights
 
San Francisco Market Report February 2021
San Francisco Market Report February 2021San Francisco Market Report February 2021
San Francisco Market Report February 2021
 
San Francisco Market Report November 2021
San Francisco Market Report November 2021San Francisco Market Report November 2021
San Francisco Market Report November 2021
 
San Francisco Market Report September 2021
San Francisco Market Report September 2021San Francisco Market Report September 2021
San Francisco Market Report September 2021
 
San Francisco Market Report August 2021
San Francisco Market Report August 2021San Francisco Market Report August 2021
San Francisco Market Report August 2021
 
San Francisco market focus report December 2019
San Francisco market focus report December 2019San Francisco market focus report December 2019
San Francisco market focus report December 2019
 
San Francisco November 2023 Market Report
San Francisco November 2023 Market ReportSan Francisco November 2023 Market Report
San Francisco November 2023 Market Report
 
San Francisco Market Report For July 2021
San Francisco Market Report For July 2021San Francisco Market Report For July 2021
San Francisco Market Report For July 2021
 

Recently uploaded

Call Girls in Model Town Delhi 💯Call Us 🔝8264348440🔝
Call Girls in Model Town Delhi 💯Call Us 🔝8264348440🔝Call Girls in Model Town Delhi 💯Call Us 🔝8264348440🔝
Call Girls in Model Town Delhi 💯Call Us 🔝8264348440🔝soniya singh
 
Call Girls in Nehru Place Delhi 💯Call Us 🔝8264348440🔝
Call Girls in Nehru Place Delhi 💯Call Us 🔝8264348440🔝Call Girls in Nehru Place Delhi 💯Call Us 🔝8264348440🔝
Call Girls in Nehru Place Delhi 💯Call Us 🔝8264348440🔝soniya singh
 
Shapoorji Pallonji Parkwest Sequoia Tower Bangalore.pdf
Shapoorji Pallonji Parkwest Sequoia Tower Bangalore.pdfShapoorji Pallonji Parkwest Sequoia Tower Bangalore.pdf
Shapoorji Pallonji Parkwest Sequoia Tower Bangalore.pdfashiyadav24
 
call girls in ganesh nagar Delhi 8264348440 ✅ call girls ❤️
call girls in ganesh nagar Delhi 8264348440 ✅ call girls ❤️call girls in ganesh nagar Delhi 8264348440 ✅ call girls ❤️
call girls in ganesh nagar Delhi 8264348440 ✅ call girls ❤️soniya singh
 
Aparna Greenscapes Kompally Hyderabad E - Brochure.pdf
Aparna Greenscapes Kompally Hyderabad E - Brochure.pdfAparna Greenscapes Kompally Hyderabad E - Brochure.pdf
Aparna Greenscapes Kompally Hyderabad E - Brochure.pdffaheemali990101
 
Low Rate Call Girls in Triveni Complex Delhi Call 9990771857
Low Rate Call Girls in Triveni Complex Delhi Call 9990771857Low Rate Call Girls in Triveni Complex Delhi Call 9990771857
Low Rate Call Girls in Triveni Complex Delhi Call 9990771857delhimodel235
 
9990771857 Call Girls in Noida Sector 03 Noida (Call Girls) Delhi
9990771857 Call Girls in Noida Sector 03 Noida (Call Girls) Delhi9990771857 Call Girls in Noida Sector 03 Noida (Call Girls) Delhi
9990771857 Call Girls in Noida Sector 03 Noida (Call Girls) Delhidelhimodel235
 
Call Girls in Pitampura Delhi 💯Call Us 🔝8264348440🔝
Call Girls in Pitampura Delhi 💯Call Us 🔝8264348440🔝Call Girls in Pitampura Delhi 💯Call Us 🔝8264348440🔝
Call Girls in Pitampura Delhi 💯Call Us 🔝8264348440🔝soniya singh
 
Call Girls In Vasant Vihar Delhi 💯Call Us 🔝8264348440🔝
Call Girls In Vasant Vihar Delhi 💯Call Us 🔝8264348440🔝Call Girls In Vasant Vihar Delhi 💯Call Us 🔝8264348440🔝
Call Girls In Vasant Vihar Delhi 💯Call Us 🔝8264348440🔝soniya singh
 
Call Girls in Sarai Kale Khan Delhi 💯Call Us 🔝8264348440🔝
Call Girls in Sarai Kale Khan Delhi 💯Call Us 🔝8264348440🔝Call Girls in Sarai Kale Khan Delhi 💯Call Us 🔝8264348440🔝
Call Girls in Sarai Kale Khan Delhi 💯Call Us 🔝8264348440🔝soniya singh
 
Magarpatta Nova Elegance Mundhwa Pune E-Brochure.pdf
Magarpatta Nova Elegance Mundhwa Pune  E-Brochure.pdfMagarpatta Nova Elegance Mundhwa Pune  E-Brochure.pdf
Magarpatta Nova Elegance Mundhwa Pune E-Brochure.pdfManishSaxena95
 
9990771857 Call Girls in Noida Sector 11 Noida (Call Girls) Delhi
9990771857 Call Girls in Noida Sector 11 Noida (Call Girls) Delhi9990771857 Call Girls in Noida Sector 11 Noida (Call Girls) Delhi
9990771857 Call Girls in Noida Sector 11 Noida (Call Girls) Delhidelhimodel235
 
Call Girls In Hari Nagar Dadb Block {8447779280}Hari Nagar {West Delhi Escort...
Call Girls In Hari Nagar Dadb Block {8447779280}Hari Nagar {West Delhi Escort...Call Girls In Hari Nagar Dadb Block {8447779280}Hari Nagar {West Delhi Escort...
Call Girls In Hari Nagar Dadb Block {8447779280}Hari Nagar {West Delhi Escort...asmaqueen5
 
9990771857 Call Girls in Noida Sector 06 Noida (Call Girls) Delhi
9990771857 Call Girls in Noida Sector 06 Noida (Call Girls) Delhi9990771857 Call Girls in Noida Sector 06 Noida (Call Girls) Delhi
9990771857 Call Girls in Noida Sector 06 Noida (Call Girls) Delhidelhimodel235
 
Call Girls in Inderpuri Delhi 💯Call Us 🔝8264348440🔝
Call Girls in Inderpuri Delhi 💯Call Us 🔝8264348440🔝Call Girls in Inderpuri Delhi 💯Call Us 🔝8264348440🔝
Call Girls in Inderpuri Delhi 💯Call Us 🔝8264348440🔝soniya singh
 
Nanke Area Estate commercial ( Dir. Kat Kuo)
Nanke Area Estate commercial ( Dir. Kat Kuo)Nanke Area Estate commercial ( Dir. Kat Kuo)
Nanke Area Estate commercial ( Dir. Kat Kuo)jessica288382
 
Model Call Girl in Shastri Nagar Delhi reach out to us at 🔝8264348440🔝
Model Call Girl in Shastri Nagar Delhi reach out to us at 🔝8264348440🔝Model Call Girl in Shastri Nagar Delhi reach out to us at 🔝8264348440🔝
Model Call Girl in Shastri Nagar Delhi reach out to us at 🔝8264348440🔝soniya singh
 
The Omaxe State Dwarka Delhi-broucher.pdf.pdf
The Omaxe State Dwarka Delhi-broucher.pdf.pdfThe Omaxe State Dwarka Delhi-broucher.pdf.pdf
The Omaxe State Dwarka Delhi-broucher.pdf.pdfkratirudram
 
Telibagh & Call Girls Lucknow - 450+ Call Girl Cash Payment 🎂 8923113531 🎪 Ne...
Telibagh & Call Girls Lucknow - 450+ Call Girl Cash Payment 🎂 8923113531 🎪 Ne...Telibagh & Call Girls Lucknow - 450+ Call Girl Cash Payment 🎂 8923113531 🎪 Ne...
Telibagh & Call Girls Lucknow - 450+ Call Girl Cash Payment 🎂 8923113531 🎪 Ne...gurkirankumar98700
 

Recently uploaded (20)

Call Girls in Model Town Delhi 💯Call Us 🔝8264348440🔝
Call Girls in Model Town Delhi 💯Call Us 🔝8264348440🔝Call Girls in Model Town Delhi 💯Call Us 🔝8264348440🔝
Call Girls in Model Town Delhi 💯Call Us 🔝8264348440🔝
 
Call Girls in Nehru Place Delhi 💯Call Us 🔝8264348440🔝
Call Girls in Nehru Place Delhi 💯Call Us 🔝8264348440🔝Call Girls in Nehru Place Delhi 💯Call Us 🔝8264348440🔝
Call Girls in Nehru Place Delhi 💯Call Us 🔝8264348440🔝
 
Shapoorji Pallonji Parkwest Sequoia Tower Bangalore.pdf
Shapoorji Pallonji Parkwest Sequoia Tower Bangalore.pdfShapoorji Pallonji Parkwest Sequoia Tower Bangalore.pdf
Shapoorji Pallonji Parkwest Sequoia Tower Bangalore.pdf
 
call girls in ganesh nagar Delhi 8264348440 ✅ call girls ❤️
call girls in ganesh nagar Delhi 8264348440 ✅ call girls ❤️call girls in ganesh nagar Delhi 8264348440 ✅ call girls ❤️
call girls in ganesh nagar Delhi 8264348440 ✅ call girls ❤️
 
Aparna Greenscapes Kompally Hyderabad E - Brochure.pdf
Aparna Greenscapes Kompally Hyderabad E - Brochure.pdfAparna Greenscapes Kompally Hyderabad E - Brochure.pdf
Aparna Greenscapes Kompally Hyderabad E - Brochure.pdf
 
Low Rate Call Girls in Triveni Complex Delhi Call 9990771857
Low Rate Call Girls in Triveni Complex Delhi Call 9990771857Low Rate Call Girls in Triveni Complex Delhi Call 9990771857
Low Rate Call Girls in Triveni Complex Delhi Call 9990771857
 
9990771857 Call Girls in Noida Sector 03 Noida (Call Girls) Delhi
9990771857 Call Girls in Noida Sector 03 Noida (Call Girls) Delhi9990771857 Call Girls in Noida Sector 03 Noida (Call Girls) Delhi
9990771857 Call Girls in Noida Sector 03 Noida (Call Girls) Delhi
 
Call Girls in Pitampura Delhi 💯Call Us 🔝8264348440🔝
Call Girls in Pitampura Delhi 💯Call Us 🔝8264348440🔝Call Girls in Pitampura Delhi 💯Call Us 🔝8264348440🔝
Call Girls in Pitampura Delhi 💯Call Us 🔝8264348440🔝
 
Call Girls In Vasant Vihar Delhi 💯Call Us 🔝8264348440🔝
Call Girls In Vasant Vihar Delhi 💯Call Us 🔝8264348440🔝Call Girls In Vasant Vihar Delhi 💯Call Us 🔝8264348440🔝
Call Girls In Vasant Vihar Delhi 💯Call Us 🔝8264348440🔝
 
Call Girls in Sarai Kale Khan Delhi 💯Call Us 🔝8264348440🔝
Call Girls in Sarai Kale Khan Delhi 💯Call Us 🔝8264348440🔝Call Girls in Sarai Kale Khan Delhi 💯Call Us 🔝8264348440🔝
Call Girls in Sarai Kale Khan Delhi 💯Call Us 🔝8264348440🔝
 
Low Rate Call Girls in Triveni Complex Delhi Call 9873940964
Low Rate Call Girls in Triveni Complex Delhi Call 9873940964Low Rate Call Girls in Triveni Complex Delhi Call 9873940964
Low Rate Call Girls in Triveni Complex Delhi Call 9873940964
 
Magarpatta Nova Elegance Mundhwa Pune E-Brochure.pdf
Magarpatta Nova Elegance Mundhwa Pune  E-Brochure.pdfMagarpatta Nova Elegance Mundhwa Pune  E-Brochure.pdf
Magarpatta Nova Elegance Mundhwa Pune E-Brochure.pdf
 
9990771857 Call Girls in Noida Sector 11 Noida (Call Girls) Delhi
9990771857 Call Girls in Noida Sector 11 Noida (Call Girls) Delhi9990771857 Call Girls in Noida Sector 11 Noida (Call Girls) Delhi
9990771857 Call Girls in Noida Sector 11 Noida (Call Girls) Delhi
 
Call Girls In Hari Nagar Dadb Block {8447779280}Hari Nagar {West Delhi Escort...
Call Girls In Hari Nagar Dadb Block {8447779280}Hari Nagar {West Delhi Escort...Call Girls In Hari Nagar Dadb Block {8447779280}Hari Nagar {West Delhi Escort...
Call Girls In Hari Nagar Dadb Block {8447779280}Hari Nagar {West Delhi Escort...
 
9990771857 Call Girls in Noida Sector 06 Noida (Call Girls) Delhi
9990771857 Call Girls in Noida Sector 06 Noida (Call Girls) Delhi9990771857 Call Girls in Noida Sector 06 Noida (Call Girls) Delhi
9990771857 Call Girls in Noida Sector 06 Noida (Call Girls) Delhi
 
Call Girls in Inderpuri Delhi 💯Call Us 🔝8264348440🔝
Call Girls in Inderpuri Delhi 💯Call Us 🔝8264348440🔝Call Girls in Inderpuri Delhi 💯Call Us 🔝8264348440🔝
Call Girls in Inderpuri Delhi 💯Call Us 🔝8264348440🔝
 
Nanke Area Estate commercial ( Dir. Kat Kuo)
Nanke Area Estate commercial ( Dir. Kat Kuo)Nanke Area Estate commercial ( Dir. Kat Kuo)
Nanke Area Estate commercial ( Dir. Kat Kuo)
 
Model Call Girl in Shastri Nagar Delhi reach out to us at 🔝8264348440🔝
Model Call Girl in Shastri Nagar Delhi reach out to us at 🔝8264348440🔝Model Call Girl in Shastri Nagar Delhi reach out to us at 🔝8264348440🔝
Model Call Girl in Shastri Nagar Delhi reach out to us at 🔝8264348440🔝
 
The Omaxe State Dwarka Delhi-broucher.pdf.pdf
The Omaxe State Dwarka Delhi-broucher.pdf.pdfThe Omaxe State Dwarka Delhi-broucher.pdf.pdf
The Omaxe State Dwarka Delhi-broucher.pdf.pdf
 
Telibagh & Call Girls Lucknow - 450+ Call Girl Cash Payment 🎂 8923113531 🎪 Ne...
Telibagh & Call Girls Lucknow - 450+ Call Girl Cash Payment 🎂 8923113531 🎪 Ne...Telibagh & Call Girls Lucknow - 450+ Call Girl Cash Payment 🎂 8923113531 🎪 Ne...
Telibagh & Call Girls Lucknow - 450+ Call Girl Cash Payment 🎂 8923113531 🎪 Ne...
 

San Francisco Market Report February 2022

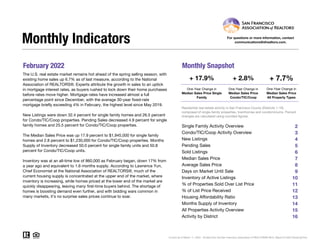
  • 1. February 2022 Monthly Snapshot One-Year Change in One-Year Change in Median Sales Price Single Family Median Sales Price Condo/TIC/Coop 2 3 4 5 6 7 8 9 10 11 12 13 14 15 16 Monthly Indicators + 17.9% + 2.8% + 7.7% One-Year Change in The U.S. real estate market remains hot ahead of the spring selling season, with existing home sales up 6.7% as of last measure, according to the National Association of REALTORS®. Experts attribute the growth in sales to an uptick in mortgage interest rates, as buyers rushed to lock down their home purchases before rates move higher. Mortgage rates have increased almost a full percentage point since December, with the average 30-year fixed-rate mortgage briefly exceeding 4% in February, the highest level since May 2019. New Listings were down 32.4 percent for single family homes and 26.5 percent for Condo/TIC/Coop properties. Pending Sales decreased 4.9 percent for single family homes and 25.5 percent for Condo/TIC/Coop properties. The Median Sales Price was up 17.9 percent to $1,945,000 for single family homes and 2.8 percent to $1,230,000 for Condo/TIC/Coop properties. Months Supply of Inventory decreased 50.0 percent for single family units and 50.8 percent for Condo/TIC/Coop units. Inventory was at an all-time low of 860,000 as February began, down 17% from a year ago and equivalent to 1.6 months supply. According to Lawrence Yun, Chief Economist at the National Association of REALTORS®, much of the current housing supply is concentrated at the upper end of the market, where inventory is increasing, while homes priced at the lower end of the market are quickly disappearing, leaving many first-time buyers behind. The shortage of homes is boosting demand even further, and with bidding wars common in many markets, it’s no surprise sales prices continue to soar. Median Sales Price All Property Types Residential real estate activity in San Francisco County (Districts 1-10) composed of single-family properties, townhomes and condominiums. Percent changes are calculated using rounded figures. Single Family Activity Overview Months Supply of Inventory For questions or more information, contact communications@sfrealtors.com. Current as of March 11, 2022. All data from the San Francisco Association of REALTORS® MLS. Report © 2022 ShowingTime. Condo/TIC/Coop Activity Overview Inventory of Active Listings % of Properties Sold Over List Price % of List Price Received Housing Affordability Ratio All Properties Activity Overview New Listings Pending Sales Sold Listings Median Sales Price Average Sales Price Days on Market Until Sale Activity by District
  • 2. Single Family Activity Overview Key metrics by report month and for year-to-date (YTD) starting from the first of the year. Key Metrics Historical Sparkbars 2-2021 2-2022 Percent Change YTD 2021 YTD 2022 Percent Change Current as of March 11, 2022. All data from the San Francisco Association of REALTORS® MLS. Report © 2022 ShowingTime. | 2 Months Supply 2.8 1.4 - 50.0% -- -- -- Affordability Ratio 33 27 - 18.2% % of List Price Received 109.7% 121.3% + 10.6% 107.5% 34 82.1% + 30.3% + 11.3% 28 - 17.6% 119.7% % of Properties Sold Over List Price 68.1% 87.2% + 28.0% 63.0% Active Listings 628 357 - 43.2% -- Avg. Sales Price $2,257,454 $2,402,602 + 6.4% $2,102,627 Days on Market 30 19 - 36.7% 33 28 - 15.2% $2,210,127 -- -- Median Sales Price $1,650,000 $1,945,000 + 17.9% $1,600,000 Sold Listings 163 156 - 4.3% 324 New Listings 306 207 - 32.4% 563 Pending Sales 225 214 - 4.9% - 9.6% 395 357 - 22.7% 435 285 - 12.0% $1,820,000 + 13.8% + 5.1% 2-2019 2-2020 2-2021 2-2022 2-2019 2-2020 2-2021 2-2022 2-2019 2-2020 2-2021 2-2022 2-2019 2-2020 2-2021 2-2022 2-2019 2-2020 2-2021 2-2022 2-2019 2-2020 2-2021 2-2022 2-2019 2-2020 2-2021 2-2022 2-2019 2-2020 2-2021 2-2022 2-2019 2-2020 2-2021 2-2022 2-2019 2-2020 2-2021 2-2022 2-2019 2-2020 2-2021 2-2022
  • 3. Condo/TIC/Coop Activity Overview Key metrics by report month and for year-to-date (YTD) starting from the first of the year. Key Metrics Historical Sparkbars 2-2021 2-2022 Percent Change YTD 2021 YTD 2022 Percent Change Current as of March 11, 2022. All data from the San Francisco Association of REALTORS® MLS. Report © 2022 ShowingTime. | 3 Months Supply 6.1 3.0 - 50.8% -- -- -- Affordability Ratio 53 49 - 7.5% % of List Price Received 100.7% 106.1% + 5.4% 99.7% 56 49.9% + 74.5% + 4.2% 51 - 8.9% 103.9% % of Properties Sold Over List Price 35.3% 58.7% + 66.3% 28.6% Active Listings 1,591 1,085 - 31.8% -- Avg. Sales Price $1,344,643 $1,400,333 + 4.1% $1,278,817 Days on Market 62 34 - 45.2% 66 $1,195,000 + 5.3% + 6.7% 46 - 30.3% $1,364,622 -- -- Sold Listings 278 249 - 10.4% 548 433 - 21.0% Median Sales Price $1,196,500 $1,230,000 + 2.8% $1,135,000 - 21.8% Pending Sales 381 284 - 25.5% 673 536 - 20.4% New Listings 502 369 - 26.5% 1,036 810 2-2019 2-2020 2-2021 2-2022 2-2019 2-2020 2-2021 2-2022 2-2019 2-2020 2-2021 2-2022 2-2019 2-2020 2-2021 2-2022 2-2019 2-2020 2-2021 2-2022 2-2019 2-2020 2-2021 2-2022 2-2019 2-2020 2-2021 2-2022 2-2019 2-2020 2-2021 2-2022 2-2019 2-2020 2-2021 2-2022 2-2019 2-2020 2-2021 2-2022 2-2019 2-2020 2-2021 2-2022
  • 4. New Listings New Listings Single Family Year-Over-Year Change Condo/TIC/ Coop Year-Over-Year Change Mar-2021 345 +98.3% 619 +142.7% Apr-2021 351 +99.4% 514 +123.5% May-2021 313 +13.8% 525 +4.2% Jun-2021 324 -9.7% 494 -14.5% Jul-2021 301 -26.0% 425 -39.1% Aug-2021 301 -15.0% 436 -33.1% Sep-2021 373 +5.1% 584 -12.3% Oct-2021 267 -28.2% 454 -12.9% Nov-2021 156 -35.5% 267 +4.7% Dec-2021 95 -35.8% 196 -21.0% Jan-2022 228 -11.3% 441 -17.4% Feb-2022 207 -32.4% 369 -26.5% 12-Month Avg 272 -4.8% 444 -5.7% Historical New Listings by Month Current as of March 11, 2022. All data from the San Francisco Association of REALTORS® MLS. Report © 2022 ShowingTime. | 4 A count of the properties that have been newly listed on the market in a given month. 272 406 306 502 207 369 Single Family Condo/TIC/Coop February 0 200 400 600 800 1-2005 1-2006 1-2007 1-2008 1-2009 1-2010 1-2011 1-2012 1-2013 1-2014 1-2015 1-2016 1-2017 1-2018 1-2019 1-2020 1-2021 1-2022 Single Family Condo/TIC/Coop 531 788 563 1,036 435 810 Single Family Condo/TIC/Coop Year to Date 2020 2021 2022 - 26.5% + 23.6% - 32.4% + 12.5% + 31.5% - 22.7% + 6.0% - 21.8% 2020 2021 2022 2020 2021 2022 2020 2021 2022 + 27.1% + 15.9% + 15.7% + 31.0%
  • 5. Pending Sales Pending Sales Single Family Year-Over-Year Change Condo/TIC/ Coop Year-Over-Year Change Mar-2021 290 +68.6% 474 +157.6% Apr-2021 286 +262.0% 479 +420.7% May-2021 307 +89.5% 462 +225.4% Jun-2021 275 +21.1% 390 +66.7% Jul-2021 259 -6.2% 364 +50.4% Aug-2021 226 -3.8% 316 -1.9% Sep-2021 331 +17.8% 336 +9.8% Oct-2021 274 -11.9% 404 +21.3% Nov-2021 261 -15.0% 360 +20.0% Dec-2021 129 -37.4% 225 -26.7% Jan-2022 143 -15.9% 252 -13.7% Feb-2022 214 -4.9% 284 -25.5% 12-Month Avg 250 +13.0% 362 +38.6% Historical Pending Sales by Month A count of the properties on which offers have been accepted in a given month. Current as of March 11, 2022. All data from the San Francisco Association of REALTORS® MLS. Report © 2022 ShowingTime. | 5 148 227 225 381 214 284 Single Family Condo/TIC/Coop February 0 100 200 300 400 500 1-2005 1-2006 1-2007 1-2008 1-2009 1-2010 1-2011 1-2012 1-2013 1-2014 1-2015 1-2016 1-2017 1-2018 1-2019 1-2020 1-2021 1-2022 Single Family Condo/TIC/Coop 266 388 395 673 357 536 Single Family Condo/TIC/Coop Year to Date 2020 2021 2022 - 25.5% + 67.8% - 4.9% + 52.0% + 73.5% - 9.6% + 48.5% - 20.4% 2020 2021 2022 2020 2021 2022 2020 2021 2022 - 9.2% + 3.1% + 9.3% - 2.6%
  • 6. Sold Listings Sold Listings Single Family Year-Over-Year Change Condo/TIC/ Coop Year-Over-Year Change Mar-2021 270 +50.8% 457 +93.6% Apr-2021 289 +140.8% 462 +294.9% May-2021 266 +133.3% 444 +289.5% Jun-2021 325 +79.6% 471 +166.1% Jul-2021 255 +7.1% 371 +39.5% Aug-2021 256 +5.3% 348 +45.0% Sep-2021 245 -4.7% 291 -9.9% Oct-2021 310 +1.6% 361 +23.6% Nov-2021 293 +3.2% 424 +24.3% Dec-2021 215 -28.8% 325 -7.9% Jan-2022 129 -19.9% 184 -31.9% Feb-2022 156 -4.3% 249 -10.4% 12-Month Avg 251 +18.1% 366 +45.9% Historical Sold Listings by Month A count of the actual sales that closed in a given month. Current as of March 11, 2022. All data from the San Francisco Association of REALTORS® MLS. Report © 2022 ShowingTime. | 6 131 178 163 278 156 249 Single Family Condo/TIC/Coop February 0 100 200 300 400 500 1-2005 1-2006 1-2007 1-2008 1-2009 1-2010 1-2011 1-2012 1-2013 1-2014 1-2015 1-2016 1-2017 1-2018 1-2019 1-2020 1-2021 1-2022 Single Family Condo/TIC/Coop 240 329 324 548 285 433 Single Family Condo/TIC/Coop Year to Date 2020 2021 2022 - 10.4% + 56.2% - 4.3% + 24.4% + 66.6% - 12.0% + 35.0% - 21.0% 2020 2021 2022 2020 2021 2022 2020 2021 2022 + 4.0% + 1.7% + 17.5% + 11.3%
  • 7. Median Sales Price Median Sales Price Single Family Year-Over-Year Change Condo/TIC/ Coop Year-Over-Year Change Mar-2021 $1,725,000 +9.5% $1,221,184 -2.3% Apr-2021 $1,800,000 +12.1% $1,200,000 -5.9% May-2021 $1,886,500 +18.8% $1,226,000 +12.7% Jun-2021 $1,950,000 +12.7% $1,250,000 +2.0% Jul-2021 $1,850,000 +15.3% $1,208,000 -4.2% Aug-2021 $1,847,500 +13.7% $1,150,000 -5.0% Sep-2021 $1,750,000 +6.1% $1,200,000 +2.1% Oct-2021 $1,805,000 +12.5% $1,245,000 +8.0% Nov-2021 $1,888,888 +15.4% $1,265,000 +7.9% Dec-2021 $1,680,000 +8.4% $1,300,000 +18.2% Jan-2022 $1,630,000 +3.5% $1,075,000 +0.2% Feb-2022 $1,945,000 +17.9% $1,230,000 +2.8% 12-Month Avg* $1,825,000 +13.4% $1,225,000 +4.3% Historical Median Sales Price by Month Point at which half of the sales sold for more and half sold for less, not accounting for seller concessions, in a given month. * Median Sales Price for all properties from March 2021 through February 2022. This is not the average of the individual figures above. Current as of March 11, 2022. All data from the San Francisco Association of REALTORS® MLS. Report © 2022 ShowingTime. | 7 $1,610,000 $1,260,000 $1,650,000 $1,196,500 $1,945,000 $1,230,000 Single Family Condo/TIC/Coop February $500,000 $750,000 $1,000,000 $1,250,000 $1,500,000 $1,750,000 $2,000,000 $2,250,000 1-2005 1-2006 1-2007 1-2008 1-2009 1-2010 1-2011 1-2012 1-2013 1-2014 1-2015 1-2016 1-2017 1-2018 1-2019 1-2020 1-2021 1-2022 Single Family Condo/TIC/Coop $1,502,000 $1,190,000 $1,600,000 $1,135,000 $1,820,000 $1,195,000 Single Family Condo/TIC/Coop Year to Date 2020 2021 2022 + 2.8% - 5.0% + 17.9% + 2.5% - 4.6% + 13.8% + 6.5% + 5.3% 2020 2021 2022 2020 2021 2022 2020 2021 2022 + 9.7% + 6.3% + 10.1% + 14.6%
  • 8. Average Sales Price Average Sales Price Single Family Year-Over-Year Change Condo/TIC/ Coop Year-Over-Year Change Mar-2021 $2,214,726 +9.2% $1,369,434 +0.2% Apr-2021 $2,430,795 +11.3% $1,347,315 -0.0% May-2021 $2,479,992 +32.1% $1,376,307 +10.0% Jun-2021 $2,504,876 +13.8% $1,388,929 -1.9% Jul-2021 $2,292,230 +13.8% $1,355,128 -3.0% Aug-2021 $2,128,296 +7.1% $1,425,053 +7.4% Sep-2021 $2,165,489 +14.2% $1,330,272 +1.9% Oct-2021 $2,359,157 +23.7% $1,459,545 +16.5% Nov-2021 $2,359,605 +15.9% $1,541,854 +21.3% Dec-2021 $2,365,357 +17.5% $1,488,857 +16.2% Jan-2022 $1,977,367 +1.6% $1,316,684 +8.7% Feb-2022 $2,402,602 +6.4% $1,400,333 +4.1% 12-Month Avg* $2,324,788 +15.3% $1,402,967 +7.1% Historical Average Sales Price by Month Average sales price for all closed sales, not accounting for seller concessions, in a given month. * Avg. Sales Price for all properties from March 2021 through February 2022. This is not the average of the individual figures above. Current as of March 11, 2022. All data from the San Francisco Association of REALTORS® MLS. Report © 2022 ShowingTime. | 8 $1,910,349 $1,351,412 $2,257,454 $1,344,643 $2,402,602 $1,400,333 Single Family Condo/TIC/Coop February $500,000 $1,000,000 $1,500,000 $2,000,000 $2,500,000 $3,000,000 1-2005 1-2006 1-2007 1-2008 1-2009 1-2010 1-2011 1-2012 1-2013 1-2014 1-2015 1-2016 1-2017 1-2018 1-2019 1-2020 1-2021 1-2022 Single Family Condo/TIC/Coop $2,007,642 $1,313,251 $2,102,627 $1,278,817 $2,210,127 $1,364,622 Single Family Condo/TIC/Coop Year to Date 2020 2021 2022 + 4.1% - 0.5% + 6.4% + 18.2% - 2.6% + 5.1% + 4.7% + 6.7% 2020 2021 2022 2020 2021 2022 2020 2021 2022 + 6.1% + 15.3% + 3.1% - 0.2%
  • 9. Days on Market Until Sale Days on Market Until Sale Single Family Year-Over-Year Change Condo/TIC/ Coop Year-Over-Year Change Mar-2021 23 +9.5% 45 +66.7% Apr-2021 19 -5.0% 45 +40.6% May-2021 18 -25.0% 36 -10.0% Jun-2021 17 -34.6% 35 +2.9% Jul-2021 18 -28.0% 40 +5.3% Aug-2021 24 0.0% 40 0.0% Sep-2021 22 -12.0% 37 -17.8% Oct-2021 19 -29.6% 34 -17.1% Nov-2021 20 -39.4% 40 -20.0% Dec-2021 30 -14.3% 45 -27.4% Jan-2022 37 +2.8% 62 -11.4% Feb-2022 19 -36.7% 34 -45.2% 12-Month Avg* 21 -23.0% 40 -14.5% Historical Days on Market Until Sale by Month Average number of days between when a property is listed and when an offer is accepted in a given month. * Days on Market for all properties from March 2021 through February 2022. This is not the average of the individual figures above. Current as of March 11, 2022. All data from the San Francisco Association of REALTORS® MLS. Report © 2022 ShowingTime. | 9 25 28 30 62 19 34 Single Family Condo/TIC/Coop February 0 20 40 60 80 100 120 1-2005 1-2006 1-2007 1-2008 1-2009 1-2010 1-2011 1-2012 1-2013 1-2014 1-2015 1-2016 1-2017 1-2018 1-2019 1-2020 1-2021 1-2022 Single Family Condo/TIC/Coop 30 43 33 66 28 46 Single Family Condo/TIC/Coop Year to Date 2020 2021 2022 - 45.2% + 121.4% - 36.7% + 20.0% + 53.5% - 15.2% + 10.0% - 30.3% 2020 2021 2022 2020 2021 2022 2020 2021 2022 - 13.8% - 11.8% - 10.4% - 31.7%
  • 10. Inventory of Active Listings Inventory of Active Listings Single Family Year-Over-Year Change Condo/TIC/ Coop Year-Over-Year Change Mar-2021 634 +15.1% 1,581 +58.6% Apr-2021 667 +9.7% 1,519 +41.8% May-2021 636 -7.6% 1,494 +11.3% Jun-2021 634 -19.0% 1,475 -5.8% Jul-2021 639 -25.7% 1,444 -25.1% Aug-2021 671 -27.4% 1,456 -30.9% Sep-2021 666 -28.3% 1,597 -31.1% Oct-2021 615 -33.7% 1,526 -35.1% Nov-2021 477 -39.8% 1,319 -36.9% Dec-2021 331 -43.5% 955 -36.4% Jan-2022 393 -33.8% 1,081 -32.5% Feb-2022 357 -43.2% 1,085 -31.8% 12-Month Avg* 560 -24.2% 1,378 -19.2% Historical Inventory of Active Listings by Month The number of properties available for sale in active status at the end of a given month. * Active Listings for all properties from March 2021 through February 2022. This is not the average of the individual figures above. Current as of March 11, 2022. All data from the San Francisco Association of REALTORS® MLS. Report © 2022 ShowingTime. | 10 584 990 628 1,591 357 1,085 Single Family Condo/TIC/Coop February 0 500 1,000 1,500 2,000 2,500 1-2005 1-2006 1-2007 1-2008 1-2009 1-2010 1-2011 1-2012 1-2013 1-2014 1-2015 1-2016 1-2017 1-2018 1-2019 1-2020 1-2021 1-2022 Single Family Condo/TIC/Coop 2020 2021 2022 - 31.8% + 60.7% - 43.2% + 7.5% 2020 2021 2022 + 8.6% + 16.9%
  • 11. % of Properties Sold Over List Price % of Properties Sold Over List Price Single Family Year-Over-Year Change Condo/TIC/ Coop Year-Over-Year Change Mar-2021 74.1% -5.2% 42.9% -28.7% Apr-2021 76.1% +8.7% 45.0% -24.7% May-2021 79.7% +26.1% 53.4% +26.8% Jun-2021 82.5% +49.5% 54.4% +74.9% Jul-2021 83.5% +29.1% 55.8% +25.7% Aug-2021 84.4% +28.3% 54.6% +59.6% Sep-2021 84.5% +30.0% 54.6% +58.7% Oct-2021 84.5% +25.2% 61.2% +43.0% Nov-2021 79.5% +29.1% 55.4% +68.9% Dec-2021 79.1% +25.8% 46.5% +62.6% Jan-2022 76.0% +31.5% 38.0% +73.5% Feb-2022 87.2% +28.0% 58.7% +66.3% 12-Month Avg 80.9% +24.8% 51.9% +39.2% Historical % of Properties Sold Over List Price by Month Percentage found when dividing the number of properties sold by properties sold over its original list price, not accounting for seller concessions. * % of Properties Sold Over List Price for all properties from March 2021 through February 2022. This is not the average of the individual figures above. Current as of March 11, 2022. All data from the San Francisco Association of REALTORS® MLS. Report © 2022 ShowingTime. | 11 73.3% 63.5% 68.1% 35.3% 87.2% 58.7% Single Family Condo/TIC/Coop February 0.0% 20.0% 40.0% 60.0% 80.0% 100.0% 1-2005 1-2006 1-2007 1-2008 1-2009 1-2010 1-2011 1-2012 1-2013 1-2014 1-2015 1-2016 1-2017 1-2018 1-2019 1-2020 1-2021 1-2022 Single Family Condo/TIC/Coop 68.5% 49.2% 63.0% 28.6% 82.1% 49.9% Single Family Condo/TIC/Coop Year to Date 2020 2021 2022 + 66.3% - 44.4% + 28.0% - 7.1% - 41.9% + 30.3% - 8.0% + 74.5% 2020 2021 2022 2020 2021 2022 2020 2021 2022 - 4.8% - 0.9% + 3.6% + 21.0%
  • 12. % of List Price Received % of List Price Received Single Family Year-Over-Year Change Condo/TIC/ Coop Year-Over-Year Change Mar-2021 112.2% -1.7% 102.4% -1.6% Apr-2021 113.8% +4.6% 103.7% -1.5% May-2021 116.8% +10.4% 105.2% +4.8% Jun-2021 116.3% +10.1% 105.3% +5.4% Jul-2021 118.5% +11.8% 104.8% +3.8% Aug-2021 116.1% +8.0% 104.3% +3.9% Sep-2021 116.3% +8.9% 105.0% +4.8% Oct-2021 117.0% +8.2% 105.6% +4.2% Nov-2021 114.9% +8.4% 104.6% +4.4% Dec-2021 114.4% +7.9% 103.5% +4.2% Jan-2022 117.7% +11.8% 101.0% +2.3% Feb-2022 121.3% +10.6% 106.1% +5.4% 12-Month Avg* 116.0% +8.1% 104.4% +3.6% Historical % of List Price Received by Month Percentage found when dividing a property’s sales price by its most recent list price, then taking the average for all properties sold in a given month, not accounting for seller concessions. * % of List Price Received for all properties from March 2021 through February 2022. This is not the average of the individual figures above. Current as of March 11, 2022. All data from the San Francisco Association of REALTORS® MLS. Report © 2022 ShowingTime. | 12 111.6% 105.2% 109.7% 100.7% 121.3% 106.1% Single Family Condo/TIC/Coop February 109.5% 103.0% 107.5% 99.7% 119.7% 103.9% Single Family Condo/TIC/Coop Year to Date 90.0% 100.0% 110.0% 120.0% 130.0% 1-2005 1-2006 1-2007 1-2008 1-2009 1-2010 1-2011 1-2012 1-2013 1-2014 1-2015 1-2016 1-2017 1-2018 1-2019 1-2020 1-2021 1-2022 Single Family Condo/TIC/Coop 2020 2021 2022 + 5.4% - 4.3% + 10.6% - 1.7% 2020 2021 2022 - 1.0% + 1.3% 2020 2021 2022 + 4.2% - 3.2% + 11.3% - 1.8% 2020 2021 2022 + 0.1% + 0.3%
  • 13. Housing Affordability Ratio Housing Affordability Ratio Single Family Year-Over-Year Change Condo/TIC/ Coop Year-Over-Year Change Mar-2021 32 -3.0% 52 +6.1% Apr-2021 31 -8.8% 55 +7.8% May-2021 30 -14.3% 54 -8.5% Jun-2021 28 -12.5% 52 -3.7% Jul-2021 30 -14.3% 55 +3.8% Aug-2021 30 -14.3% 57 +1.8% Sep-2021 32 -8.6% 55 -3.5% Oct-2021 31 -13.9% 53 -10.2% Nov-2021 30 -14.3% 54 -8.5% Dec-2021 32 -13.5% 49 -21.0% Jan-2022 32 -11.1% 57 -9.5% Feb-2022 27 -18.2% 49 -7.5% 12-Month Avg* 30 -22.2% 53 -13.0% Historical Housing Affordability Ratio by Month This index measures housing affordability for the region. For example, an index of 120 means the median household income is 120% of what is necessary to qualify for the median-priced home under prevailing interest rates. A higher number means greater affordability. * Affordability Ratio for all properties from March 2021 through February 2022. This is not the average of the individual figures above. Current as of March 11, 2022. All data from the San Francisco Association of REALTORS® MLS. Report © 2022 ShowingTime. | 13 34 51 33 53 27 49 Single Family Condo/TIC/Coop February 20 40 60 80 100 1-2005 1-2006 1-2007 1-2008 1-2009 1-2010 1-2011 1-2012 1-2013 1-2014 1-2015 1-2016 1-2017 1-2018 1-2019 1-2020 1-2021 1-2022 Single Family Condo/TIC/Coop 2020 2021 2022 - 7.5% + 3.9% - 18.2% - 2.9% 2020 2021 2022 0.0% - 1.9% 36 54 34 56 28 51 Single Family Condo/TIC/Coop Year to Date 2020 2021 2022 - 8.9% + 3.7% - 17.6% - 5.6% 2020 2021 2022 + 2.9% + 1.9%
  • 14. Months Supply of Inventory Months Supply of Inventory Single Family Year-Over-Year Change Condo/TIC/ Coop Year-Over-Year Change Mar-2021 2.7 -3.6% 5.5 +31.0% Apr-2021 2.7 -18.2% 4.8 -2.0% May-2021 2.4 -38.5% 4.3 -35.8% Jun-2021 2.4 -45.5% 4.1 -47.4% Jul-2021 2.4 -48.9% 3.9 -58.9% Aug-2021 2.6 -46.9% 4.0 -60.0% Sep-2021 2.5 -47.9% 4.3 -59.4% Oct-2021 2.3 -51.1% 4.1 -61.7% Nov-2021 1.8 -53.8% 3.5 -62.4% Dec-2021 1.3 -53.6% 2.6 -58.7% Jan-2022 1.6 -42.9% 2.9 -54.7% Feb-2022 1.4 -50.0% 3.0 -50.8% 12-Month Avg* 2.2 -42.7% 3.9 -49.3% Historical Months Supply of Inventory by Month The inventory of homes for sale at the end of a given month, divided by the average monthly pending sales from the last 12 months. * Months Supply for all properties from March 2021 through February 2022. This is not the average of the individual figures above. Current as of March 11, 2022. All data from the San Francisco Association of REALTORS® MLS. Report © 2022 ShowingTime. | 14 2.9 4.0 2.8 6.1 1.4 3.0 Single Family Condo/TIC/Coop February 0.0 2.0 4.0 6.0 8.0 10.0 12.0 1-2005 1-2006 1-2007 1-2008 1-2009 1-2010 1-2011 1-2012 1-2013 1-2014 1-2015 1-2016 1-2017 1-2018 1-2019 1-2020 1-2021 1-2022 Single Family Condo/TIC/Coop 2020 2021 2022 - 50.8% + 52.5% - 50.0% - 3.4% 2020 2021 2022 + 11.5% + 17.6%
  • 15. All Properties Activity Overview Key metrics by report month and for year-to-date (YTD) starting from the first of the year. Key Metrics Historical Sparkbars 2-2021 2-2022 Percent Change YTD 2021 YTD 2022 Percent Change Current as of March 11, 2022. All data from the San Francisco Association of REALTORS® MLS. Report © 2022 ShowingTime. | 15 Months Supply 4.6 2.4 - 47.8% -- -- -- Affordability Ratio 38 34 - 10.5% % of List Price Received 104.0% 111.9% + 7.6% 102.6% 41 62.6% + 51.6% + 7.3% 36 - 12.2% 110.1% % of Properties Sold Over List Price 47.2% 69.7% + 47.7% 41.3% Active Listings 2,256 1,474 - 34.7% -- Avg. Sales Price $1,681,125 $1,783,838 + 6.1% $1,590,583 Days on Market 51 28 - 45.1% 54 $1,408,000 + 8.9% + 6.6% 39 - 27.8% $1,696,194 -- -- Sold Listings 447 408 - 8.7% 890 727 - 18.3% Median Sales Price $1,349,500 $1,453,500 + 7.7% $1,292,500 - 22.3% Pending Sales 609 504 - 17.2% 1,083 903 - 16.6% New Listings 819 585 - 28.6% 1,617 1,257 2-2019 2-2020 2-2021 2-2022 2-2019 2-2020 2-2021 2-2022 2-2019 2-2020 2-2021 2-2022 2-2019 2-2020 2-2021 2-2022 2-2019 2-2020 2-2021 2-2022 2-2019 2-2020 2-2021 2-2022 2-2019 2-2020 2-2021 2-2022 2-2019 2-2020 2-2021 2-2022 2-2019 2-2020 2-2021 2-2022 2-2019 2-2020 2-2021 2-2022 2-2019 2-2020 2-2021 2-2022
  • 16. Activity by District SF District 1: Northwest (Sea Cliff, Lake, Jordan Park / Laurel Heights, Outer Richmond, Central Ric The U.S. SF District 2: Central West (Outer Sunset, Central Sunset, Inner Sunset, Outer Parkside, Parkside, Inner Parkside, Golden Gate Heights) SF District 3: Southwest (Pine Lake Park, Lake Shore, Merced Manor, Stonestown, Lakeside, Merced Heights, Ingleside, Ingleside Heights, Oceanview) SF District 4: Twin Peaks W (Forest Hill (& Ext), W Portal, St Francis Wd, Balboa Terr, Mt Dav Manor, Ingleside Terr, Monterey Hts, Wstwd Pk & H'lnds, Shrwd Fst, Miraloma Pk, Dmnd Hts, Mdtwn Terr) SF District 5: Central (Haight Ashbury, Cole Vly / Prnssus Hts, Clarndn Hts, Corona Hts, Twin Pks, Glen Pk, Noe Vly, Eureka Vly / Dolores Hts, Mission Dolores, Duboce Trngl, Buena Vista / Ashbury Hts) SF District 6: Central North (Lower Pacific Heights, Anza Vista, Western Addition, North Panhandle, Alamo Square, Hayes Valley) SF District 7: North (Marina, Cow Hollow, Presidio Heights, Pacific Heights) SF District 8: Northeast (North Waterfront, North Beach, Russian Hill, Telegraph Hill, Nob Hill, Financial District / Barbary Coast, Downtown, Van Ness / Civic Center, Tenderloin) SF District 9: Central East (Yerba Buena, South Beach, South of Market, Mission Bay, Inner Mission, Potrero Hill, Central Waterfront / Dogpatch, Bernal Heights) SF District 10: Southeast (Outer Mission, Mission Terr, Excelsior, Portola, Bayview, Silver Terr, Hunters Pt, Candlestick Pt, Bayview Hts, Little Hollywood, Visitation Vly, Crocker Amazon) 2-2021 2-2022 + / – 2-2021 2-2022 + / – 2-2021 2-2022 + / – 2-2021 2-2022 + / – 2-2021 2-2022 + / – Single Family 1 SF District 1 33 34 +3.0% 13 15 +15.4% $2,625,000 $2,505,000 -4.6% 25 30 +20.0% 1.8 1.7 -5.6% 2 SF District 2 72 41 -43.1% 24 33 +37.5% $1,407,500 $1,830,000 +30.0% 13 17 +30.8% 1.9 0.9 -52.6% 3 SF District 3 37 24 -35.1% 9 9 0.0% $1,260,000 $1,365,000 +8.3% 37 22 -40.5% 2.6 1.4 -46.2% 4 SF District 4 59 26 -55.9% 28 24 -14.3% $1,720,000 $2,650,000 +54.1% 26 19 -26.9% 1.8 0.7 -61.1% 5 SF District 5 127 47 -63.0% 30 26 -13.3% $2,700,000 $2,487,500 -7.9% 32 17 -46.9% 3.8 1.2 -68.4% 6 SF District 6 18 10 -44.4% 4 2 -50.0% $3,000,000 $1,425,000 -52.5% 38 8 -78.9% 3.5 2.1 -40.0% 7 SF District 7 57 32 -43.9% 6 6 0.0% $6,756,250 $4,706,250 -30.3% 12 31 +158.3% 6.8 2.4 -64.7% 8 SF District 8 19 22 +15.8% 1 1 0.0% $3,025,000 $815,000 -73.1% 14 10 -28.6% 8.6 7.9 -8.1% 9 SF District 9 96 48 -50.0% 17 11 -35.3% $1,700,000 $2,210,000 +30.0% 37 22 -40.5% 3.7 1.7 -54.1% 10 SF District 10 110 73 -33.6% 31 29 -6.5% $1,060,000 $1,350,000 +27.4% 46 15 -67.4% 2.6 1.6 -38.5% Condo/TIC/Coop 1 SF District 1 59 36 -39.0% 14 10 -28.6% $1,100,000 $1,280,000 +16.4% 46 17 -63.0% 3.7 2.0 -45.9% 2 SF District 2 12 16 +33.3% 8 1 -87.5% $861,000 $1,250,000 +45.2% 20 0 -100.0% 2.3 3.0 +30.4% 3 SF District 3 11 4 -63.6% 3 2 -33.3% $827,500 $621,500 -24.9% 153 43 -71.9% 3.3 1.0 -69.7% 4 SF District 4 13 21 +61.5% 2 6 +200.0% $681,866 $870,000 +27.6% 108 26 -75.9% 2.7 4.2 +55.6% 5 SF District 5 146 86 -41.1% 43 38 -11.6% $1,430,000 $1,482,500 +3.7% 44 20 -54.5% 3.2 1.6 -50.0% 6 SF District 6 119 97 -18.5% 40 30 -25.0% $1,117,500 $1,327,500 +18.8% 59 31 -47.5% 3.8 2.5 -34.2% 7 SF District 7 154 78 -49.4% 35 23 -34.3% $1,602,500 $1,495,000 -6.7% 65 27 -58.5% 5.4 2.0 -63.0% 8 SF District 8 305 225 -26.2% 44 42 -4.5% $1,275,000 $1,000,000 -21.6% 77 41 -46.8% 7.7 3.5 -54.5% 9 SF District 9 723 476 -34.2% 84 91 +8.3% $1,100,000 $1,166,000 +6.0% 64 41 -35.9% 8.8 3.8 -56.8% 10 SF District 10 49 46 -6.1% 5 6 +20.0% $640,000 $910,000 +42.2% 66 32 -51.5% 8.3 5.7 -31.3% Key metrics by report month for the districts of San Fransisco. Current as of March 11, 2022. All data from the San Francisco Association of REALTORS® MLS. Report © 2022 ShowingTime. | 16 Active Listings Sold Listings Median Sales Price Days on Market Months Supply