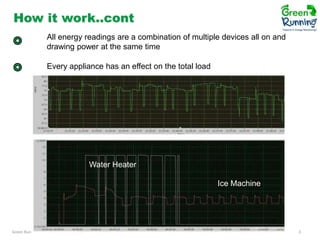
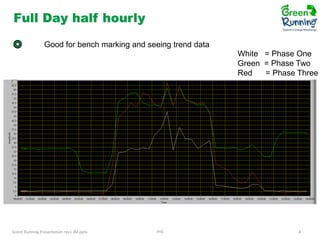
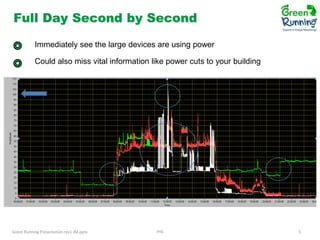
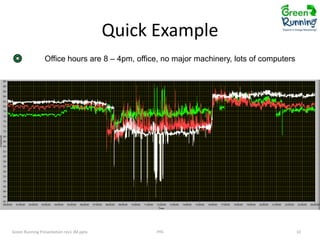
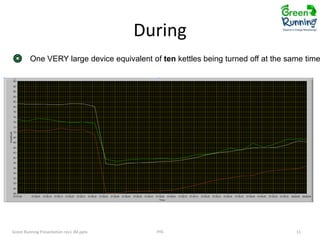
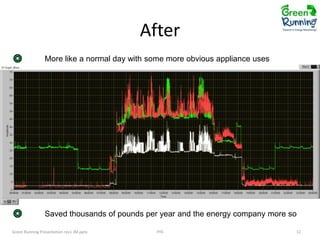
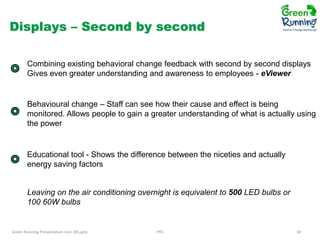
The benefits of
second by second
energy monitoring
and Instantaneous
live usage
feedback for
energy saving and
behavioral change.
Green Running Presentation

IHG

1
How it works – why beneficial?

All energy readings are a combination of multiple devices all on and
Drawing power at the same time.

Kettle

Toaster

Microwave

Green Running Presentation rev1 JM.pptx

IHG

2
How it work..cont
All energy readings are a combination of multiple devices all on and
drawing power at the same time
Every appliance has an effect on the total load

Water Heater

Ice Machine

Green Running Presentation rev1 JM.pptx

IHG

3
Full Day half hourly
Good for bench marking and seeing trend data
White = Phase One
Green = Phase Two
Red
= Phase Three

Green Running Presentation rev1 JM.pptx

IHG

4
Full Day Second by Second
Immediately see the large devices are using power
Could also miss vital information like power cuts to your building

Green Running Presentation rev1 JM.pptx

IHG

5
Zooming In Second by second
Can see exactly what is turning on and off
Detail of power cut risk

Green Running Presentation rev1 JM.pptx

IHG

6
Zooming In Half hourly
Can see exactly what is turning on and off?

Green Running Presentation rev1 JM.pptx

IHG

7
Zooming In Minute
Not a huge amount better than half hourly
Hence bad press

Green Running Presentation rev1 JM.pptx

IHG

8
Green Running – what do I mean by
Second by second

Graph for half hourly data blurred data

Graph with Greater than second by second – blurred data but prettier

Graph for second by second data can actually see what is happening!
Perfect for ISO14:001 improvement

Green Running Presentation rev1 JM.pptx

IHG

9
Quick Example
Office hours are 8 – 4pm, office, no major machinery, lots of computers

Green Running Presentation rev1 JM.pptx

IHG

10
During

One VERY large device equivalent of ten kettles being turned off at the same time

Green Running Presentation rev1 JM.pptx

IHG

11
After
More like a normal day with some more obvious appliance uses

Saved thousands of pounds per year and the energy company more so
Green Running Presentation rev1 JM.pptx

IHG

12
End of Techy Part


Green Running Presentation rev1 JM.pptx

IHG

13
Behavioural change

LIVE – “REAL TIME” second by second stream to the Display

First time people can actually see the differences in cost for each item

A cause and effect when someone turns on an appliance

Green Running Presentation rev1 JM.pptx

IHG

14
Example Video

Green Running Presentation rev1 JM.pptx

IHG

15
Displays – Real time tools

• Compare consumption & cost across floors,
buildings, & sites

Green Running 121112.ppt

UKPN

16
Displays – Trending and BenchMarks

• Compare consumption & cost with previous
data & “Perfect Days”

17
Displays – Second by second
Combining existing behavioral change feedback with second by second displays
Gives even greater understanding and awareness to employees - eViewer

Behavioural change – Staff can see how their cause and effect is being
monitored. Allows people to gain a greater understanding of what is actually using
the power

Educational tool - Shows the difference between the niceties and actually
energy saving factors

Leaving on the air conditioning overnight is equivalent to 500 LED bulbs or
100 60W bulbs

Green Running Presentation rev1 JM.pptx

IHG

18
Alarms and Warnings

Be told your about to have a power cut prior to having one

Be informed if there was any out of hour irregular usage – Security

Green Running Presentation rev1 JM.pptx

IHG

19
14001 : Perfect

• Quote from Gardline 140001 report
• Quote from Crown Plaza group head

Green Running Presentation rev1 JM.pptx

IHG

20
Faster Sampling than every second?
Real Time displays – 0.1 second is perfect and smooth, one second is
ideal and gives you everything you need, anything more is better than
nothing but you lose information

Sampling at 50 KHz (50,000 times per second) gives harmonic information,
power, frequency, each appliance usage and effect on power factor factor.

MOT – Just want to just understand where you
are, don’t go and spend money on being capital
energy saving equipment unless you actually
know where you are at and what you need.
Green Running Presentation rev1 JM.pptx

IHG

21
22
Does it cost more?
To send 86400 data-points up to our dedicated server = 3MB per day
Less than 30secs of Facebook browsing!

The equipment cost is the same, it is a custom built hardware with the
same chips as meters, just with more sophisticated software platform
allowing the speed and analysis

The storage is on the Microsoft azure dedicated data platform so is a
cheap storage version and less than £25 per month.

Green Running Presentation rev1 JM.pptx

IHG

23
24
eController
eAnalyser

What’s In The Box:

What’s In The Box:

- eController Unit

- eAnalyser Unit

- 3 x Clamps

- 3 x Clamps

- Power Supply

- Power Supply

- Ethernet Cable

- Ethernet Cable

- ? 1 Year’s Database ?

- ePlug Single Phase Measurement Too

- Aluminium Carry Case

- ? 1 Year’s Database ?

Green Running Presentation rev1 JM.pptx

IHG

- Aluminium Carry Case

25
Complete Product Suite
Audits

Cloud

eAnalyser

Graphical Web Interface
for awareness & control
Monitoring

MOT

eController

Green Running 121112.ppt

Smart Plugs &
Other Tools for
Switching &
Control

Alarms & trends
sent to phones
tablets. Also
displays live data
UKPN

Government
Energy
Reports
Customisable
Reports
26
Installation
Office facilities for ~50 staff

Outgoing
Armoured Cables

Handful of 3-phase machines
3-Phase supply
Automated Meter Reading (wireless)
E-ON supplier with Elster A1700

Energy audit using eAnalyser = 1 month
Identified major sources of consumption
Identified significant phase imbalance

Clamps to
3 Phases

Results So Far…
Identified major sources of consumption using
eAnalsyer on main circuits & specific machinery
Supported staff education & training
Reduced consumption >10%

Ethernet
LAN

Detected significant phase imbalance

3 Phase Mains
Incoming from
(Billing) Meter

eController permanent installation
Green Running 121112.ppt

eController

UKPN

27
Thank You

QUESTIONS?
Peter Davies
p.davies@GreenRunning.com
www.GreenRunning.com
+44 (0)800 907 0006

Green Running 121112.ppt

UKPN

28

monitoring energy in real-time

  • 1.
    The benefits of secondby second energy monitoring and Instantaneous live usage feedback for energy saving and behavioral change. Green Running Presentation IHG 1
  • 2.
    How it works– why beneficial? All energy readings are a combination of multiple devices all on and Drawing power at the same time. Kettle Toaster Microwave Green Running Presentation rev1 JM.pptx IHG 2
  • 3.
    How it work..cont Allenergy readings are a combination of multiple devices all on and drawing power at the same time Every appliance has an effect on the total load Water Heater Ice Machine Green Running Presentation rev1 JM.pptx IHG 3
  • 4.
    Full Day halfhourly Good for bench marking and seeing trend data White = Phase One Green = Phase Two Red = Phase Three Green Running Presentation rev1 JM.pptx IHG 4
  • 5.
    Full Day Secondby Second Immediately see the large devices are using power Could also miss vital information like power cuts to your building Green Running Presentation rev1 JM.pptx IHG 5
  • 6.
    Zooming In Secondby second Can see exactly what is turning on and off Detail of power cut risk Green Running Presentation rev1 JM.pptx IHG 6
  • 7.
    Zooming In Halfhourly Can see exactly what is turning on and off? Green Running Presentation rev1 JM.pptx IHG 7
  • 8.
    Zooming In Minute Nota huge amount better than half hourly Hence bad press Green Running Presentation rev1 JM.pptx IHG 8
  • 9.
    Green Running –what do I mean by Second by second Graph for half hourly data blurred data Graph with Greater than second by second – blurred data but prettier Graph for second by second data can actually see what is happening! Perfect for ISO14:001 improvement Green Running Presentation rev1 JM.pptx IHG 9
  • 10.
    Quick Example Office hoursare 8 – 4pm, office, no major machinery, lots of computers Green Running Presentation rev1 JM.pptx IHG 10
  • 11.
    During One VERY largedevice equivalent of ten kettles being turned off at the same time Green Running Presentation rev1 JM.pptx IHG 11
  • 12.
    After More like anormal day with some more obvious appliance uses Saved thousands of pounds per year and the energy company more so Green Running Presentation rev1 JM.pptx IHG 12
  • 13.
    End of TechyPart  Green Running Presentation rev1 JM.pptx IHG 13
  • 14.
    Behavioural change LIVE –“REAL TIME” second by second stream to the Display First time people can actually see the differences in cost for each item A cause and effect when someone turns on an appliance Green Running Presentation rev1 JM.pptx IHG 14
  • 15.
    Example Video Green RunningPresentation rev1 JM.pptx IHG 15
  • 16.
    Displays – Realtime tools • Compare consumption & cost across floors, buildings, & sites Green Running 121112.ppt UKPN 16
  • 17.
    Displays – Trendingand BenchMarks • Compare consumption & cost with previous data & “Perfect Days” 17
  • 18.
    Displays – Secondby second Combining existing behavioral change feedback with second by second displays Gives even greater understanding and awareness to employees - eViewer Behavioural change – Staff can see how their cause and effect is being monitored. Allows people to gain a greater understanding of what is actually using the power Educational tool - Shows the difference between the niceties and actually energy saving factors Leaving on the air conditioning overnight is equivalent to 500 LED bulbs or 100 60W bulbs Green Running Presentation rev1 JM.pptx IHG 18
  • 19.
    Alarms and Warnings Betold your about to have a power cut prior to having one Be informed if there was any out of hour irregular usage – Security Green Running Presentation rev1 JM.pptx IHG 19
  • 20.
    14001 : Perfect •Quote from Gardline 140001 report • Quote from Crown Plaza group head Green Running Presentation rev1 JM.pptx IHG 20
  • 21.
    Faster Sampling thanevery second? Real Time displays – 0.1 second is perfect and smooth, one second is ideal and gives you everything you need, anything more is better than nothing but you lose information Sampling at 50 KHz (50,000 times per second) gives harmonic information, power, frequency, each appliance usage and effect on power factor factor. MOT – Just want to just understand where you are, don’t go and spend money on being capital energy saving equipment unless you actually know where you are at and what you need. Green Running Presentation rev1 JM.pptx IHG 21
  • 22.
  • 23.
    Does it costmore? To send 86400 data-points up to our dedicated server = 3MB per day Less than 30secs of Facebook browsing! The equipment cost is the same, it is a custom built hardware with the same chips as meters, just with more sophisticated software platform allowing the speed and analysis The storage is on the Microsoft azure dedicated data platform so is a cheap storage version and less than £25 per month. Green Running Presentation rev1 JM.pptx IHG 23
  • 24.
  • 25.
    eController eAnalyser What’s In TheBox: What’s In The Box: - eController Unit - eAnalyser Unit - 3 x Clamps - 3 x Clamps - Power Supply - Power Supply - Ethernet Cable - Ethernet Cable - ? 1 Year’s Database ? - ePlug Single Phase Measurement Too - Aluminium Carry Case - ? 1 Year’s Database ? Green Running Presentation rev1 JM.pptx IHG - Aluminium Carry Case 25
  • 26.
    Complete Product Suite Audits Cloud eAnalyser GraphicalWeb Interface for awareness & control Monitoring MOT eController Green Running 121112.ppt Smart Plugs & Other Tools for Switching & Control Alarms & trends sent to phones tablets. Also displays live data UKPN Government Energy Reports Customisable Reports 26
  • 27.
    Installation Office facilities for~50 staff Outgoing Armoured Cables Handful of 3-phase machines 3-Phase supply Automated Meter Reading (wireless) E-ON supplier with Elster A1700 Energy audit using eAnalyser = 1 month Identified major sources of consumption Identified significant phase imbalance Clamps to 3 Phases Results So Far… Identified major sources of consumption using eAnalsyer on main circuits & specific machinery Supported staff education & training Reduced consumption >10% Ethernet LAN Detected significant phase imbalance 3 Phase Mains Incoming from (Billing) Meter eController permanent installation Green Running 121112.ppt eController UKPN 27
  • 28.