10-1
CHAPTER 10
The Basics of Capital Budgeting
งบลงทุน
Should we
build this
plant?
10-2
What is capital budgeting?
งบลงทุนคืออะไร
 Analysis of potential additions to
fixed assets.
เป็นการวิเคราะห์ในเรื่องการเพิ่ม
ศักยภาพของสินทรัพย์ถาวร
 Long-term decisions; involve
large expenditures.
เป็นการตัดสินใจในระยะยาว และ
เกี่ยวข้องกับค่าใช้จ่ายจำานวนมาก
10-3
Steps to capital budgeting
ขั้นตอนในการทำางบลงทุน
1. Estimate CFs (inflows & outflows).
2. Assess riskiness of CFs.
3. Determine the appropriate cost of capital.
4. Find NPV and/or IRR.
5. Accept if NPV > 0 and/or IRR > WACC.
10-4
What is the difference between
independent and mutually exclusive
projects?
 Independent projects – if the cash
flows of one are unaffected by the
acceptance of the other.
Independent projects – ถ้ากระแส
เงินสดของโครงการหนึ่งไม่ถูกกระทบโดย
การดำาเนินการของโครงการอื่น
 Mutually exclusive projects – if
the cash flows of one can be
adversely impacted by the
acceptance of the other.
10-5
An Example of
Mutually Exclusive Projects
BRIDGE vs. BOAT
to get products across a river.
10-6
แยกประเภทโครงการลงทุน
PLACEMENT : MAINTENANCE OF BU
PLACEMENT : COST REDUCTION
PANSION OF EXISTING PRODUCTS
R MARKETS
10-7
PANSION INTO NEW PRODUCTS
R MARKETS
FETY AND / OR ENVIRONMENT PR
THER
10-8
What is the difference between normal
and nonnormal cash flow streams?
 Normal cash flow stream – Cost (negative
CF) followed by a series of positive cash
inflows. One change of signs.
 Nonnormal cash flow stream – Two or
more changes of signs. Most common:
Cost (negative CF), then string of positive
CFs, then cost to close project. Nuclear
power plant, strip mine, etc.
10-9
เกณฑ์ที่ใช้ในการตัดสินใจเกี่ยว
กับงบลงทุน
1. PAYBACK PERIOD
2. DISCOUNTED PAYBACK
PERIOD
3. NET PRESENT VALUE (NPV)
4. INTERNAL RATE OF RETURN
(IRR)
10-10
What is the payback period?
ระยะเวลาคืนทุนคืออะไร ?
 The number of years required to
recover a project’s cost, or
“How long does it take to get our
money back?”
คือ จำานวนปีที่ได้รับเงินเข้ามาเท่ากับต้นทุนของ
โครงการ หรือ “นานเท่าไรที่เราจะได้
เงินที่ลงทุนไปกลับคืนมา”
 Calculated by adding project’s cash
inflows to its cost until the cumulative
cash flow for the project turns positive.
10-11
Calculating payback
PaybackL = 2 + / = 2.375 years
CFt -100 10 60 100
Cumulative -100 -90 0 50
0 1 2 3
=
2.4
30 80
80
-30
Project L
PaybackS = 1 + / = 1.6 years
CFt -100 70 100 20
Cumulative -100 0 20 40
0 1 2 3
=
1.6
30 50
50
-30
Project S
10-12
Strengths and weaknesses of payback
ข้อดีและข้อเสียของระยะเวลาคืน
ทุน
 Strengths (ข้อดี)
 Provides an indication of a project’s risk
and liquidity.
แสดงความเสี่ยงและสภาพคล่องของโครงการ
 Easy to calculate and understand.
ง่ายในการคำานวณและทำาความเข้าใจได้ง่าย
 Weaknesses (ข้อเสีย)
 Ignores the time value of money.
ไม่ได้คำานึงถึงมูลค่าของเงินตามเวลา
 Ignores CFs occurring after the payback
period.
ไม่ได้คำานึงถึงกระแสเงินสดที่เกิดขึ้นภายหลังระยะ
10-13
Discounted payback period
 Uses discounted cash flows rather than
raw CFs.
Disc PaybackL = 2 + / = 2.7 years
CFt -100 10 60 80
Cumulative -100 -90.91 18.79
0 1 2 3
=
2.7
60.11
-41.32
PV of CFt -100 9.09 49.59
41.32 60.11
10%
10-14
Net Present Value (NPV)
มูลค่าปัจจุบันสุทธิ
 Sum of the PVs of all cash inflows
and outflows of a project:
ยอดรวมของมูลค่าปัจจุบันของกระแส
เงินสดเข้า-ออกทั้งหมดของโครงการ
∑= +
=
n
0t
t
t
)k1(
CF
NPV
10-15
What is Project L’s NPV?
Year CFt PV of CFt
0 -100 -$100
1 10 9.09
2 60 49.59
3 80 60.11
NPVL = $18.79
NPVS = $19.98
10-16
Solving for NPV:
Financial calculator solution
 Enter CFs into the calculator’s CFLO
register.
 CF0 = -100
 CF1 = 10
 CF2 = 60
 CF3 = 80
 Enter I/YR = 10, press NPV button to
get NPVL = $18.78.
10-17
Rationale for the NPV method
NPV = PV of inflows – Cost
= Net gain in wealth
 If projects are independent, accept if the
project NPV > 0.
 If projects are mutually exclusive, accept
projects with the highest positive NPV,
those that add the most value.
 In this example, would accept S if mutually
exclusive (NPVs > NPVL), and would accept
both if independent.
10-18
Internal Rate of Return (IRR)
อัตราผลตอบแทนภายใน
 IRR is the discount rate that forces PV of
inflows equal to cost, and the NPV = 0:
 IRR คือ อัตราส่วนลดที่ทำาให้มูลค่าปัจจุบันของ
กระแสเงินสดรับเท่ากับต้นทุน และ NPV = 0:
 Solving for IRR with a financial calculator:
 Enter CFs in CFLO register.
 Press IRR; IRRL = 18.13% and IRRS = 23.56%.
∑= +
=
n
0t
t
t
)IRR1(
CF
0
10-19
How is a project’s IRR similar to a
bond’s YTM?
 They are the same thing.
 Think of a bond as a project. The
YTM on the bond would be the IRR
of the “bond” project.
 EXAMPLE: Suppose a 10-year bond
with a 9% annual coupon sells for
$1,134.20.
 Solve for IRR = YTM = 7.08%, the
annual return for this project/bond.
10-20
Rationale for the IRR method
เหตุผลของวิธี IRR
 If IRR > WACC, the project’s rate of
return is greater than its costs.
There is some return left over to
boost stockholders’ returns.
 ถ้า IRR > WACC, อัตราผลตอบแทนของ
โครงการจะมากกว่าต้นทุน ทำาให้มีผล
ตอบแทนคงเหลืออยู่ซึ่งจะกลายเป็นผล
ตอบแทนของผู้ถือหุ้น
10-21
IRR Acceptance Criteria
 If IRR > k, accept project.
 If IRR < k, reject project.
 If projects are independent, accept both
projects, as both IRR > k = 10%.
 If projects are mutually exclusive, accept
S, because IRRs > IRRL.
10-22
NPV Profiles
 A graphical representation of project NPVs at various
different costs of capital.
 การแสดงกราฟของโครงการที่ใช้วิธีNPV
ณ อัตราต้นทุนของเงินทุนที่แตกต่างกัน
k NPVL NPVS
0 $50 $40
5 33 29
10 19 20
15 7 12
20 (4) 5
10-23
Drawing NPV profiles
-10
0
10
20
30
40
50
60
5 10 15 20 23.6
NPV
($)
Discount Rate (%)
IRRL = 18.1%
IRRS = 23.6%
Crossover Point = 8.7%
S
L
.
.
.
..
.
.
.
.
. .
10-24
Comparing the NPV and IRR
methods
 If projects are independent, the two
methods always lead to the same
accept/reject decisions.
 If projects are mutually exclusive …
 If k > crossover point, the two methods
lead to the same decision and there is no
conflict.
 If k < crossover point, the two methods
lead to different accept/reject decisions.
10-25
Finding the crossover point
1. Find cash flow differences between the
projects for each year.
2. Enter these differences in CFLO register,
then press IRR. Crossover rate = 8.68%,
rounded to 8.7%.
3. Can subtract S from L or vice versa, but
better to have first CF negative.
4. If profiles don’t cross, one project dominates
the other.
10-26
Reasons why NPV profiles cross
 Size (scale) differences – the smaller
project frees up funds at t = 0 for
investment. The higher the opportunity
cost, the more valuable these funds, so
high k favors small projects.
 Timing differences – the project with faster
payback provides more CF in early years
for reinvestment. If k is high, early CF
especially good, NPVS > NPVL.
10-27
Reinvestment rate assumptions
 NPV method assumes CFs are reinvested
at k, the opportunity cost of capital.
 IRR method assumes CFs are reinvested
at IRR.
 Assuming CFs are reinvested at the
opportunity cost of capital is more realistic,
so NPV method is the best. NPV method
should be used to choose between
mutually exclusive projects.
 Perhaps a hybrid of the IRR that assumes
cost of capital reinvestment is needed.
10-28
Since managers prefer the IRR to the
NPV method, is there a better IRR
measure?
 Yes, MIRR is the discount rate that
causes the PV of a project’s terminal
value (TV) to equal the PV of costs. TV
is found by compounding inflows at
WACC.
 MIRR assumes cash flows are
reinvested at the WACC.
10-29
Calculating MIRR
66.0
12.1
10%
10%
-100.0 10.0 60.0 80.0
0 1 2 310%
PV outflows
100.0
$100
MIRR = 16.5%
158.1
TV inflows
MIRRL = 16.5%
$158.1
(1 + MIRRL)3
=
10-30
Calculating MIRR :Project X
392.0
200.70
12%
12%
-500.0 160.0 350.0 300.0
0 1 2 312%
PV outflows
500.0
$500
MIRR = 21.31%
892.70
TV inflows
MIRRX = 21.31%
$892.70
(1 + MIRRX)3
=
10-31
Why use MIRR versus IRR?
 MIRR correctly assumes reinvestment at
opportunity cost = WACC. MIRR also
avoids the problem of multiple IRRs.
 MIRR มีข้อสมมติฐานว่าจะนำาCFกลับไปลงทุน
ใหม่โดยคิดอัตราเดียวกับต้นทุนเสียโอกาสซึ่ง
เท่ากับอัตราWACC
การใช้ MIRR จะไม่ทำาให้เกิดคำาตอบมากกว่า
หนึ่งคำาตอบดังเช่นที่อาจเกิดขึ้นได้ถ้าใช้วิธี IRR
10-32
Why use MIRR versus IRR?
 Managers like rate of return comparisons,
and MIRR is better for this than IRR.
 ผู้บริหารที่ชอบการเปรียบเทียบระหว่างอัตราผล
ตอบแทนของโครงการ วิธี MIRR จะเป็น
วิธีที่น่าใช้มากกว่าวิธี IRR
10-33
Project P has cash flows (in 000s): CF0 =
-$800, CF1 = $5,000, and CF2 = -$5,000.
Find Project P’s NPV and IRR.
 Enter CFs into calculator CFLO register.
 Enter I/YR = 10.
 NPV = -$386.78.
 IRR = ERROR Why?
-800 5,000 -5,000
0 1 2
k = 10%
10-34
Multiple IRRs
NPV Profile
450
-800
0
400100
IRR2 = 400%
IRR1 = 25%
k
NPV
10-35
Why are there multiple IRRs?
 At very low discount rates, the PV of CF2 is
large & negative, so NPV < 0.
 At very high discount rates, the PV of both
CF1 and CF2 are low, so CF0 dominates and
again NPV < 0.
 In between, the discount rate hits CF2
harder than CF1, so NPV > 0.
 Result: 2 IRRs.
10-36
Solving the multiple IRR problem
 Using a calculator
 Enter CFs as before.
 Store a “guess” for the IRR (try 10%)
10 ■ STO
■ IRR = 25% (the lower IRR)
 Now guess a larger IRR (try 200%)
200 ■ STO
■ IRR = 400% (the higher IRR)
 When there are nonnormal CFs and more
than one IRR, use the MIRR.
10-37
When to use the MIRR instead of
the IRR? Accept Project P?
 When there are nonnormal CFs and
more than one IRR, use MIRR.
 PV of outflows @ 10% = -$4,932.2314.
 TV of inflows @ 10% = $5,500.
 MIRR = 5.6%.
 Do not accept Project P.
 NPV = -$386.78 < 0.
 MIRR = 5.6% < k = 10%.

Ru Fm Chapter10 Updated

  • 1.
    10-1 CHAPTER 10 The Basicsof Capital Budgeting งบลงทุน Should we build this plant?
  • 2.
    10-2 What is capitalbudgeting? งบลงทุนคืออะไร  Analysis of potential additions to fixed assets. เป็นการวิเคราะห์ในเรื่องการเพิ่ม ศักยภาพของสินทรัพย์ถาวร  Long-term decisions; involve large expenditures. เป็นการตัดสินใจในระยะยาว และ เกี่ยวข้องกับค่าใช้จ่ายจำานวนมาก
  • 3.
    10-3 Steps to capitalbudgeting ขั้นตอนในการทำางบลงทุน 1. Estimate CFs (inflows & outflows). 2. Assess riskiness of CFs. 3. Determine the appropriate cost of capital. 4. Find NPV and/or IRR. 5. Accept if NPV > 0 and/or IRR > WACC.
  • 4.
    10-4 What is thedifference between independent and mutually exclusive projects?  Independent projects – if the cash flows of one are unaffected by the acceptance of the other. Independent projects – ถ้ากระแส เงินสดของโครงการหนึ่งไม่ถูกกระทบโดย การดำาเนินการของโครงการอื่น  Mutually exclusive projects – if the cash flows of one can be adversely impacted by the acceptance of the other.
  • 5.
    10-5 An Example of MutuallyExclusive Projects BRIDGE vs. BOAT to get products across a river.
  • 6.
    10-6 แยกประเภทโครงการลงทุน PLACEMENT : MAINTENANCEOF BU PLACEMENT : COST REDUCTION PANSION OF EXISTING PRODUCTS R MARKETS
  • 7.
    10-7 PANSION INTO NEWPRODUCTS R MARKETS FETY AND / OR ENVIRONMENT PR THER
  • 8.
    10-8 What is thedifference between normal and nonnormal cash flow streams?  Normal cash flow stream – Cost (negative CF) followed by a series of positive cash inflows. One change of signs.  Nonnormal cash flow stream – Two or more changes of signs. Most common: Cost (negative CF), then string of positive CFs, then cost to close project. Nuclear power plant, strip mine, etc.
  • 9.
  • 10.
    10-10 What is thepayback period? ระยะเวลาคืนทุนคืออะไร ?  The number of years required to recover a project’s cost, or “How long does it take to get our money back?” คือ จำานวนปีที่ได้รับเงินเข้ามาเท่ากับต้นทุนของ โครงการ หรือ “นานเท่าไรที่เราจะได้ เงินที่ลงทุนไปกลับคืนมา”  Calculated by adding project’s cash inflows to its cost until the cumulative cash flow for the project turns positive.
  • 11.
    10-11 Calculating payback PaybackL =2 + / = 2.375 years CFt -100 10 60 100 Cumulative -100 -90 0 50 0 1 2 3 = 2.4 30 80 80 -30 Project L PaybackS = 1 + / = 1.6 years CFt -100 70 100 20 Cumulative -100 0 20 40 0 1 2 3 = 1.6 30 50 50 -30 Project S
  • 12.
    10-12 Strengths and weaknessesof payback ข้อดีและข้อเสียของระยะเวลาคืน ทุน  Strengths (ข้อดี)  Provides an indication of a project’s risk and liquidity. แสดงความเสี่ยงและสภาพคล่องของโครงการ  Easy to calculate and understand. ง่ายในการคำานวณและทำาความเข้าใจได้ง่าย  Weaknesses (ข้อเสีย)  Ignores the time value of money. ไม่ได้คำานึงถึงมูลค่าของเงินตามเวลา  Ignores CFs occurring after the payback period. ไม่ได้คำานึงถึงกระแสเงินสดที่เกิดขึ้นภายหลังระยะ
  • 13.
    10-13 Discounted payback period Uses discounted cash flows rather than raw CFs. Disc PaybackL = 2 + / = 2.7 years CFt -100 10 60 80 Cumulative -100 -90.91 18.79 0 1 2 3 = 2.7 60.11 -41.32 PV of CFt -100 9.09 49.59 41.32 60.11 10%
  • 14.
    10-14 Net Present Value(NPV) มูลค่าปัจจุบันสุทธิ  Sum of the PVs of all cash inflows and outflows of a project: ยอดรวมของมูลค่าปัจจุบันของกระแส เงินสดเข้า-ออกทั้งหมดของโครงการ ∑= + = n 0t t t )k1( CF NPV
  • 15.
    10-15 What is ProjectL’s NPV? Year CFt PV of CFt 0 -100 -$100 1 10 9.09 2 60 49.59 3 80 60.11 NPVL = $18.79 NPVS = $19.98
  • 16.
    10-16 Solving for NPV: Financialcalculator solution  Enter CFs into the calculator’s CFLO register.  CF0 = -100  CF1 = 10  CF2 = 60  CF3 = 80  Enter I/YR = 10, press NPV button to get NPVL = $18.78.
  • 17.
    10-17 Rationale for theNPV method NPV = PV of inflows – Cost = Net gain in wealth  If projects are independent, accept if the project NPV > 0.  If projects are mutually exclusive, accept projects with the highest positive NPV, those that add the most value.  In this example, would accept S if mutually exclusive (NPVs > NPVL), and would accept both if independent.
  • 18.
    10-18 
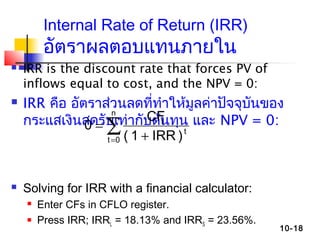
Internal Rate ofReturn (IRR) อัตราผลตอบแทนภายใน  IRR is the discount rate that forces PV of inflows equal to cost, and the NPV = 0:  IRR คือ อัตราส่วนลดที่ทำาให้มูลค่าปัจจุบันของ กระแสเงินสดรับเท่ากับต้นทุน และ NPV = 0:  Solving for IRR with a financial calculator:  Enter CFs in CFLO register.  Press IRR; IRRL = 18.13% and IRRS = 23.56%. ∑= + = n 0t t t )IRR1( CF 0
  • 19.
    10-19 How is aproject’s IRR similar to a bond’s YTM?  They are the same thing.  Think of a bond as a project. The YTM on the bond would be the IRR of the “bond” project.  EXAMPLE: Suppose a 10-year bond with a 9% annual coupon sells for $1,134.20.  Solve for IRR = YTM = 7.08%, the annual return for this project/bond.
  • 20.
    10-20 Rationale for theIRR method เหตุผลของวิธี IRR  If IRR > WACC, the project’s rate of return is greater than its costs. There is some return left over to boost stockholders’ returns.  ถ้า IRR > WACC, อัตราผลตอบแทนของ โครงการจะมากกว่าต้นทุน ทำาให้มีผล ตอบแทนคงเหลืออยู่ซึ่งจะกลายเป็นผล ตอบแทนของผู้ถือหุ้น
  • 21.
    10-21 IRR Acceptance Criteria If IRR > k, accept project.  If IRR < k, reject project.  If projects are independent, accept both projects, as both IRR > k = 10%.  If projects are mutually exclusive, accept S, because IRRs > IRRL.
  • 22.
    10-22 NPV Profiles  Agraphical representation of project NPVs at various different costs of capital.  การแสดงกราฟของโครงการที่ใช้วิธีNPV ณ อัตราต้นทุนของเงินทุนที่แตกต่างกัน k NPVL NPVS 0 $50 $40 5 33 29 10 19 20 15 7 12 20 (4) 5
  • 23.
    10-23 Drawing NPV profiles -10 0 10 20 30 40 50 60 510 15 20 23.6 NPV ($) Discount Rate (%) IRRL = 18.1% IRRS = 23.6% Crossover Point = 8.7% S L . . . .. . . . . . .
  • 24.
    10-24 Comparing the NPVand IRR methods  If projects are independent, the two methods always lead to the same accept/reject decisions.  If projects are mutually exclusive …  If k > crossover point, the two methods lead to the same decision and there is no conflict.  If k < crossover point, the two methods lead to different accept/reject decisions.
  • 25.
    10-25 Finding the crossoverpoint 1. Find cash flow differences between the projects for each year. 2. Enter these differences in CFLO register, then press IRR. Crossover rate = 8.68%, rounded to 8.7%. 3. Can subtract S from L or vice versa, but better to have first CF negative. 4. If profiles don’t cross, one project dominates the other.
  • 26.
    10-26 Reasons why NPVprofiles cross  Size (scale) differences – the smaller project frees up funds at t = 0 for investment. The higher the opportunity cost, the more valuable these funds, so high k favors small projects.  Timing differences – the project with faster payback provides more CF in early years for reinvestment. If k is high, early CF especially good, NPVS > NPVL.
  • 27.
    10-27 Reinvestment rate assumptions NPV method assumes CFs are reinvested at k, the opportunity cost of capital.  IRR method assumes CFs are reinvested at IRR.  Assuming CFs are reinvested at the opportunity cost of capital is more realistic, so NPV method is the best. NPV method should be used to choose between mutually exclusive projects.  Perhaps a hybrid of the IRR that assumes cost of capital reinvestment is needed.
  • 28.
    10-28 Since managers preferthe IRR to the NPV method, is there a better IRR measure?  Yes, MIRR is the discount rate that causes the PV of a project’s terminal value (TV) to equal the PV of costs. TV is found by compounding inflows at WACC.  MIRR assumes cash flows are reinvested at the WACC.
  • 29.
    10-29 Calculating MIRR 66.0 12.1 10% 10% -100.0 10.060.0 80.0 0 1 2 310% PV outflows 100.0 $100 MIRR = 16.5% 158.1 TV inflows MIRRL = 16.5% $158.1 (1 + MIRRL)3 =
  • 30.
    10-30 Calculating MIRR :ProjectX 392.0 200.70 12% 12% -500.0 160.0 350.0 300.0 0 1 2 312% PV outflows 500.0 $500 MIRR = 21.31% 892.70 TV inflows MIRRX = 21.31% $892.70 (1 + MIRRX)3 =
  • 31.
    10-31 Why use MIRRversus IRR?  MIRR correctly assumes reinvestment at opportunity cost = WACC. MIRR also avoids the problem of multiple IRRs.  MIRR มีข้อสมมติฐานว่าจะนำาCFกลับไปลงทุน ใหม่โดยคิดอัตราเดียวกับต้นทุนเสียโอกาสซึ่ง เท่ากับอัตราWACC การใช้ MIRR จะไม่ทำาให้เกิดคำาตอบมากกว่า หนึ่งคำาตอบดังเช่นที่อาจเกิดขึ้นได้ถ้าใช้วิธี IRR
  • 32.
    10-32 Why use MIRRversus IRR?  Managers like rate of return comparisons, and MIRR is better for this than IRR.  ผู้บริหารที่ชอบการเปรียบเทียบระหว่างอัตราผล ตอบแทนของโครงการ วิธี MIRR จะเป็น วิธีที่น่าใช้มากกว่าวิธี IRR
  • 33.
    10-33 Project P hascash flows (in 000s): CF0 = -$800, CF1 = $5,000, and CF2 = -$5,000. Find Project P’s NPV and IRR.  Enter CFs into calculator CFLO register.  Enter I/YR = 10.  NPV = -$386.78.  IRR = ERROR Why? -800 5,000 -5,000 0 1 2 k = 10%
  • 34.
  • 35.
    10-35 Why are theremultiple IRRs?  At very low discount rates, the PV of CF2 is large & negative, so NPV < 0.  At very high discount rates, the PV of both CF1 and CF2 are low, so CF0 dominates and again NPV < 0.  In between, the discount rate hits CF2 harder than CF1, so NPV > 0.  Result: 2 IRRs.
  • 36.
    10-36 Solving the multipleIRR problem  Using a calculator  Enter CFs as before.  Store a “guess” for the IRR (try 10%) 10 ■ STO ■ IRR = 25% (the lower IRR)  Now guess a larger IRR (try 200%) 200 ■ STO ■ IRR = 400% (the higher IRR)  When there are nonnormal CFs and more than one IRR, use the MIRR.
  • 37.
    10-37 When to usethe MIRR instead of the IRR? Accept Project P?  When there are nonnormal CFs and more than one IRR, use MIRR.  PV of outflows @ 10% = -$4,932.2314.  TV of inflows @ 10% = $5,500.  MIRR = 5.6%.  Do not accept Project P.  NPV = -$386.78 < 0.  MIRR = 5.6% < k = 10%.