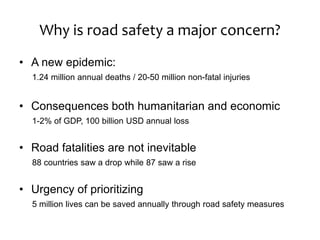
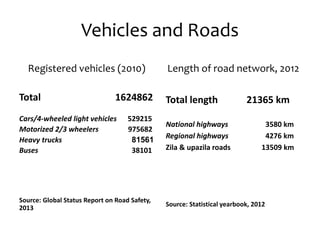
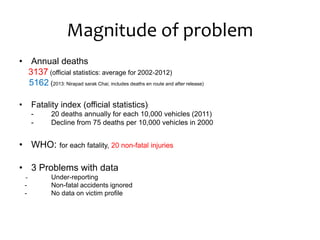
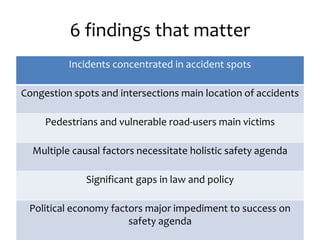
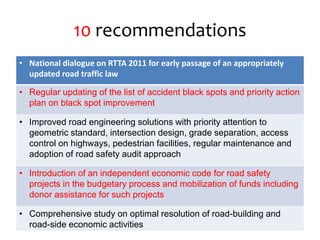
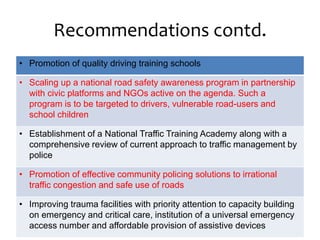
Road Safety in Bangladesh
Realities and Challenges
Hossain Zillur Rahman
Power and Participation Research Centre (PPRC)
Why is road safety a major concern?
• A new epidemic:
1.24 million annual deaths / 20-50 million non-fatal injuries
• Consequences both humanitarian and economic
1-2% of GDP, 100 billion USD annual loss
• Road fatalities are not inevitable
88 countries saw a drop while 87 saw a rise
• Urgency of prioritizing
5 million lives can be saved annually through road safety measures
Research strategy
• Scope
• Assess magnitude of problem
• Identify causal factors
• Institutional landscape
• Action priorities
• Multi-disciplinary research team of experts and
practitioners
• Research strategy
• In-depth analysis of official statistics
• Review of international experiences
• In-depth consultations with key stakeholders
• Survey of drivers
• Field research on four highway spots: Dhaka-Aricha, Dhaka-Tangail
Vehicles and Roads
Registered vehicles (2010)
Total 1624862
Cars/4-wheeled light vehicles 529215
Motorized 2/3 wheelers 975682
Heavy trucks 81561
Buses 38101
Source: Global Status Report on Road Safety,
2013
Length of road network, 2012
Total length 21365 km
National highways 3580 km
Regional highways 4276 km
Zila & upazila roads 13509 km
Source: Statistical yearbook, 2012
Magnitude of problem
• Annual deaths
3137 (official statistics: average for 2002-2012)
5162 (2013: Nirapad sarak Chai; includes deaths en route and after release)
• Fatality index (official statistics):
- 20 deaths annually for each 10,000 vehicles (2011)
- Decline from 75 deaths per 10,000 vehicles in 2000
• WHO: for each fatality, 20 non-fatal injuries
• 3 Problems with data
- Under-reporting
- Non-fatal accidents ignored
- No data on victim profile
Where do accidents occur?
• Accident-prone districts
Dhaka, Chittagong, Comilla, Tangail, Sirajganj
• 208 accident black spots (RHD list)
• Accident-prone highway length: 57 km
• Most accidents in congestion spots and inter-
sections rather than isolated stretches
Accident-prone highway length
1.6
2.2
2.6
5.1
5.8
6.4
7.9
8.8
16.5
0 3 6 9 12 15 18
N3 Dhaka -Mymensingh
N405 Bangabandhu Shetu (Jamuna Bridge) approach road
N4 Gazipur-Tangail-Jamalpur
N2 Dhaka-Sylhet
N8 Daulatdia-Jhenaidah-Khulna
N7 Nagarbari-Rajshahi
N6 Nagarbari-Banglabandh
N5 Dhaka-Aricha
N1 Dhaka-Chittagong
Highway
Accident-prone length (km)
Classification of Accident spots
Bus stand, 40.90%
Road inter-sections,
17.80%
Bazar, 28.40%
Others, 13.00%
Victims and perpetrators
Victims Accident types Perpetrators
Pedestrians 41% Hit-and-run 42% Bus 38%
Bus/car
passengers
19% Head-on
collision
19% Truck 31%
2/3 wheelers
riders/passenger
s
16% Over-turned 13% Motor-cycles 12%
Truck/bus
drivers/passeng
er
14% Rear-end hit 9% Cars/jeeps 11%
Cyclists 3% Side swipe 6% 3 wheelers 9%
Post-accident needs
Short-term/immediate Long-term
Need Ideal provider Need Ideal provider
• First aid Local people, vehicle
staff, nearby medical
centre, adjoining local
govt reps
• Compensation Courts, insurance
companies
• Transportatio
n
Local people, nearby
medical centre, police,
• Long-term
treatment
Family, government
• Protect
people &
vehicles
Police, local leaders • Assistive devices Family, community,
insurance companies
• Compensatio
n for victim
Vehicle owners, Insurance
companies
• IG skills for
disabled
NGOs, social
entrepreneurs
• Employment for
alternative family
member
Government,
community
Reality check on post-crash facilities
Post-crash care Availability
• Emergency room based injury surveillance system No
• Emergency access telephone number No
• Seriously injured transported by ambulance <10%
• Permanently disabled due to lack of facilities 13%
• Emergency training for doctors No
• Emergency training for nurses No
• Trauma centres Severely inadequate
Driver profiles
Variable Finding
Age 24-35 years: 47%
36-50 years: 48%
Education 48% secondary or equivalent
Only 8% wholly illiterate
Earner 70% single earner families
22% two earner families
Housing 41% rural residence/sleep in vehicles
33% rented house
21% in dormitories (‘mess’)
Monthly income 47% - Tk 15-20 thousand
19% - Tk. 10-15 thousand
16% - Tk. 20-25 thousand
15% - Tk. 26-50 thousand
Nature of income Trip-based; only 9% have fixed monthly
income
Driver characteristics
Characteristic Finding
License • 97% report having license
• 20% report obtaining license without test
• 92% pay bribe and 54% face severe time delays in obtaining
license
Trade union • 80% are unionised
Training • 81% learnt driving skills through informal process usually with a
‘mentor’ (ustad)
• Learning hours with ustad 1500
• Commercial learning hours is 93
Cost of training • Informal process: approx Tk. 4000
• Formal process: approx Tk 6000
Confidence on learning • 70% fully confident
Work-load • About 20% extremely over-worked with 6-7 days weekly and 13-
16 hours daily
Accident penalty • 42% faced no penalty in case of accidents
• 58% of incurred accidents minor in nature
9 Causes of accidents
• Reckless driving
• Untrained drivers
• Unfit vehicles
• Simultaneous operation of motorized and non-motorized
vehicles without separation and adequate rules
• Vulnerable road-side activities
• Faulty road design
• Poor traffic enforcement
• Lack of road safety awareness and risky pedestrian behavior
• Culture of impunity and poor legal redress
Additional causes highlighted in field research
• Mental, physical and financial pressures on drivers
• General lack of road safety awareness
• Absence of supplementary facilities on roads – hard
shoulder, bus bays, helpful signal & markings, access roads
• Failure to productively reconcile local economic growth
needs with road safety needs
Laws and Institutions
• MVO 1983 is updated version of 1913 law
• Major new initiative on new law –
RTTA, 2011 but yet to materialize
• Institutions
BRTA, Metropolitan, district and highway police, RTC, ARI, RHD,
LGED
Perceptions on recent progress and setbacks
Perceptions on progress
Perception % of response
----------------------------------------------
New roads built and 84%
others repaired
----------------------------------------------------
Road dividers/introduction 34%
of 1-way system
----------------------------------------------------
Building of fly-overs 32%
& over-bridges
----------------------------------------------------
Increase in number of 21%
highway police
---------------------------------------------------
Some road curves have been 20%
straightened
Perceptions on setbacks
Perceptions % of response
------------------------------------------------
Increased extortion on 62%
highways by police/
ruling party activists
----------------------------------------------------------------------
Increased traffic of unlicensed 43%
informal transports
(nasimon/karimon/easy bikes)
----------------------------------------------------------------------
Proliferation of road-side markets 39%
----------------------------------------------------------------------
Improper and irregular road 21%
repair and maintenance
----------------------------------------------------------------------
Illegal truck stands & parking 20%
on highway
----------------------------------------------------------------------
Proliferation of unfit vehicles on the roads 11%
----------------------------------------------------------------------
Lack of pedestrian awareness 8%
6 findings that matter
Incidents concentrated in accident spots
Congestion spots and intersections main location of accidents
Pedestrians and vulnerable road-users main victims
Multiple causal factors necessitate holistic safety agenda
Significant gaps in law and policy
Political economy factors major impediment to success on
safety agenda
10 recommendations
• National dialogue on RTTA 2011 for early passage of an appropriately
updated road traffic law
• Regular updating of the list of accident black spots and priority action
plan on black spot improvement
• Improved road engineering solutions with priority attention to
geometric standard, intersection design, grade separation, access
control on highways, pedestrian facilities, regular maintenance and
adoption of road safety audit approach
• Introduction of an independent economic code for road safety
projects in the budgetary process and mobilization of funds including
donor assistance for such projects
• Comprehensive study on optimal resolution of road-building and
road-side economic activities
Recommendations contd.
• Promotion of quality driving training schools
• Scaling up a national road safety awareness program in partnership
with civic platforms and NGOs active on the agenda. Such a
program is to be targeted to drivers, vulnerable road-users and
school children
• Establishment of a National Traffic Training Academy along with a
comprehensive review of current approach to traffic management by
police
• Promotion of effective community policing solutions to irrational
traffic congestion and safe use of roads
• Improving trauma facilities with priority attention to capacity building
on emergency and critical care, institution of a universal emergency
access number and affordable provision of assistive devices
4 advocacy priorities
 Social communication targeted to drivers and vulnerable road users
 Awareness program targeted to school children
 Focused workshops with administrative departments – RHD, LGED,
Ministry of Communication, Ministry of Health and local government
bodies aimed at making such bodies more pro-active in realization of their
road safety plans
 Policy advocacy on updated road transport and traffic legislation

Road safety - Realities & Challenges

  • 1.
    Road Safety inBangladesh Realities and Challenges Hossain Zillur Rahman Power and Participation Research Centre (PPRC)
  • 2.
    Why is roadsafety a major concern? • A new epidemic: 1.24 million annual deaths / 20-50 million non-fatal injuries • Consequences both humanitarian and economic 1-2% of GDP, 100 billion USD annual loss • Road fatalities are not inevitable 88 countries saw a drop while 87 saw a rise • Urgency of prioritizing 5 million lives can be saved annually through road safety measures
  • 3.
    Research strategy • Scope •Assess magnitude of problem • Identify causal factors • Institutional landscape • Action priorities • Multi-disciplinary research team of experts and practitioners • Research strategy • In-depth analysis of official statistics • Review of international experiences • In-depth consultations with key stakeholders • Survey of drivers • Field research on four highway spots: Dhaka-Aricha, Dhaka-Tangail
  • 4.
    Vehicles and Roads Registeredvehicles (2010) Total 1624862 Cars/4-wheeled light vehicles 529215 Motorized 2/3 wheelers 975682 Heavy trucks 81561 Buses 38101 Source: Global Status Report on Road Safety, 2013 Length of road network, 2012 Total length 21365 km National highways 3580 km Regional highways 4276 km Zila & upazila roads 13509 km Source: Statistical yearbook, 2012
  • 5.
    Magnitude of problem •Annual deaths 3137 (official statistics: average for 2002-2012) 5162 (2013: Nirapad sarak Chai; includes deaths en route and after release) • Fatality index (official statistics): - 20 deaths annually for each 10,000 vehicles (2011) - Decline from 75 deaths per 10,000 vehicles in 2000 • WHO: for each fatality, 20 non-fatal injuries • 3 Problems with data - Under-reporting - Non-fatal accidents ignored - No data on victim profile
  • 6.
    Where do accidentsoccur? • Accident-prone districts Dhaka, Chittagong, Comilla, Tangail, Sirajganj • 208 accident black spots (RHD list) • Accident-prone highway length: 57 km • Most accidents in congestion spots and inter- sections rather than isolated stretches
  • 7.
    Accident-prone highway length 1.6 2.2 2.6 5.1 5.8 6.4 7.9 8.8 16.5 03 6 9 12 15 18 N3 Dhaka -Mymensingh N405 Bangabandhu Shetu (Jamuna Bridge) approach road N4 Gazipur-Tangail-Jamalpur N2 Dhaka-Sylhet N8 Daulatdia-Jhenaidah-Khulna N7 Nagarbari-Rajshahi N6 Nagarbari-Banglabandh N5 Dhaka-Aricha N1 Dhaka-Chittagong Highway Accident-prone length (km)
  • 8.
    Classification of Accidentspots Bus stand, 40.90% Road inter-sections, 17.80% Bazar, 28.40% Others, 13.00%
  • 9.
    Victims and perpetrators VictimsAccident types Perpetrators Pedestrians 41% Hit-and-run 42% Bus 38% Bus/car passengers 19% Head-on collision 19% Truck 31% 2/3 wheelers riders/passenger s 16% Over-turned 13% Motor-cycles 12% Truck/bus drivers/passeng er 14% Rear-end hit 9% Cars/jeeps 11% Cyclists 3% Side swipe 6% 3 wheelers 9%
  • 10.
    Post-accident needs Short-term/immediate Long-term NeedIdeal provider Need Ideal provider • First aid Local people, vehicle staff, nearby medical centre, adjoining local govt reps • Compensation Courts, insurance companies • Transportatio n Local people, nearby medical centre, police, • Long-term treatment Family, government • Protect people & vehicles Police, local leaders • Assistive devices Family, community, insurance companies • Compensatio n for victim Vehicle owners, Insurance companies • IG skills for disabled NGOs, social entrepreneurs • Employment for alternative family member Government, community
  • 11.
    Reality check onpost-crash facilities Post-crash care Availability • Emergency room based injury surveillance system No • Emergency access telephone number No • Seriously injured transported by ambulance <10% • Permanently disabled due to lack of facilities 13% • Emergency training for doctors No • Emergency training for nurses No • Trauma centres Severely inadequate
  • 12.
    Driver profiles Variable Finding Age24-35 years: 47% 36-50 years: 48% Education 48% secondary or equivalent Only 8% wholly illiterate Earner 70% single earner families 22% two earner families Housing 41% rural residence/sleep in vehicles 33% rented house 21% in dormitories (‘mess’) Monthly income 47% - Tk 15-20 thousand 19% - Tk. 10-15 thousand 16% - Tk. 20-25 thousand 15% - Tk. 26-50 thousand Nature of income Trip-based; only 9% have fixed monthly income
  • 13.
    Driver characteristics Characteristic Finding License• 97% report having license • 20% report obtaining license without test • 92% pay bribe and 54% face severe time delays in obtaining license Trade union • 80% are unionised Training • 81% learnt driving skills through informal process usually with a ‘mentor’ (ustad) • Learning hours with ustad 1500 • Commercial learning hours is 93 Cost of training • Informal process: approx Tk. 4000 • Formal process: approx Tk 6000 Confidence on learning • 70% fully confident Work-load • About 20% extremely over-worked with 6-7 days weekly and 13- 16 hours daily Accident penalty • 42% faced no penalty in case of accidents • 58% of incurred accidents minor in nature
  • 14.
    9 Causes ofaccidents • Reckless driving • Untrained drivers • Unfit vehicles • Simultaneous operation of motorized and non-motorized vehicles without separation and adequate rules • Vulnerable road-side activities • Faulty road design • Poor traffic enforcement • Lack of road safety awareness and risky pedestrian behavior • Culture of impunity and poor legal redress
  • 15.
    Additional causes highlightedin field research • Mental, physical and financial pressures on drivers • General lack of road safety awareness • Absence of supplementary facilities on roads – hard shoulder, bus bays, helpful signal & markings, access roads • Failure to productively reconcile local economic growth needs with road safety needs
  • 16.
    Laws and Institutions •MVO 1983 is updated version of 1913 law • Major new initiative on new law – RTTA, 2011 but yet to materialize • Institutions BRTA, Metropolitan, district and highway police, RTC, ARI, RHD, LGED
  • 17.
    Perceptions on recentprogress and setbacks Perceptions on progress Perception % of response ---------------------------------------------- New roads built and 84% others repaired ---------------------------------------------------- Road dividers/introduction 34% of 1-way system ---------------------------------------------------- Building of fly-overs 32% & over-bridges ---------------------------------------------------- Increase in number of 21% highway police --------------------------------------------------- Some road curves have been 20% straightened Perceptions on setbacks Perceptions % of response ------------------------------------------------ Increased extortion on 62% highways by police/ ruling party activists ---------------------------------------------------------------------- Increased traffic of unlicensed 43% informal transports (nasimon/karimon/easy bikes) ---------------------------------------------------------------------- Proliferation of road-side markets 39% ---------------------------------------------------------------------- Improper and irregular road 21% repair and maintenance ---------------------------------------------------------------------- Illegal truck stands & parking 20% on highway ---------------------------------------------------------------------- Proliferation of unfit vehicles on the roads 11% ---------------------------------------------------------------------- Lack of pedestrian awareness 8%
  • 18.
    6 findings thatmatter Incidents concentrated in accident spots Congestion spots and intersections main location of accidents Pedestrians and vulnerable road-users main victims Multiple causal factors necessitate holistic safety agenda Significant gaps in law and policy Political economy factors major impediment to success on safety agenda
  • 19.
    10 recommendations • Nationaldialogue on RTTA 2011 for early passage of an appropriately updated road traffic law • Regular updating of the list of accident black spots and priority action plan on black spot improvement • Improved road engineering solutions with priority attention to geometric standard, intersection design, grade separation, access control on highways, pedestrian facilities, regular maintenance and adoption of road safety audit approach • Introduction of an independent economic code for road safety projects in the budgetary process and mobilization of funds including donor assistance for such projects • Comprehensive study on optimal resolution of road-building and road-side economic activities
  • 20.
    Recommendations contd. • Promotionof quality driving training schools • Scaling up a national road safety awareness program in partnership with civic platforms and NGOs active on the agenda. Such a program is to be targeted to drivers, vulnerable road-users and school children • Establishment of a National Traffic Training Academy along with a comprehensive review of current approach to traffic management by police • Promotion of effective community policing solutions to irrational traffic congestion and safe use of roads • Improving trauma facilities with priority attention to capacity building on emergency and critical care, institution of a universal emergency access number and affordable provision of assistive devices
  • 21.
    4 advocacy priorities Social communication targeted to drivers and vulnerable road users  Awareness program targeted to school children  Focused workshops with administrative departments – RHD, LGED, Ministry of Communication, Ministry of Health and local government bodies aimed at making such bodies more pro-active in realization of their road safety plans  Policy advocacy on updated road transport and traffic legislation