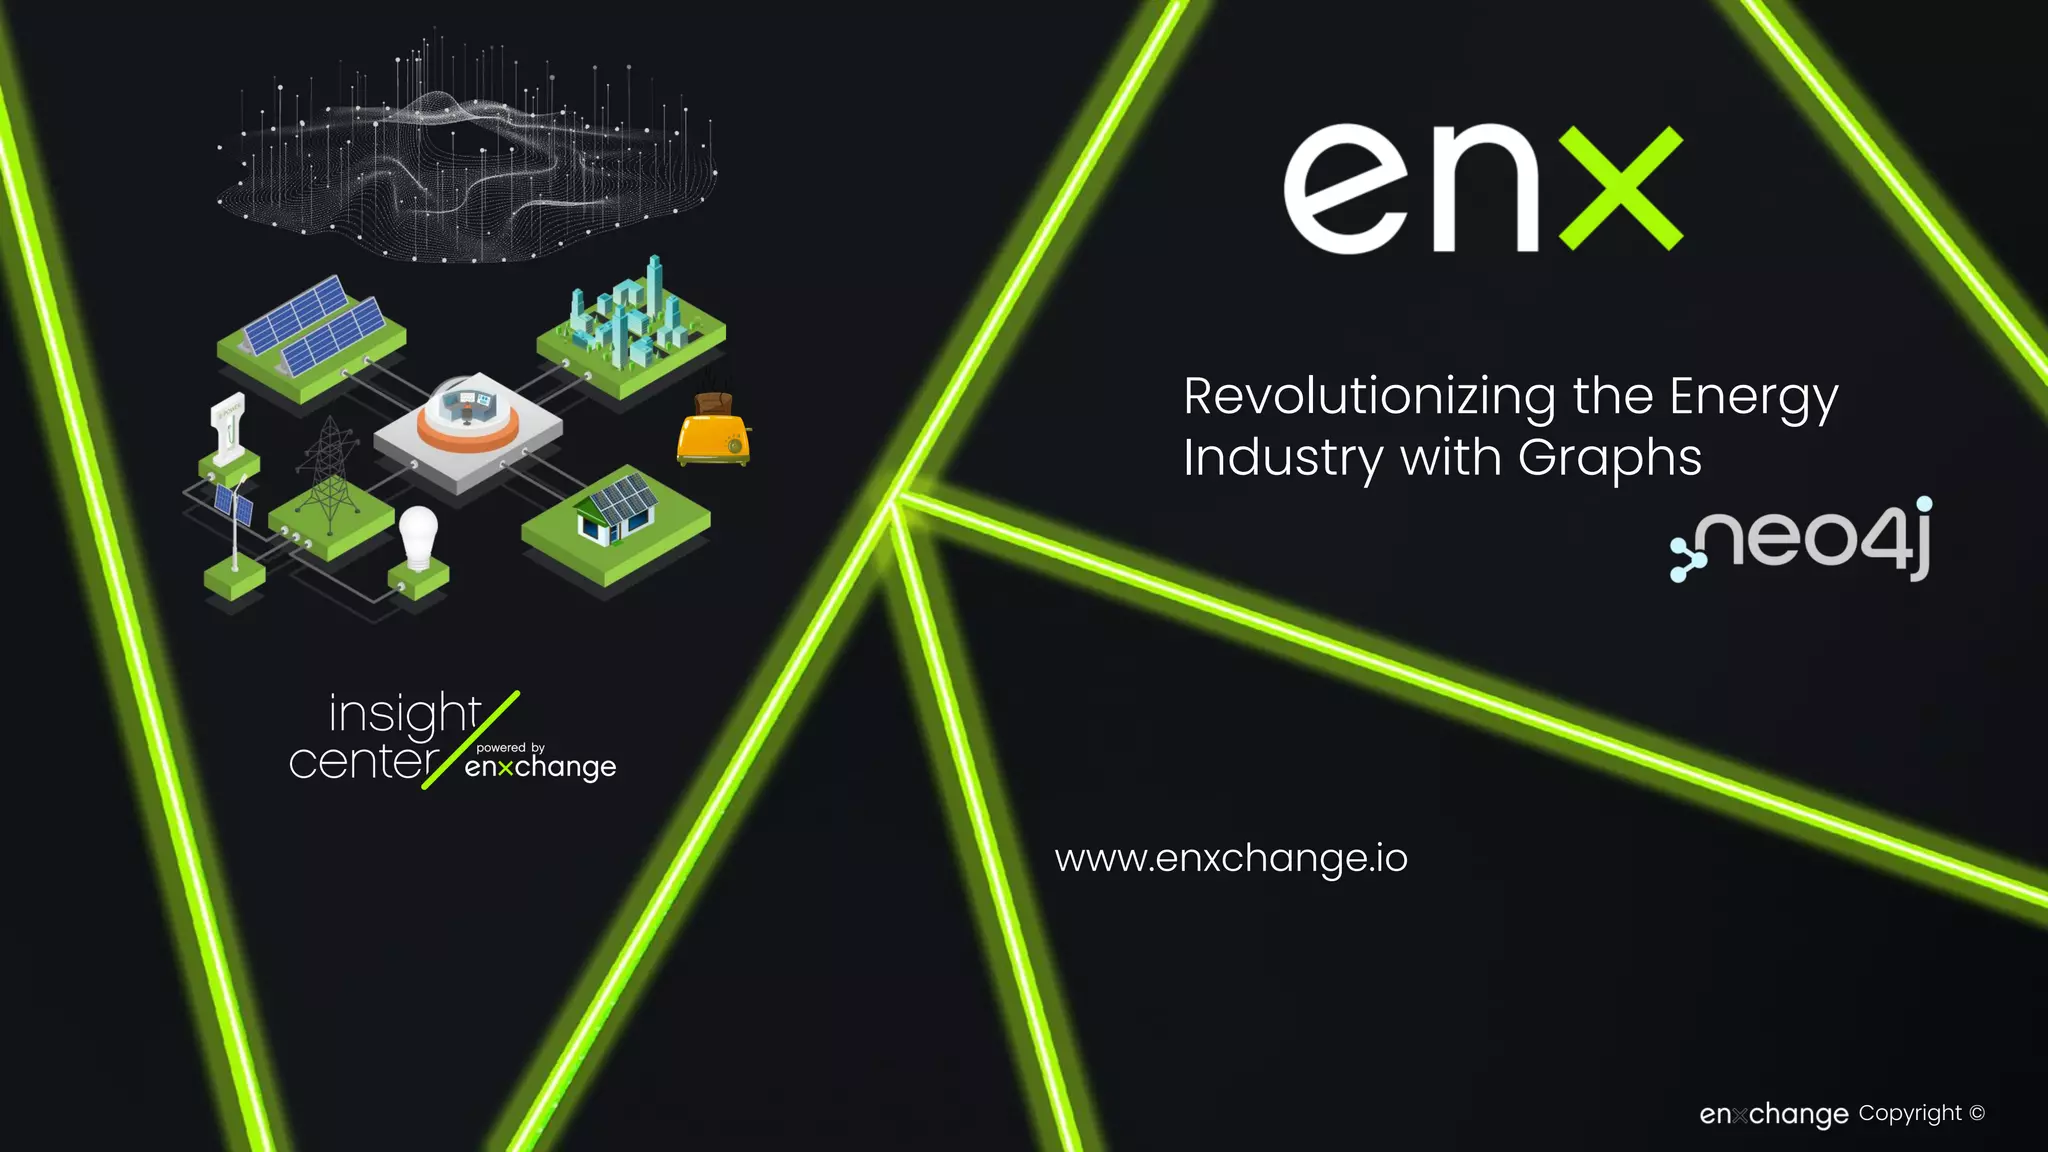
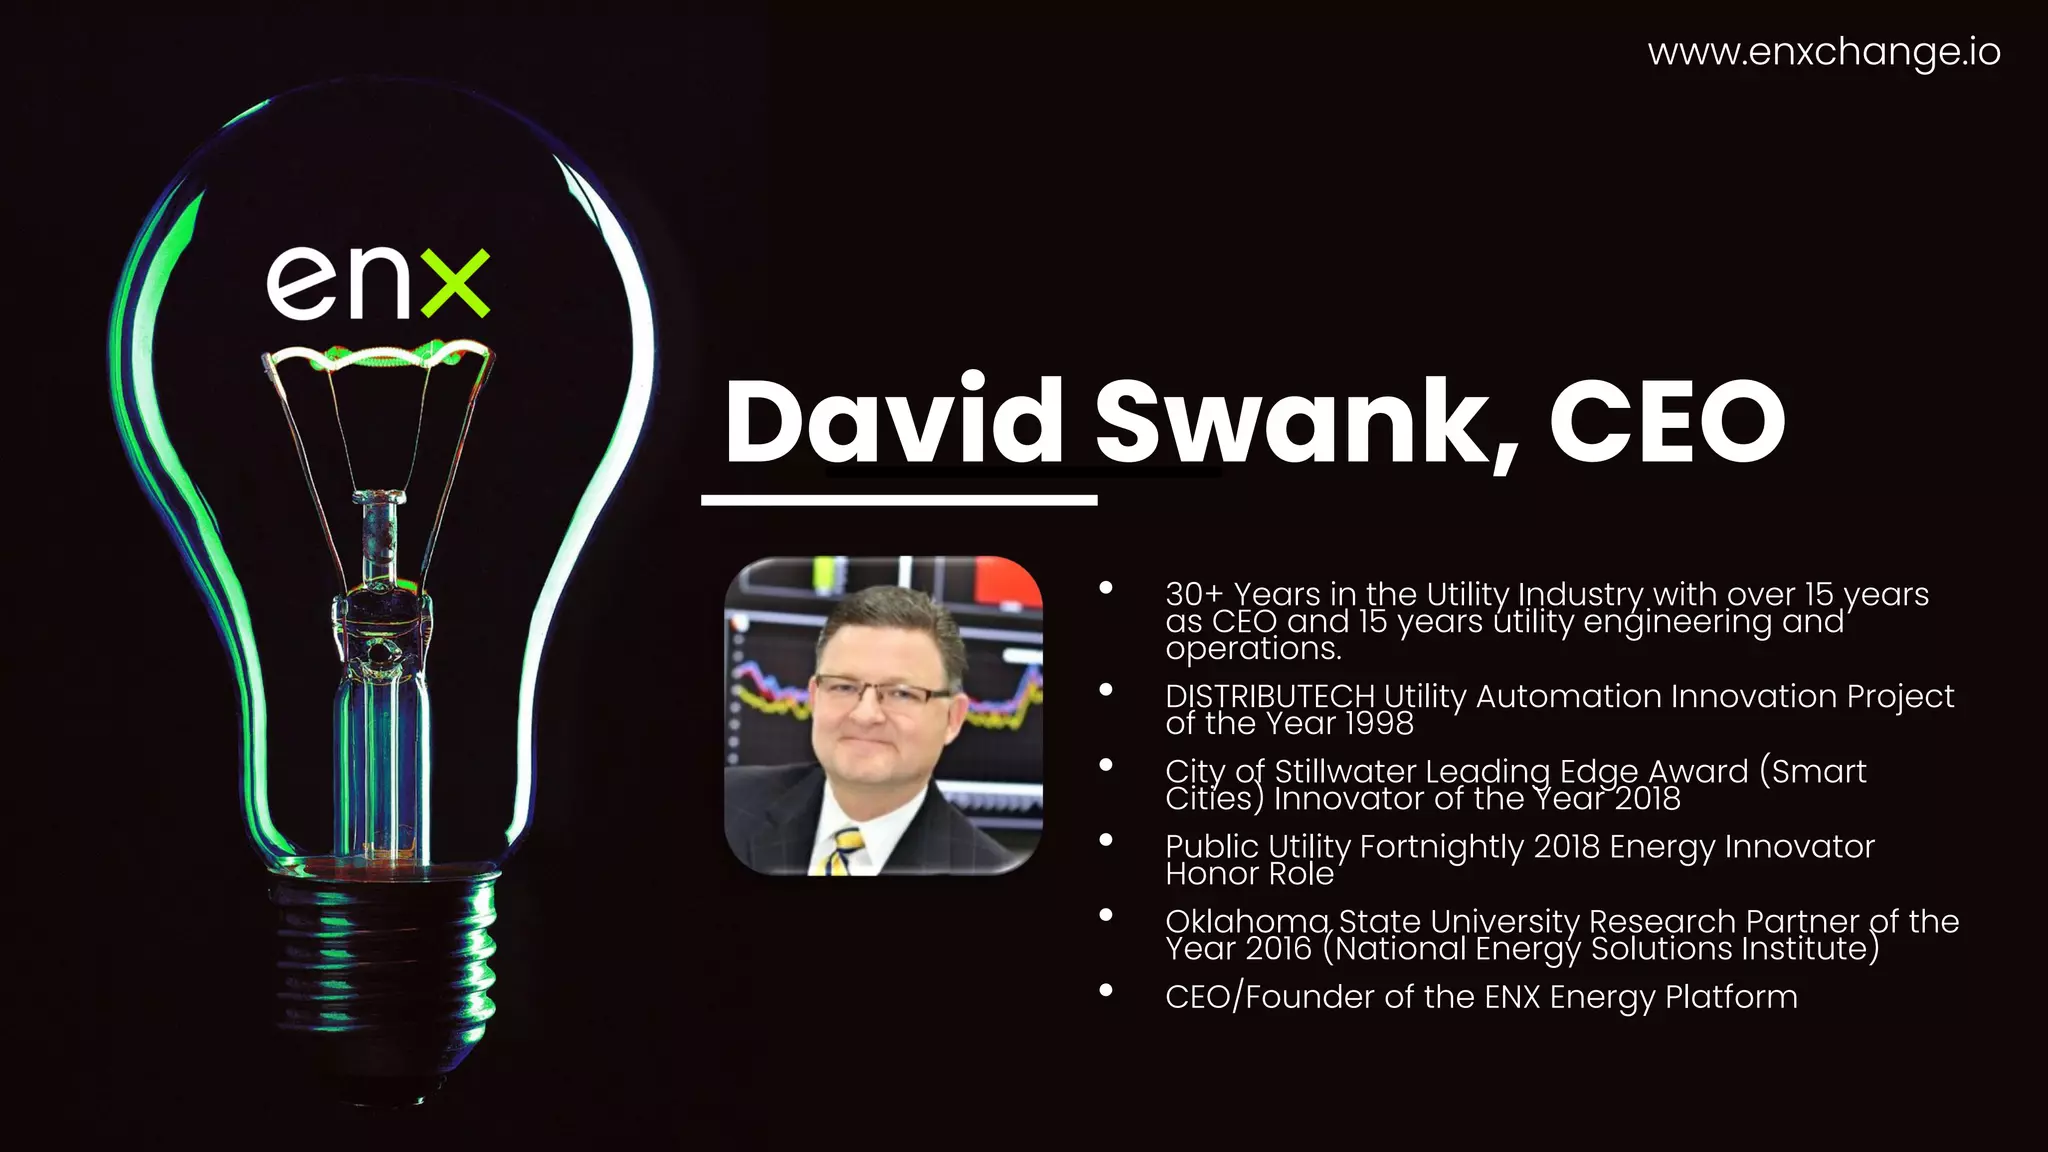
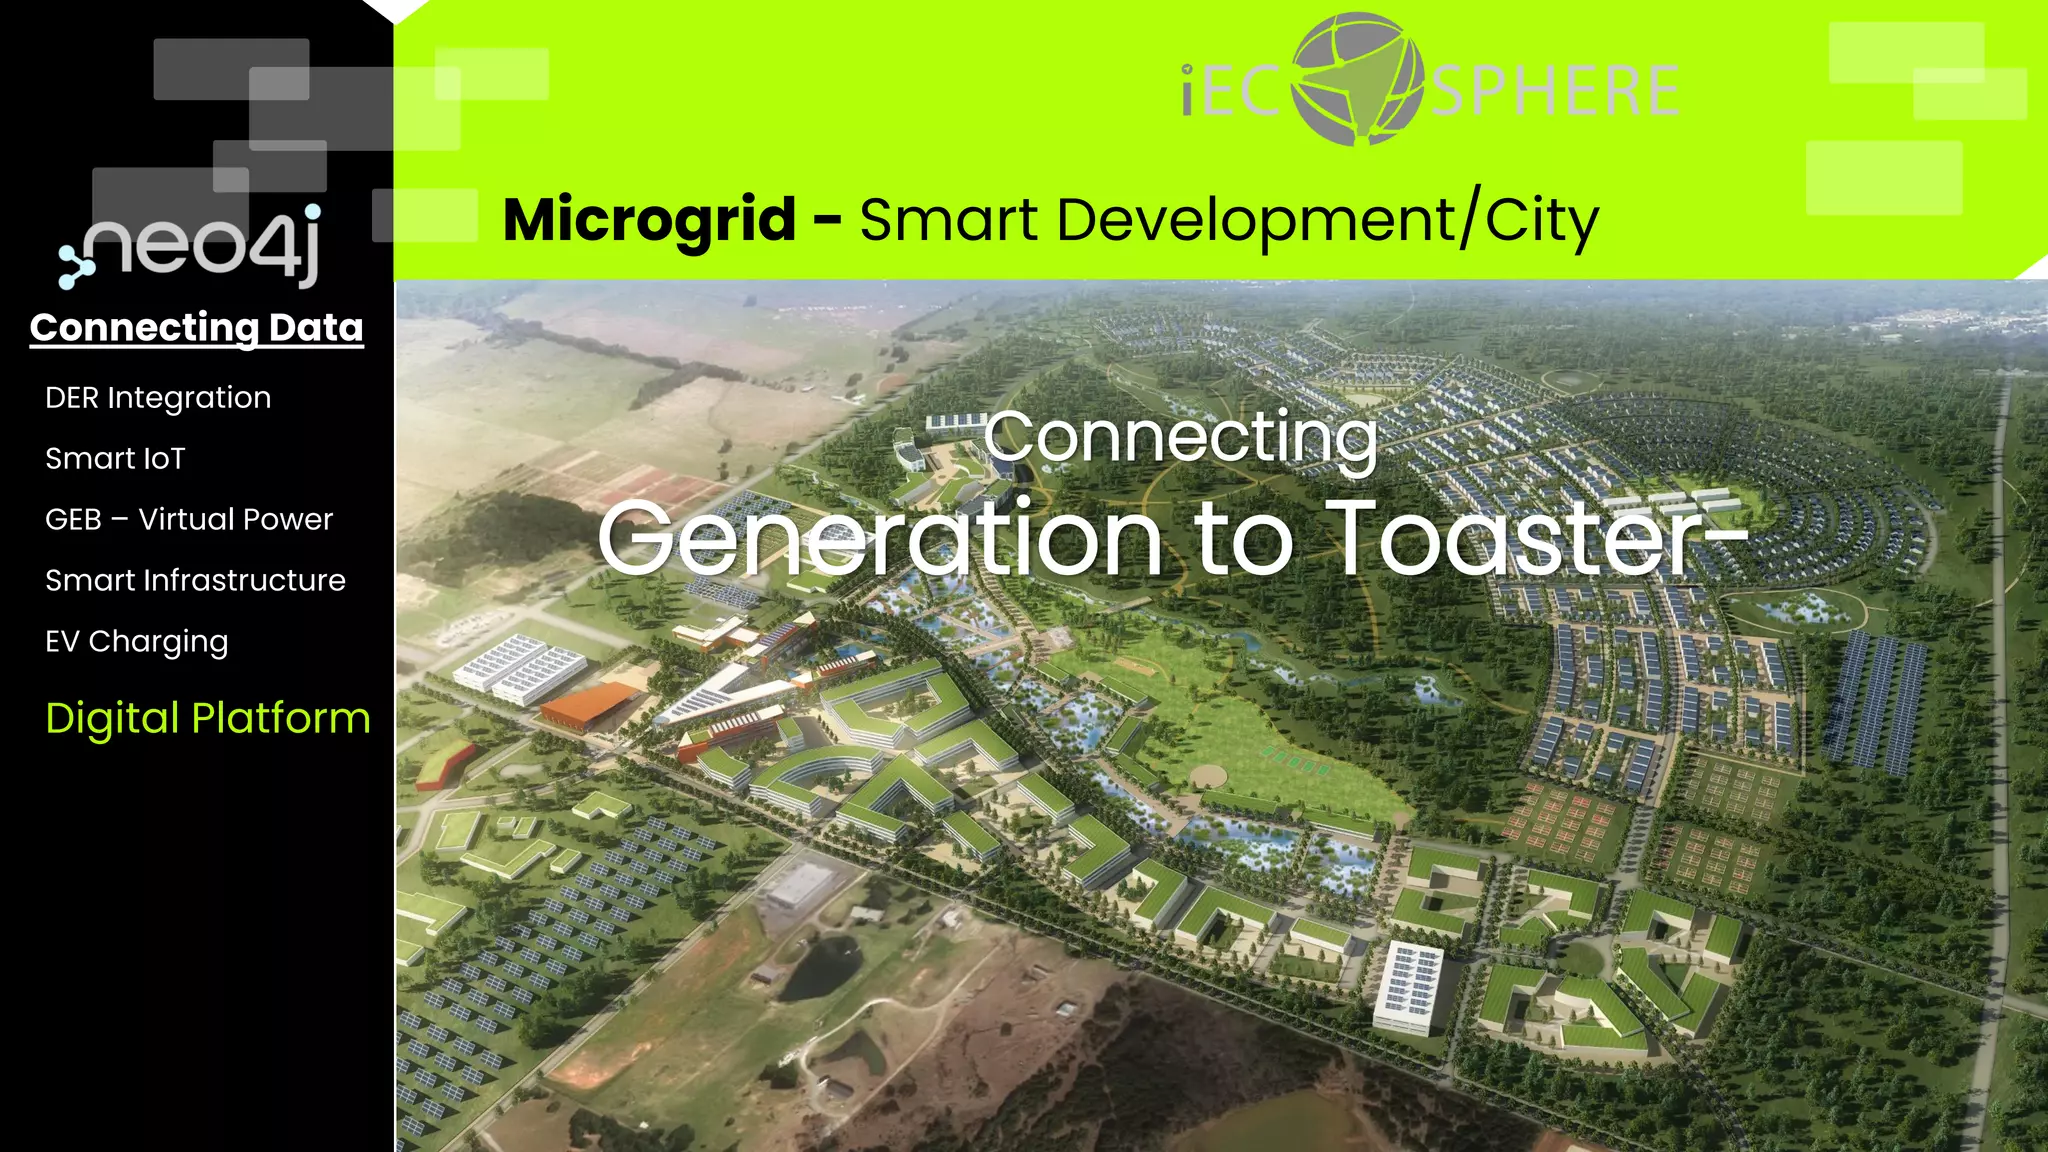
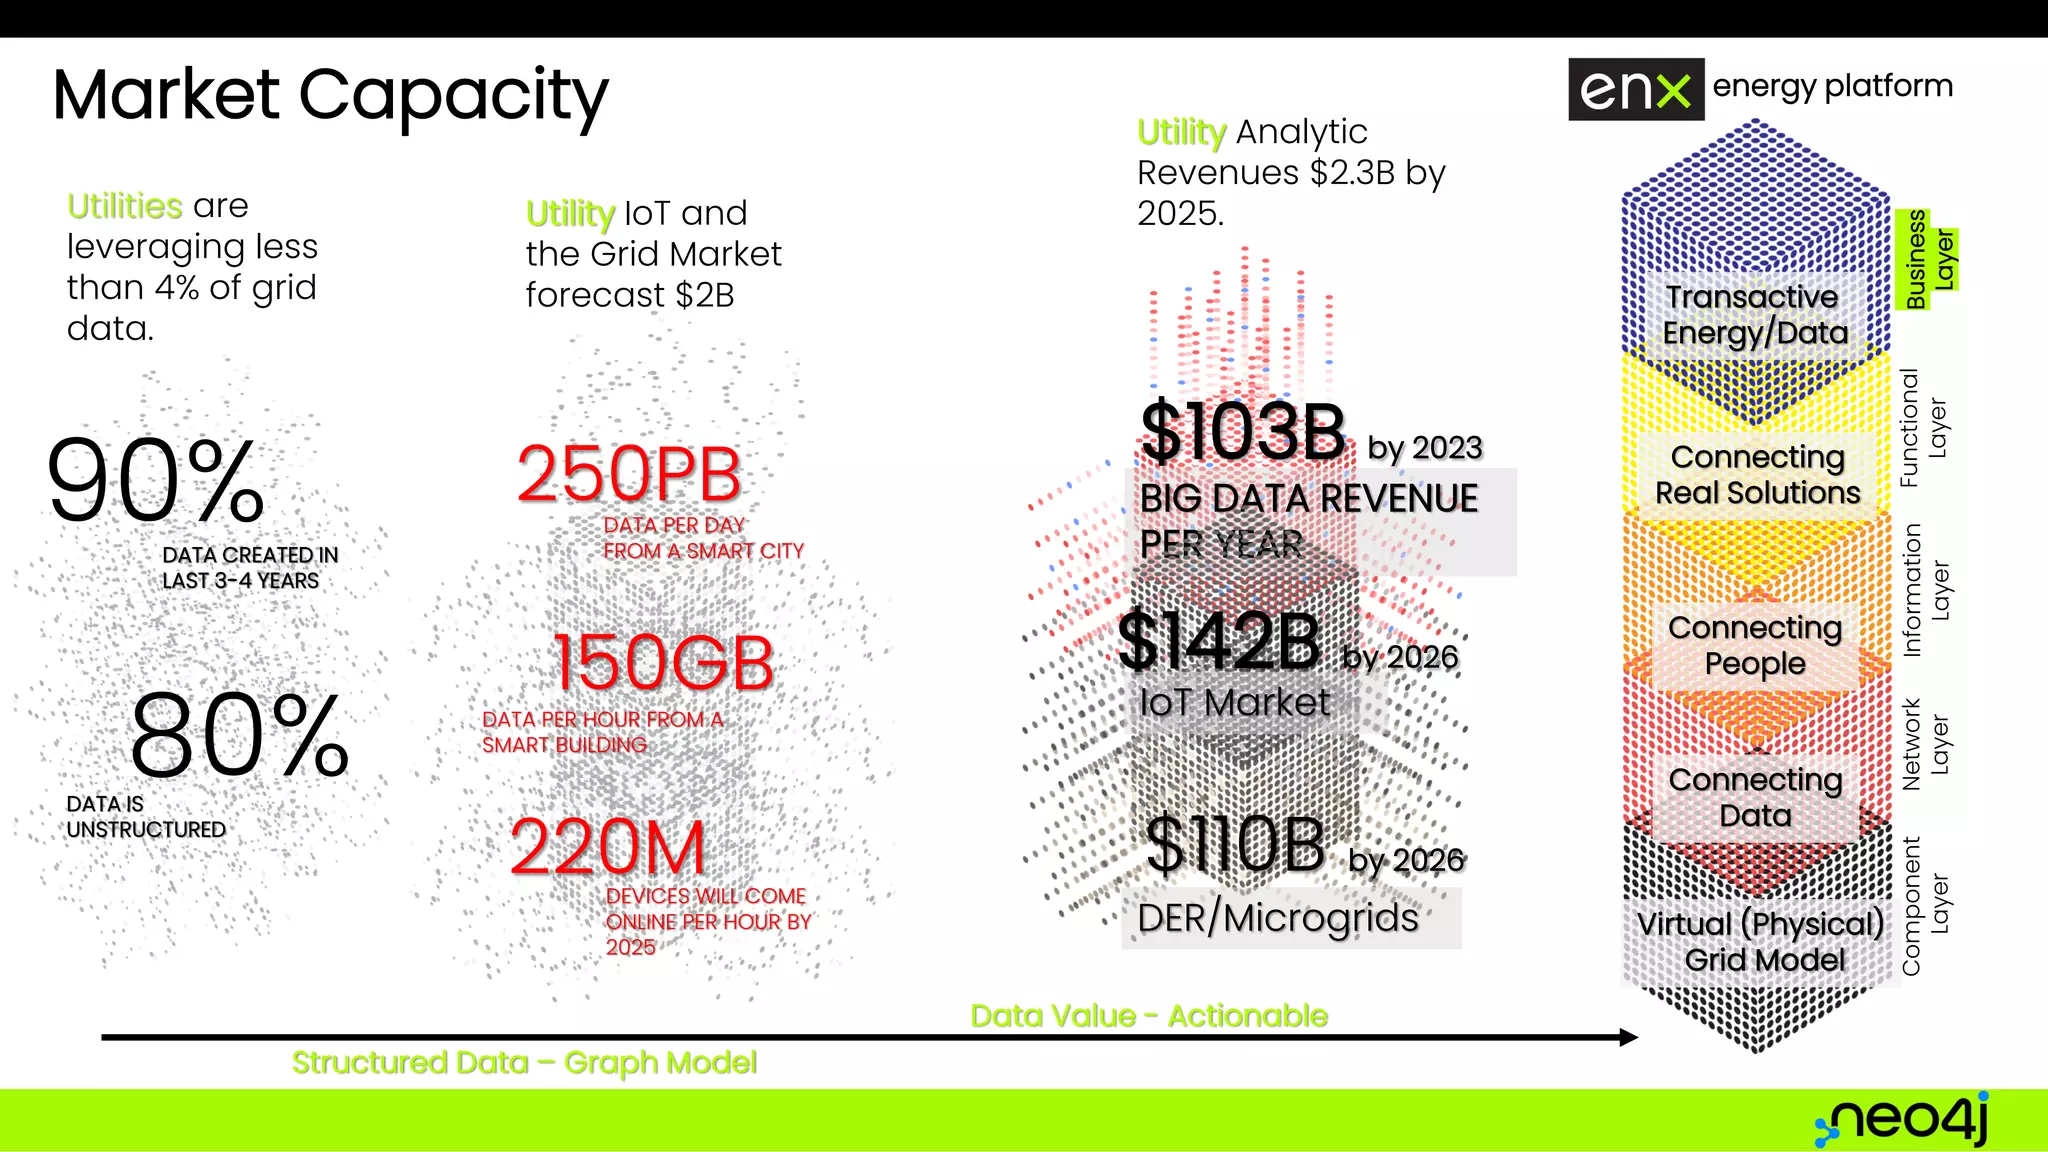
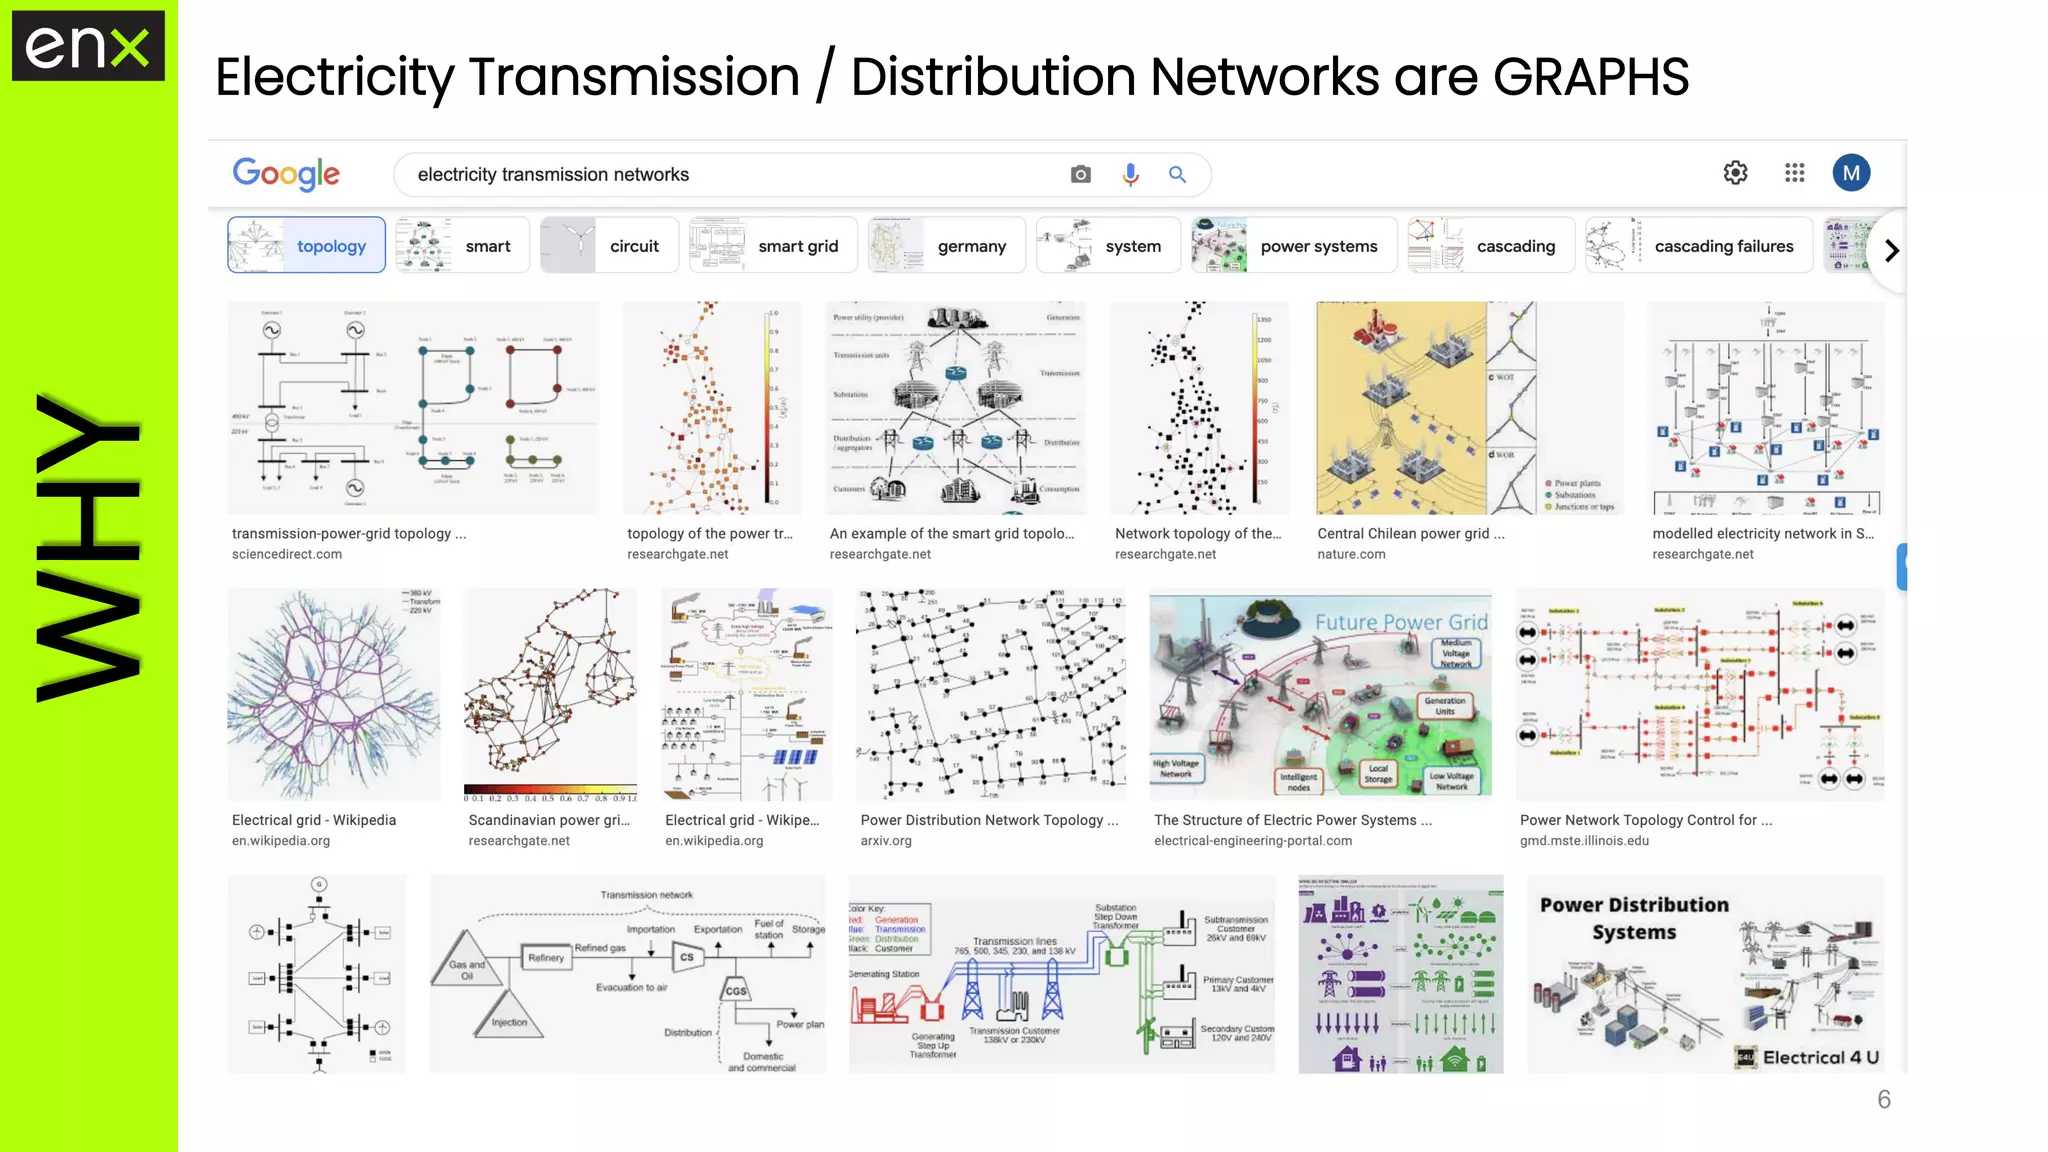
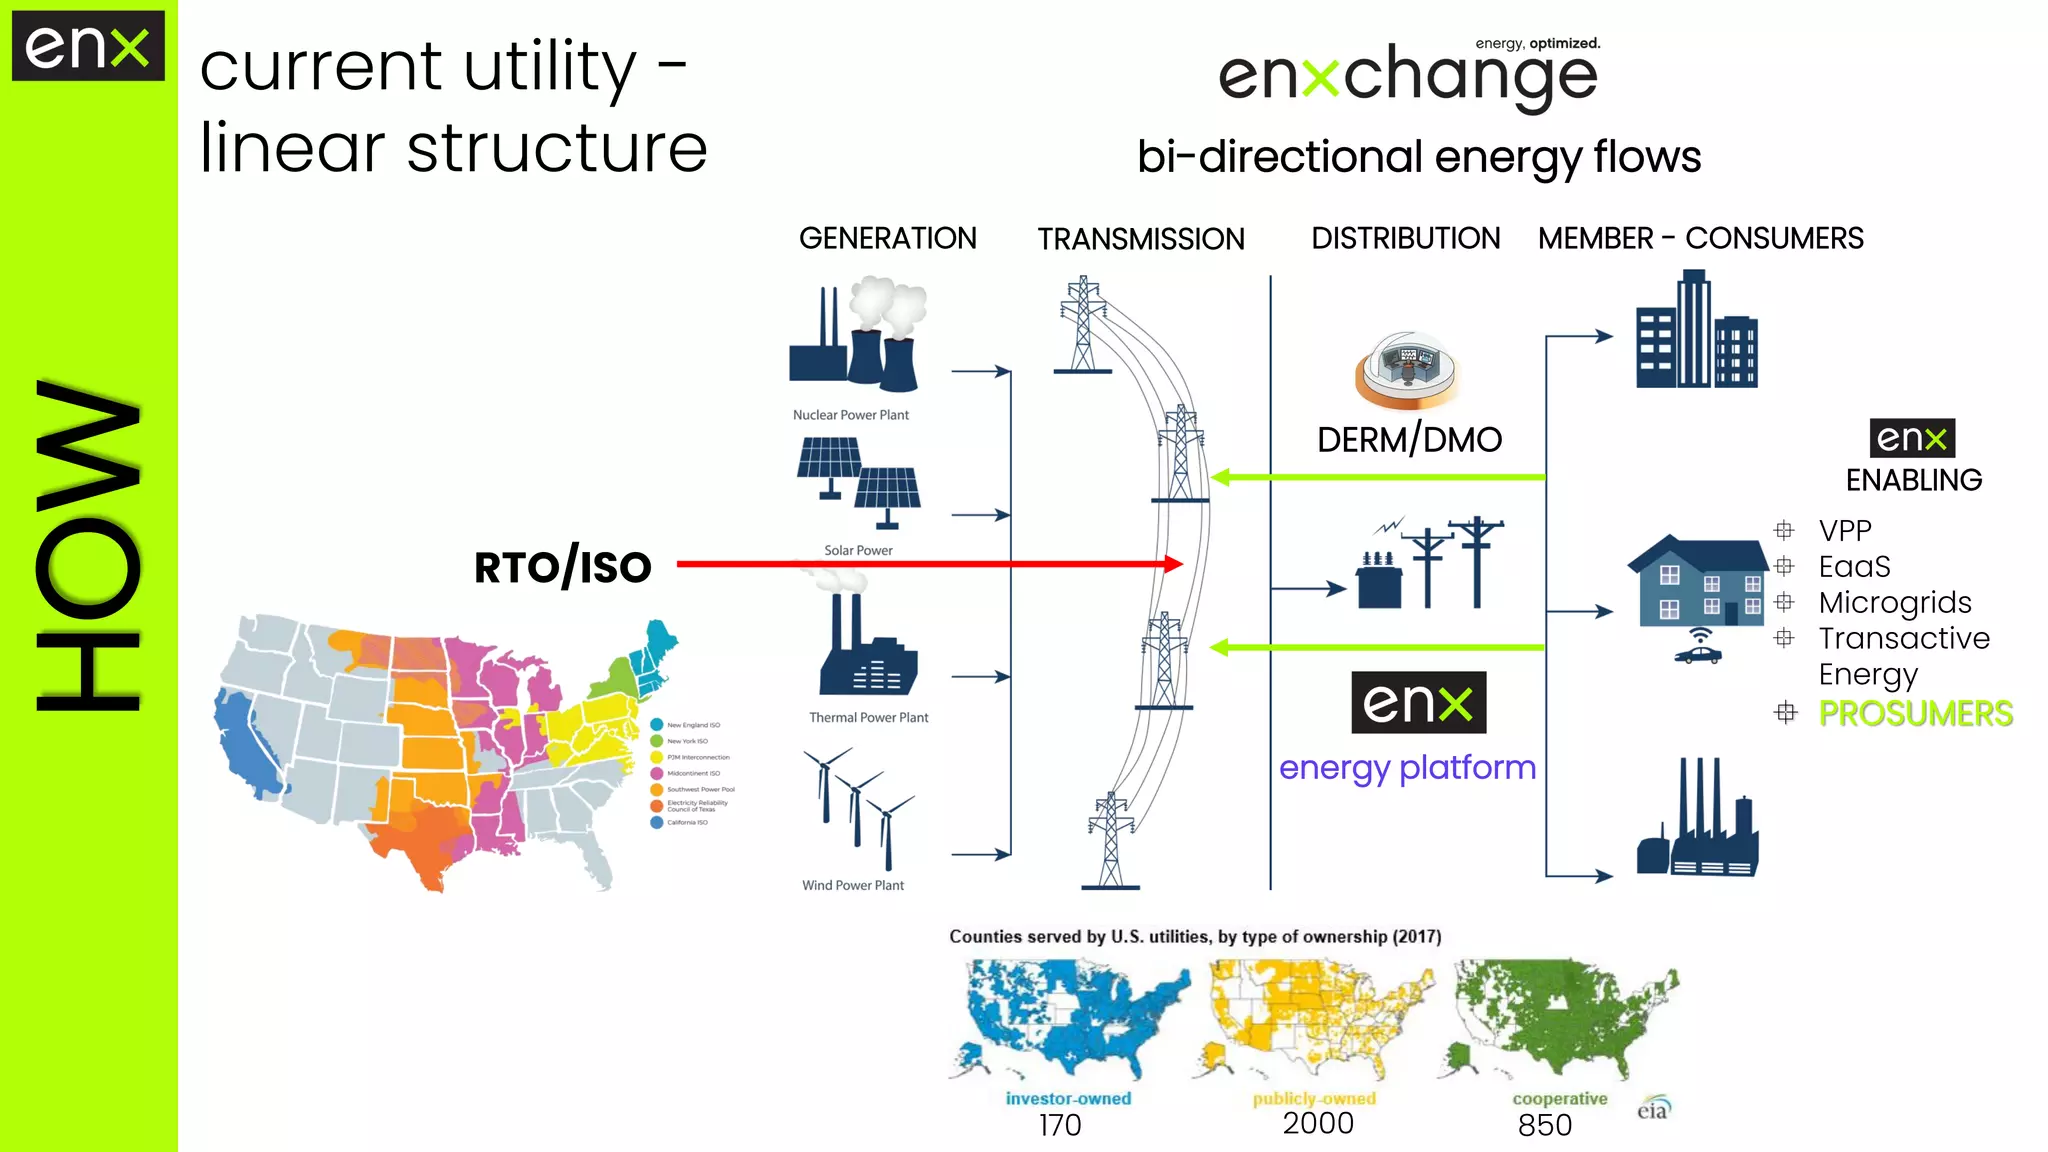
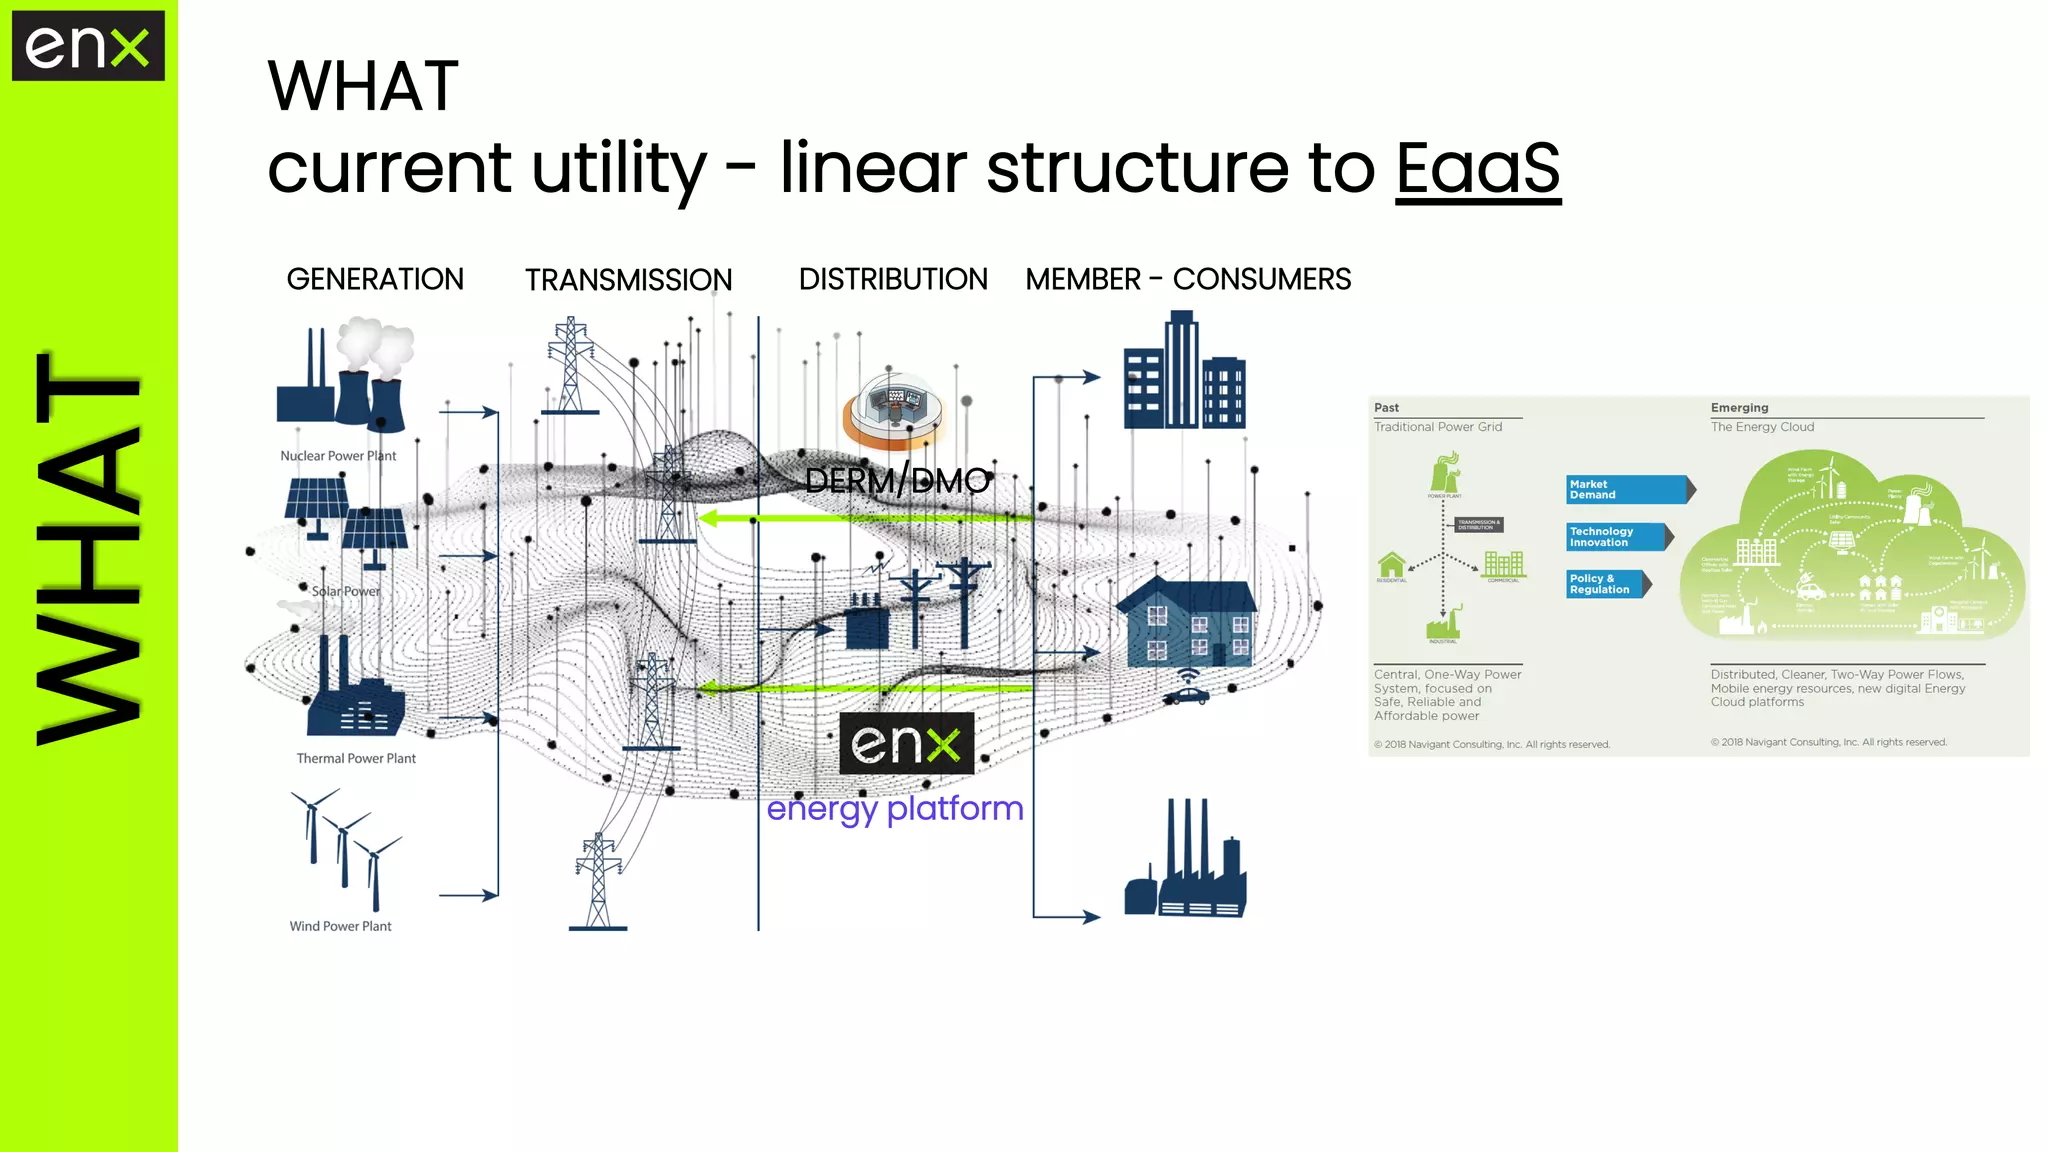
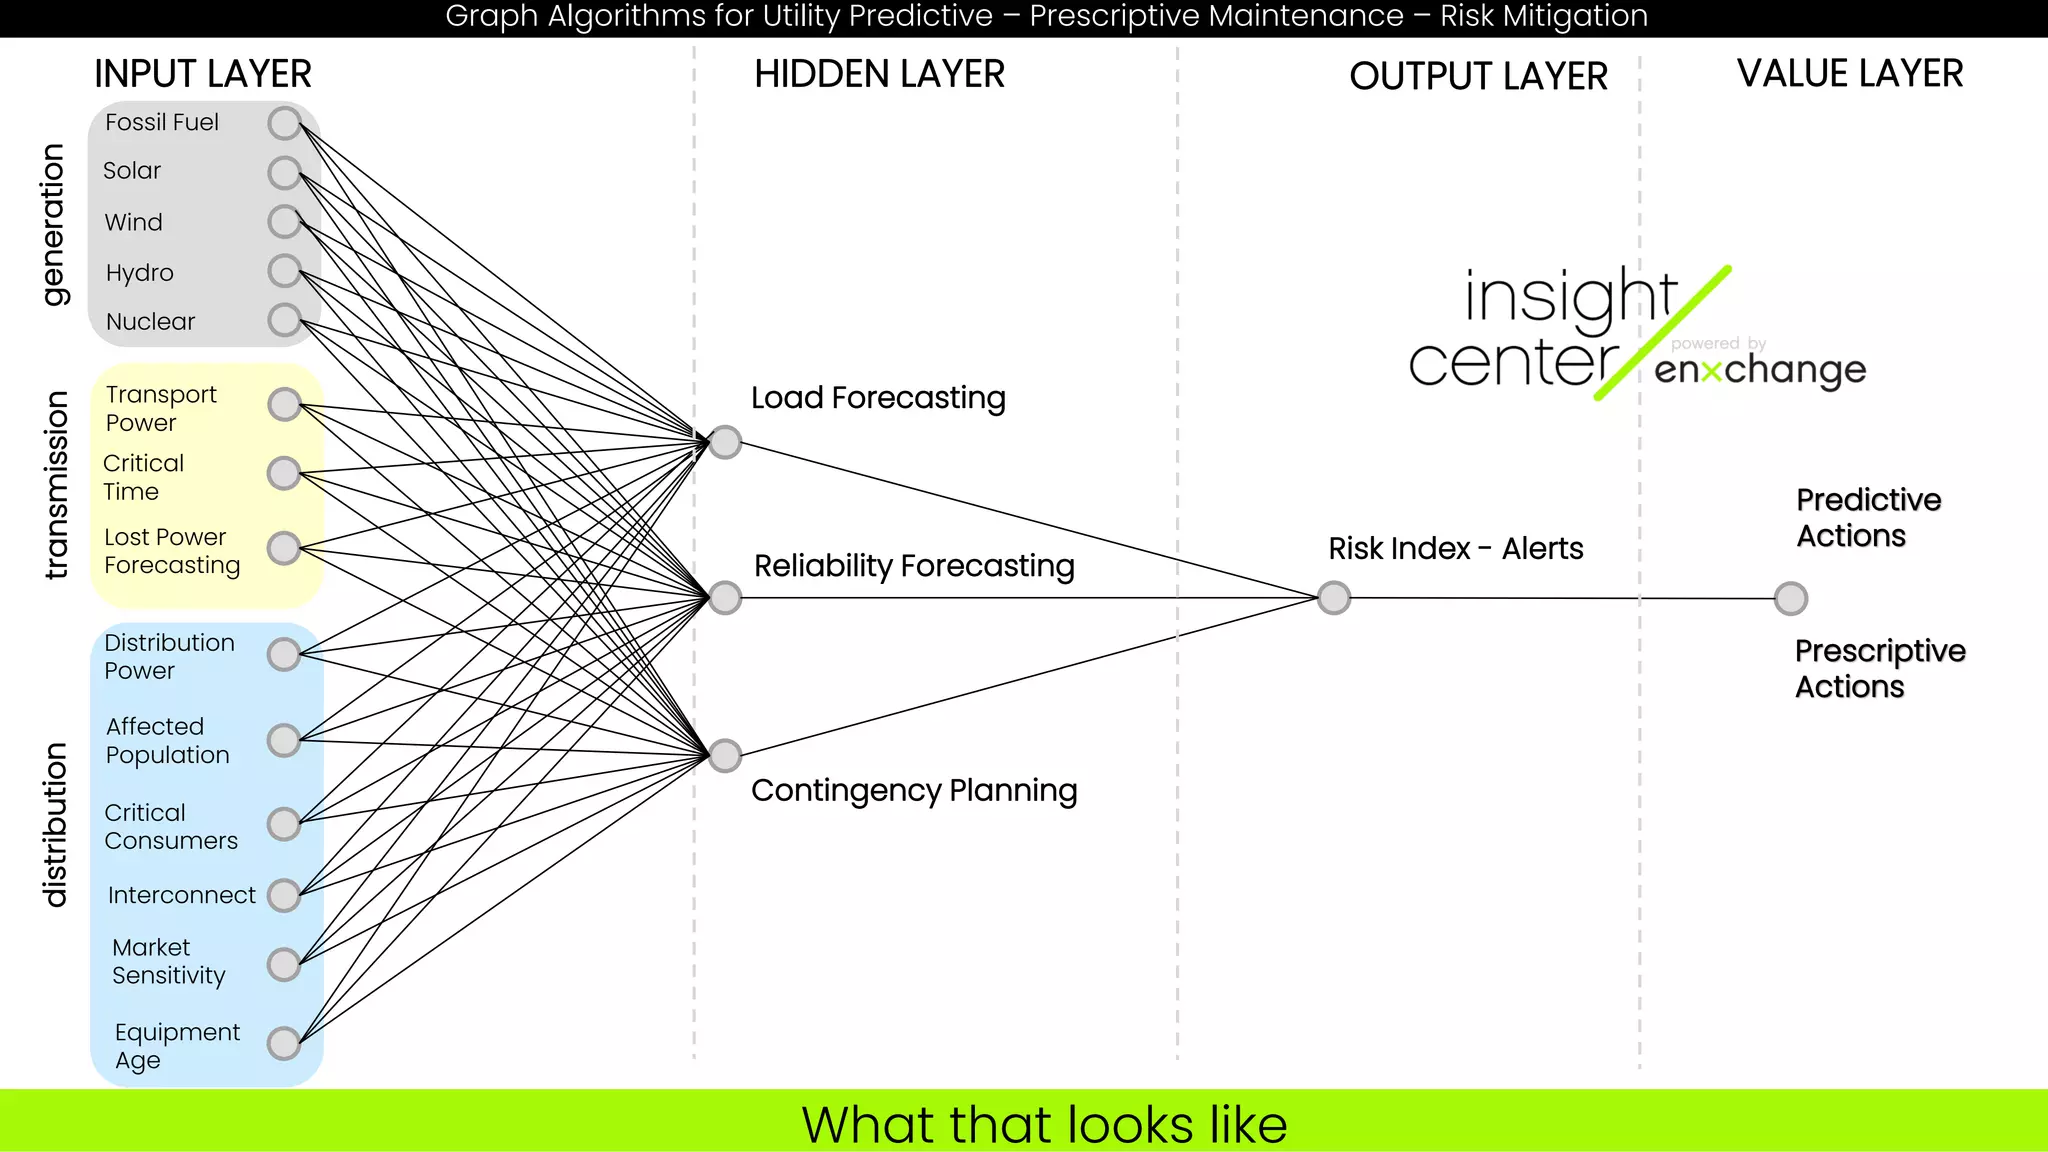
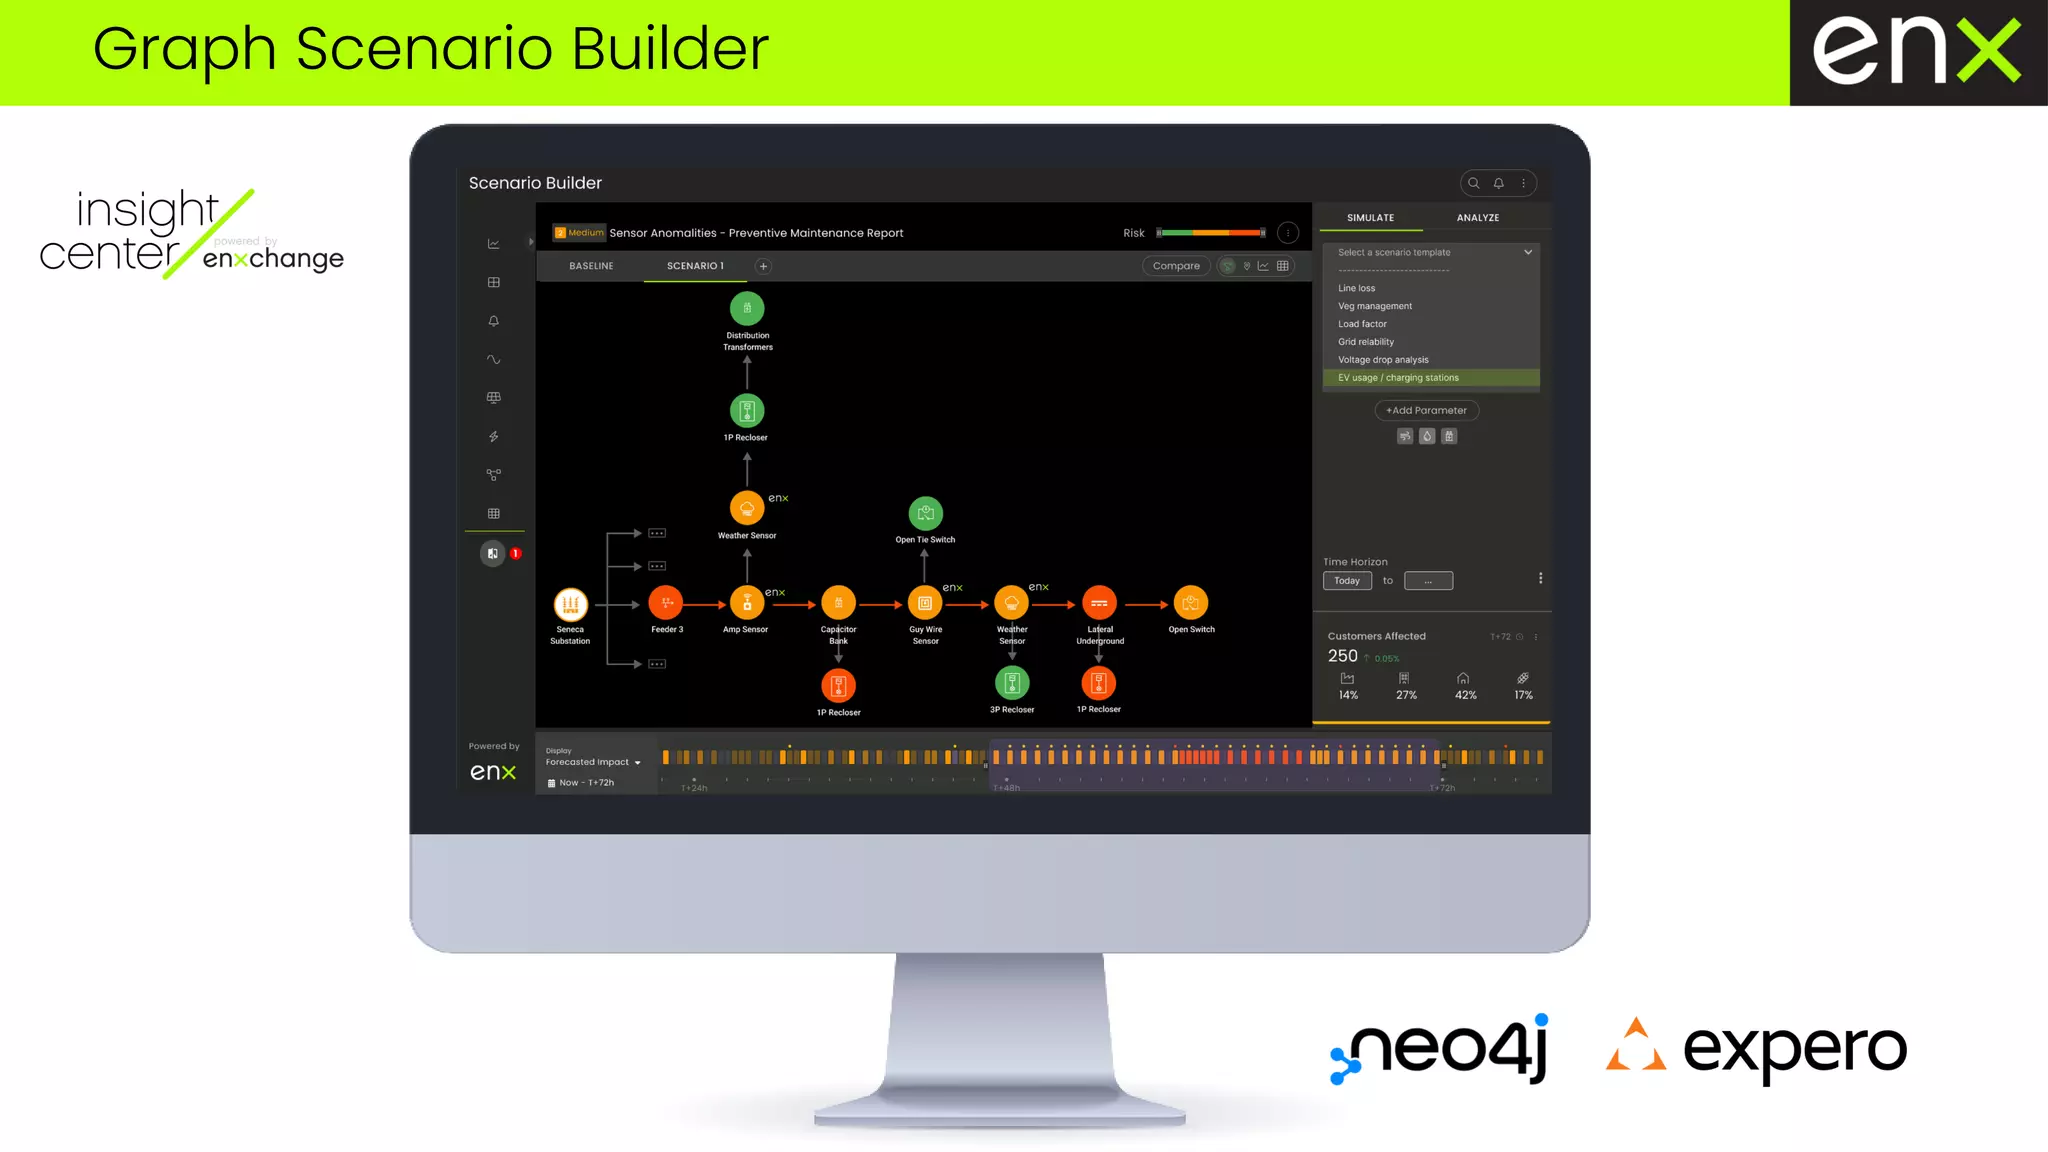
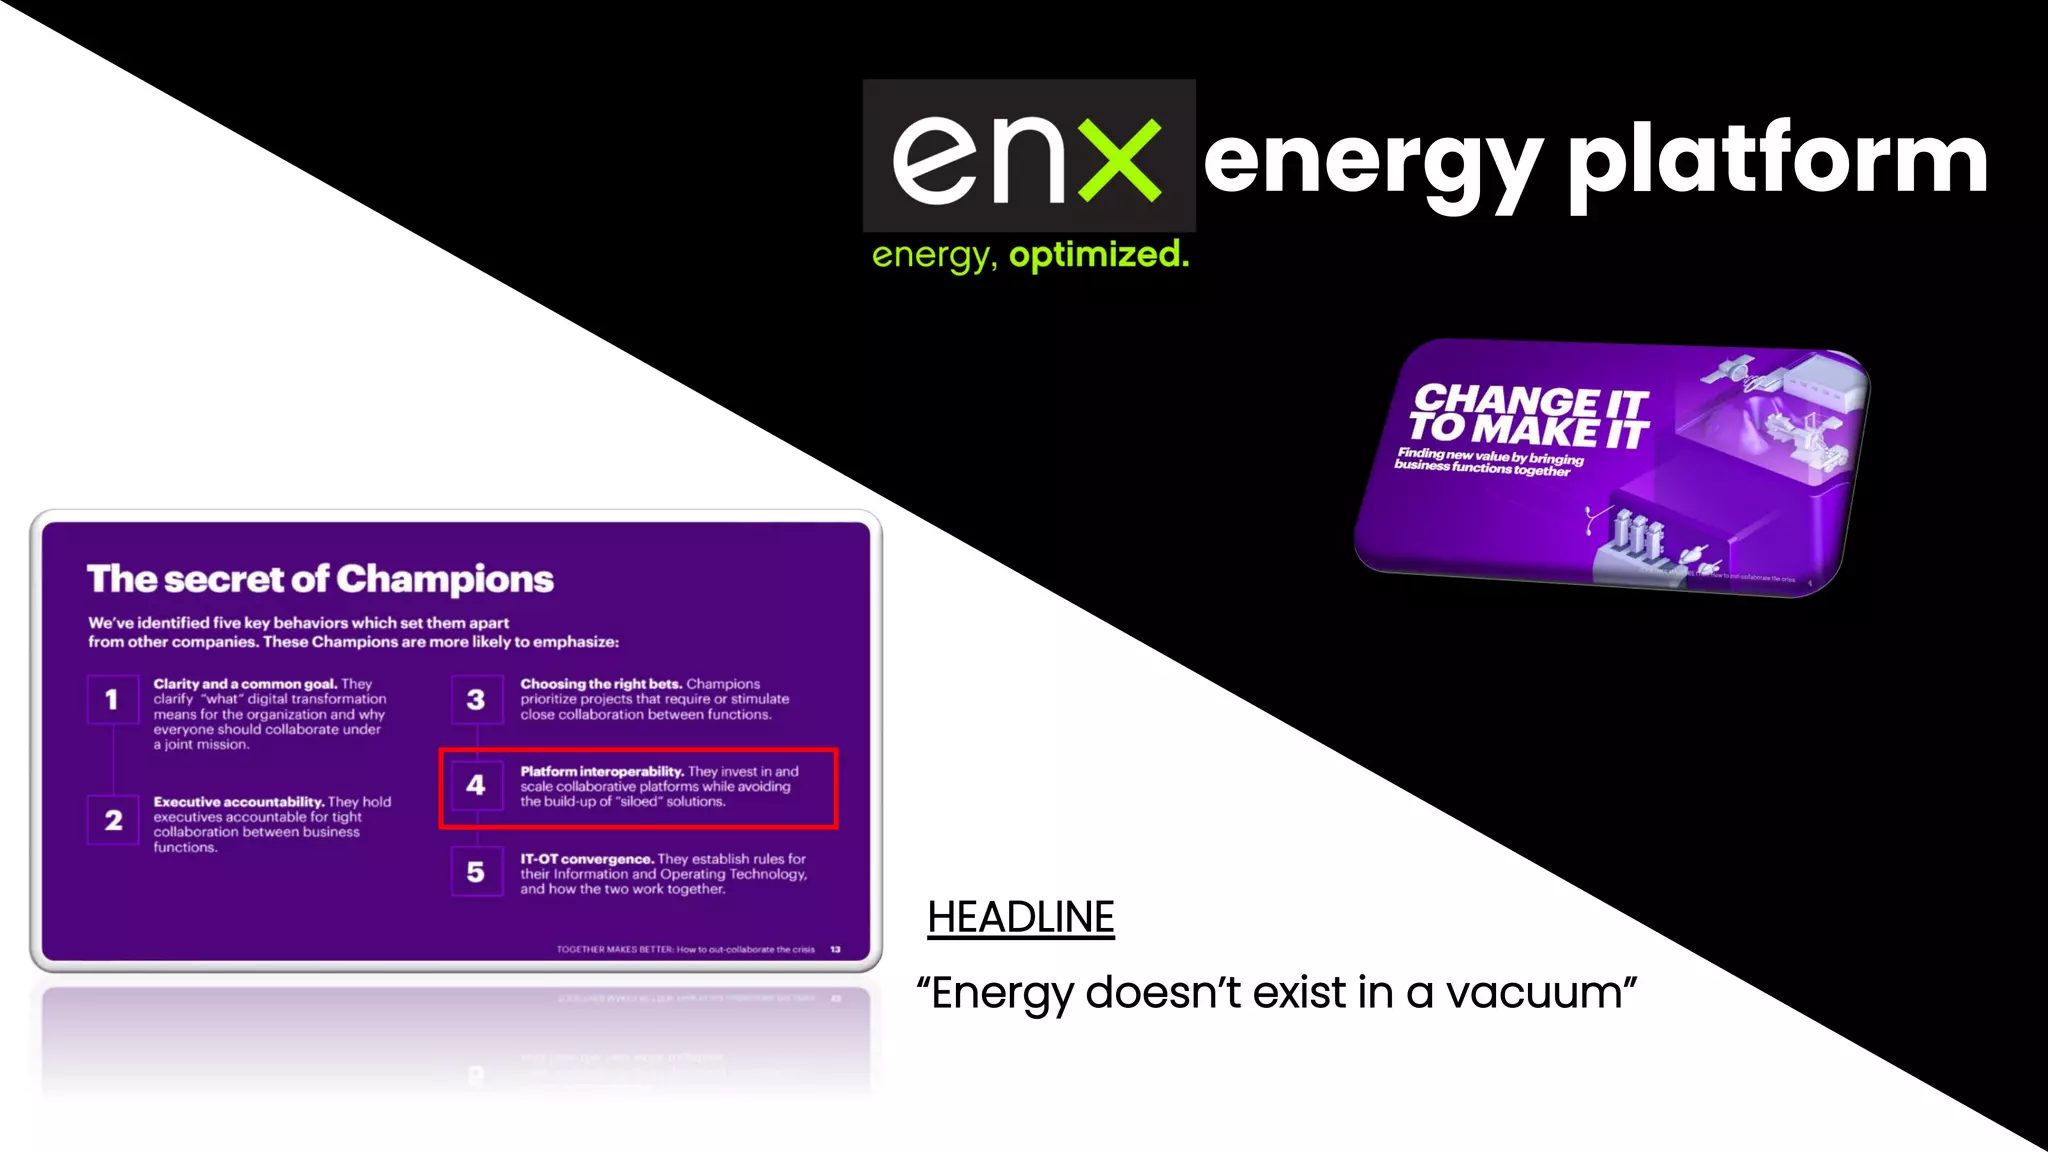
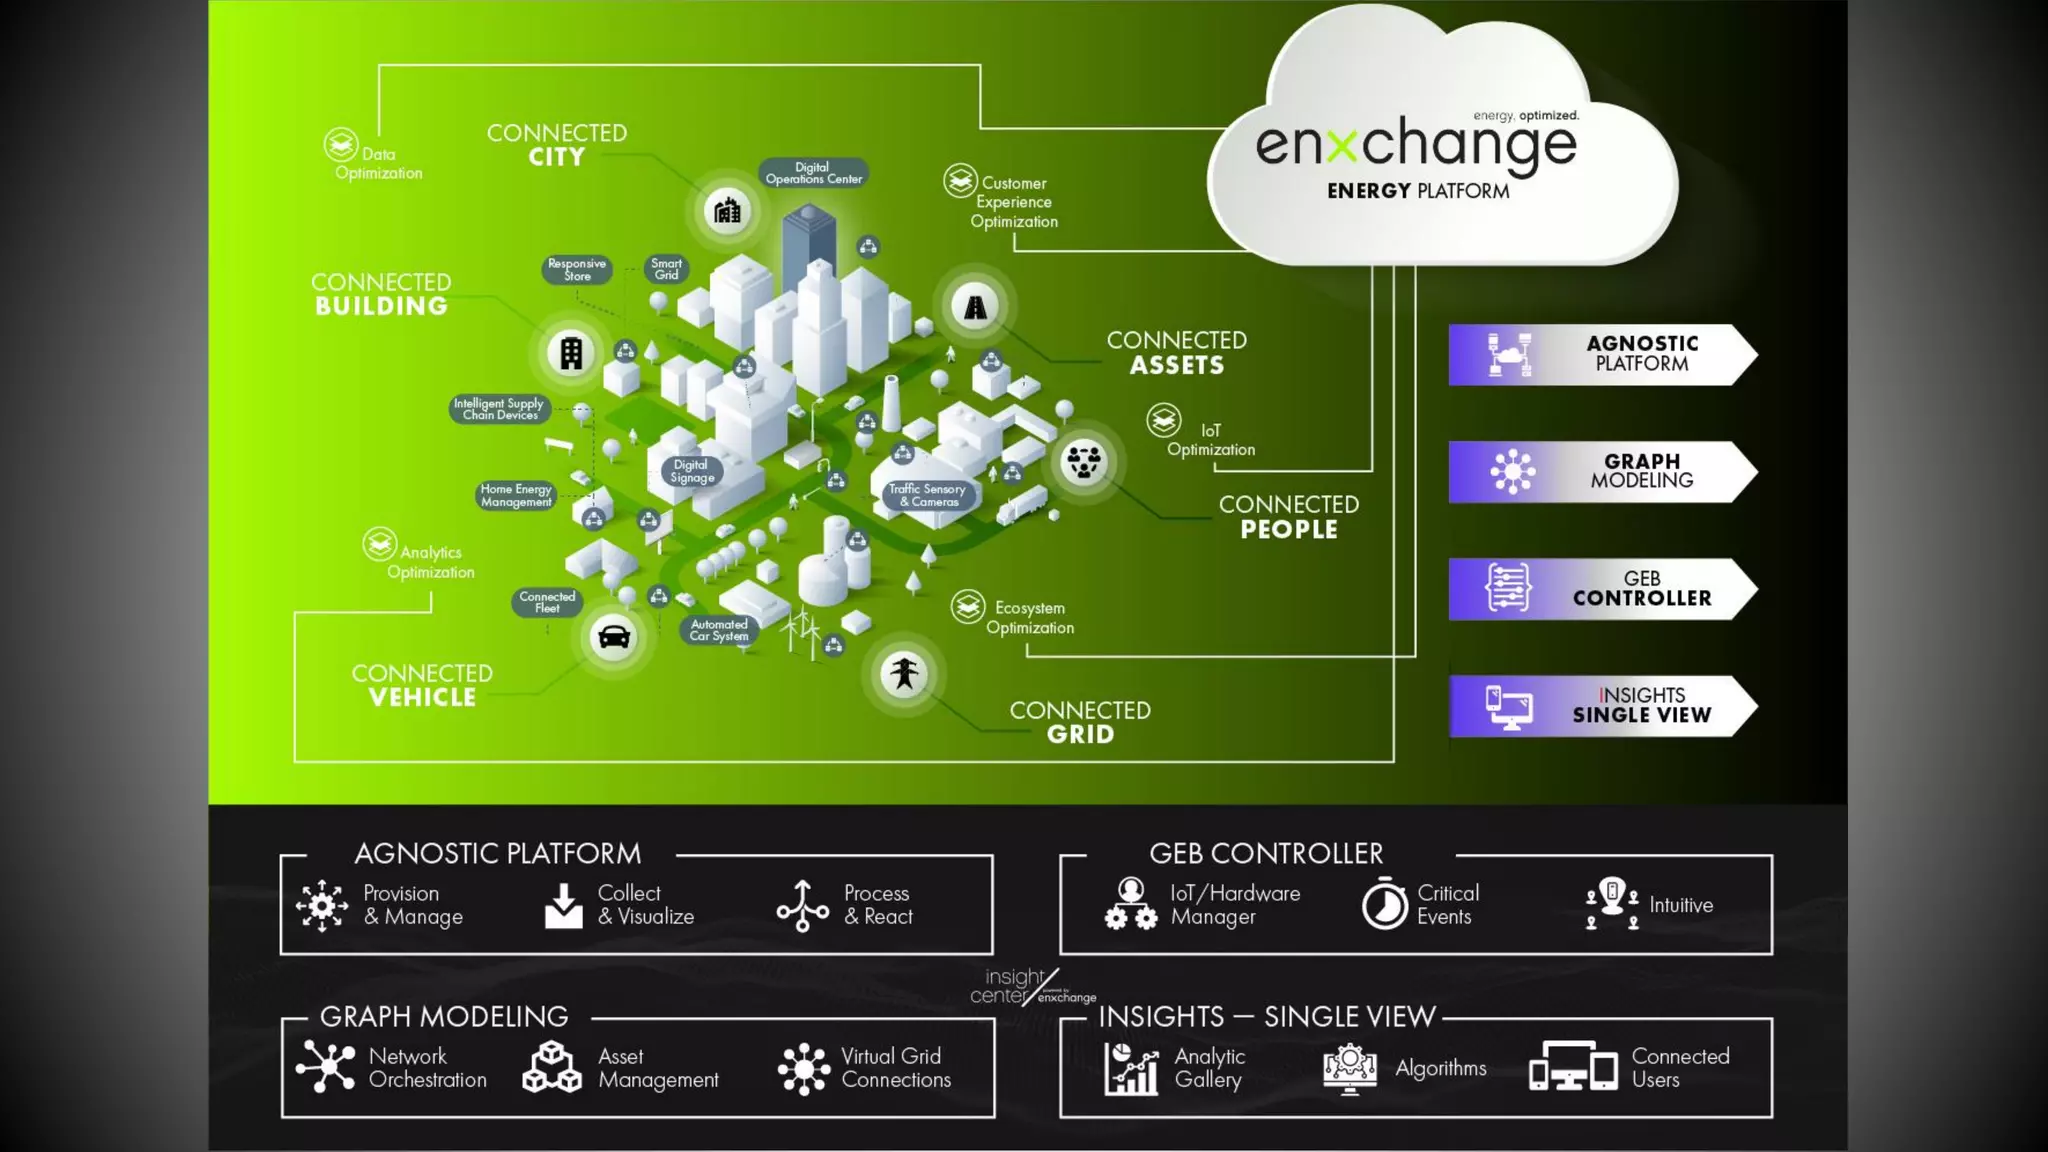
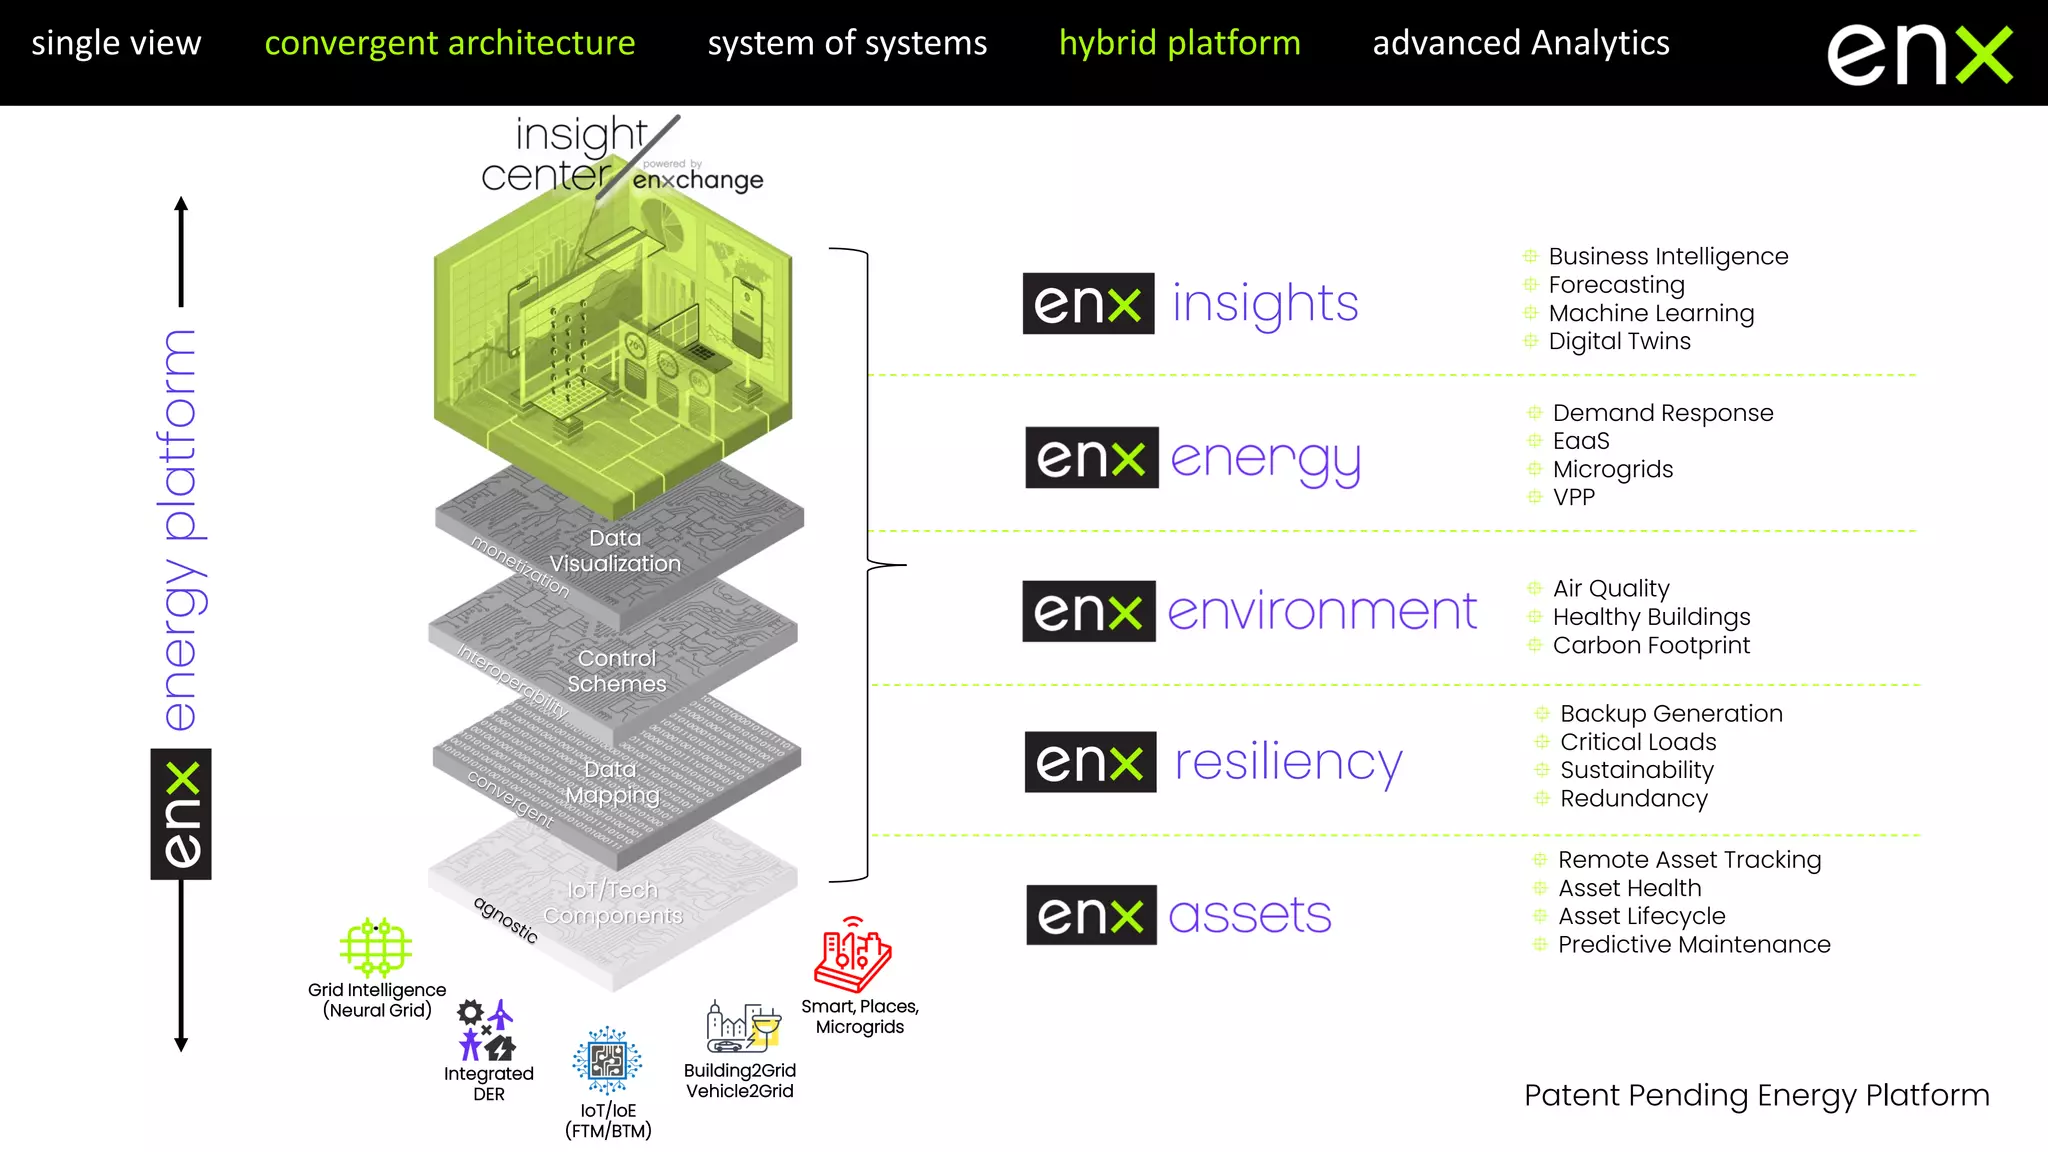
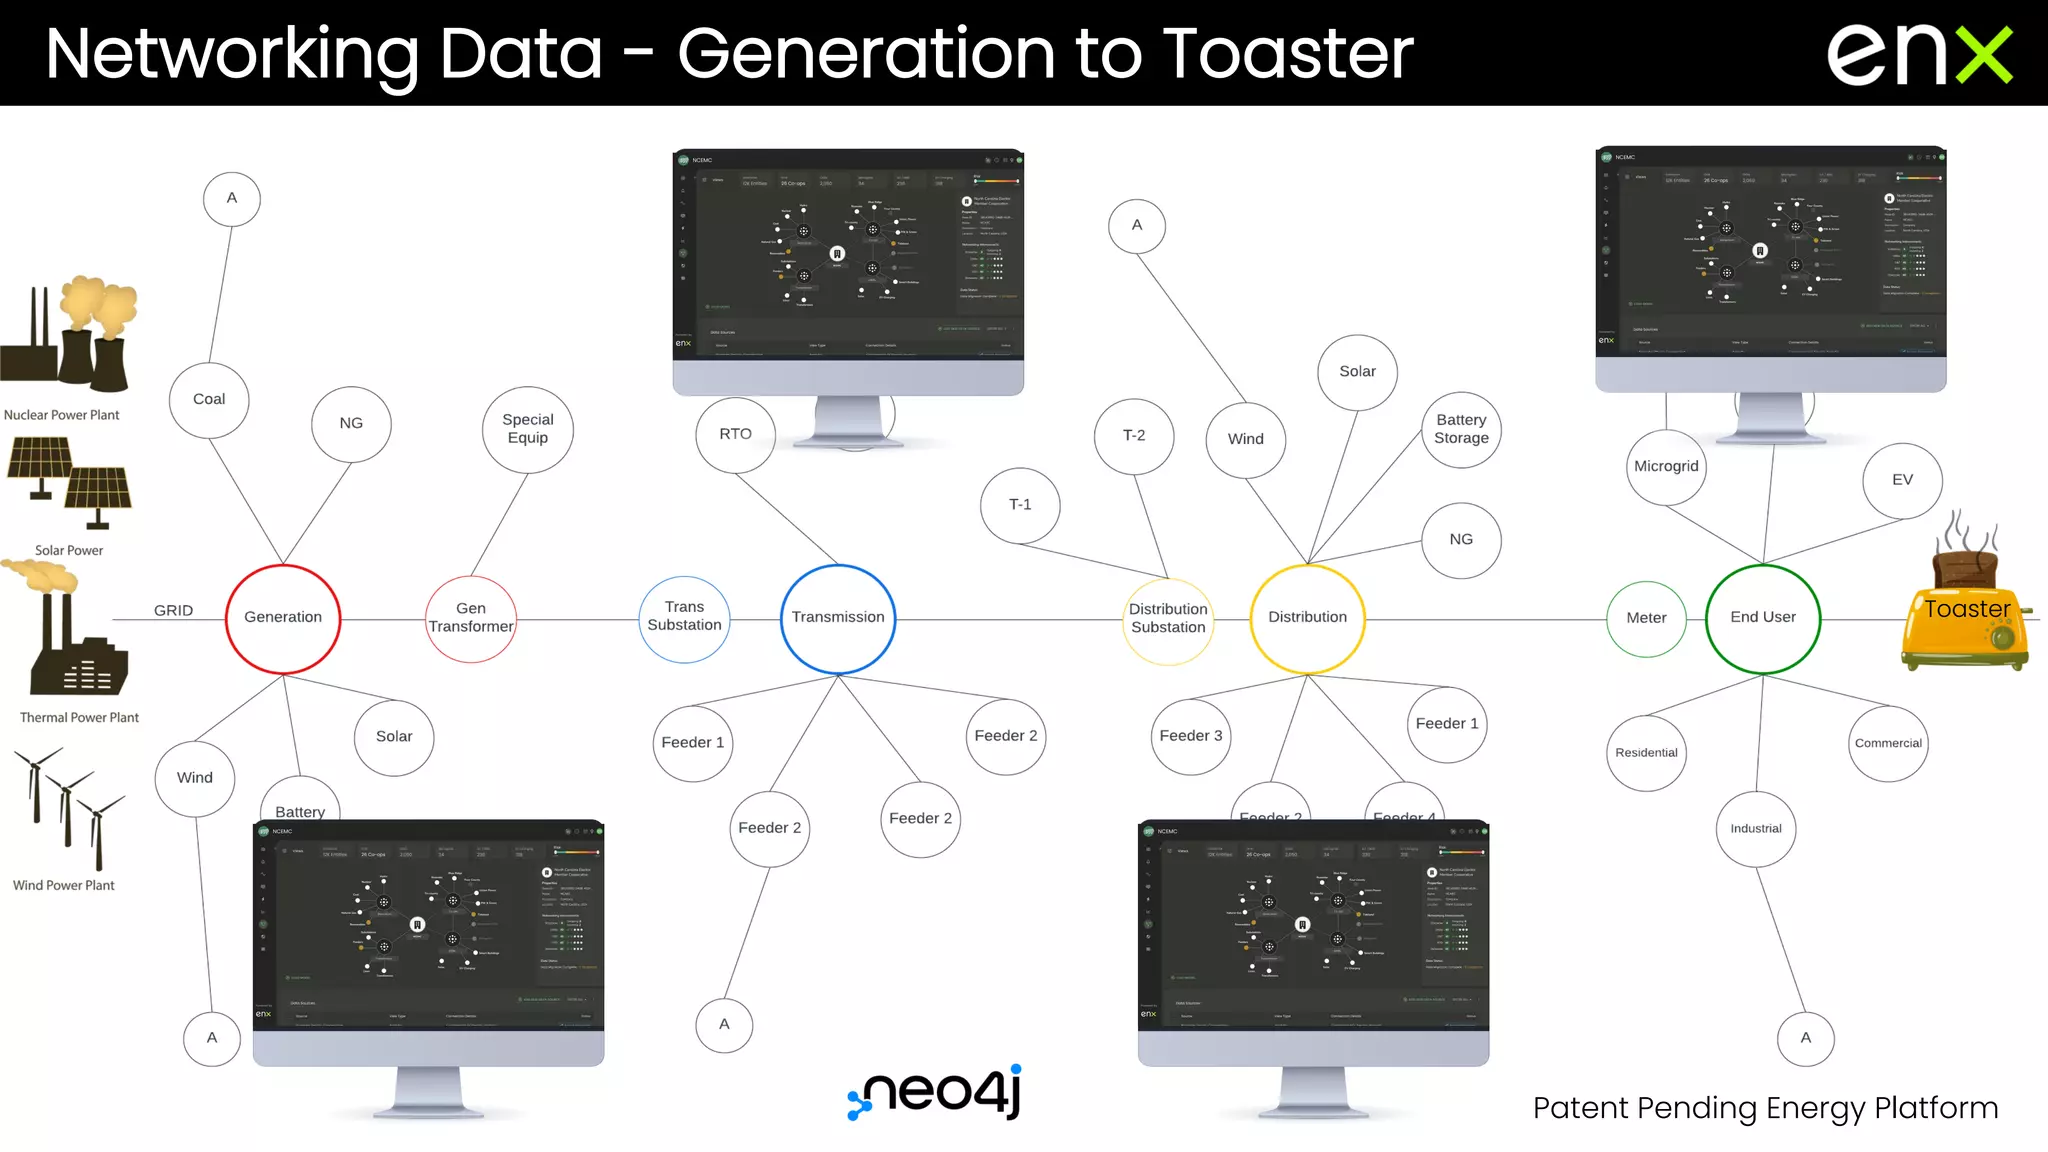
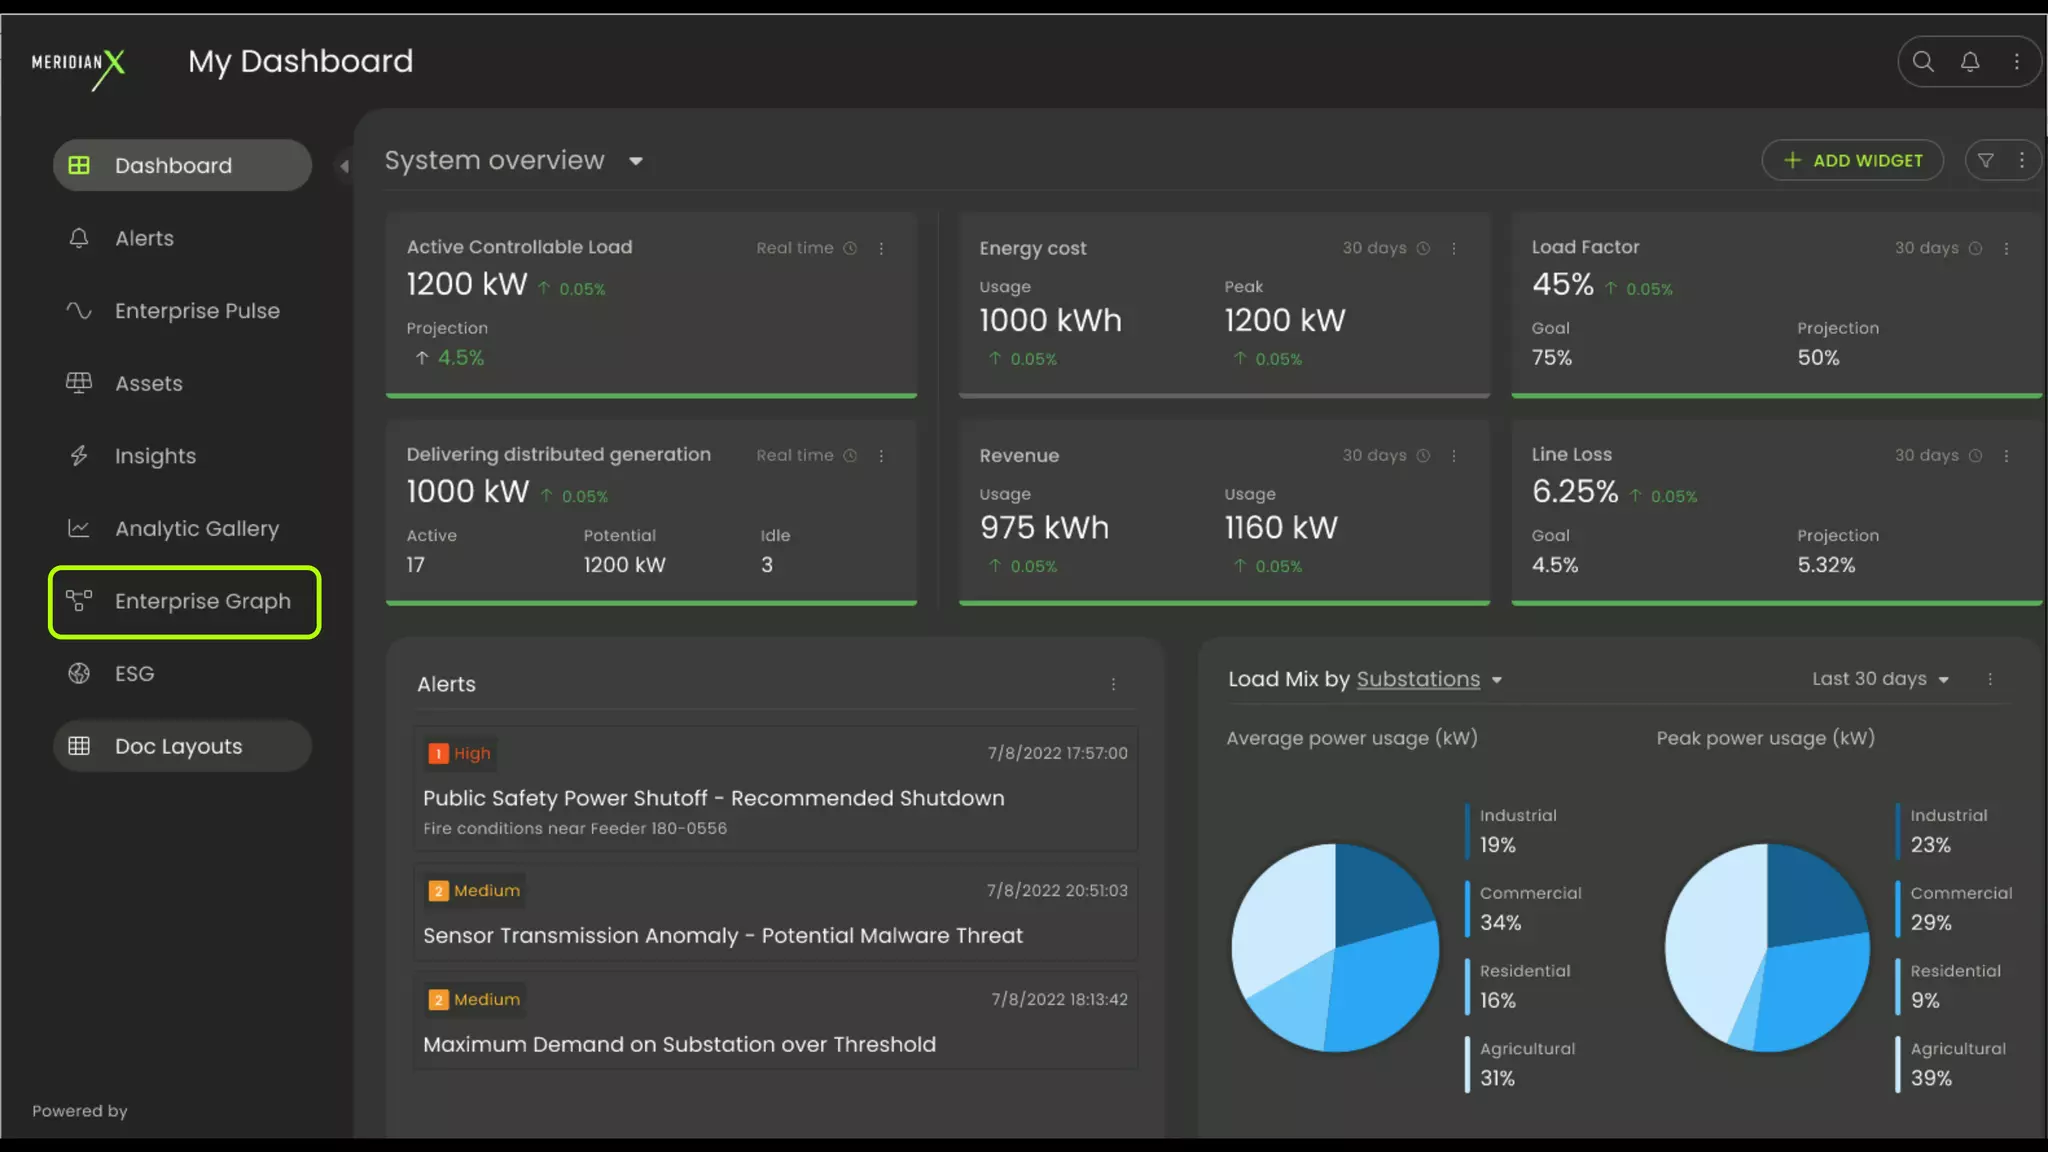
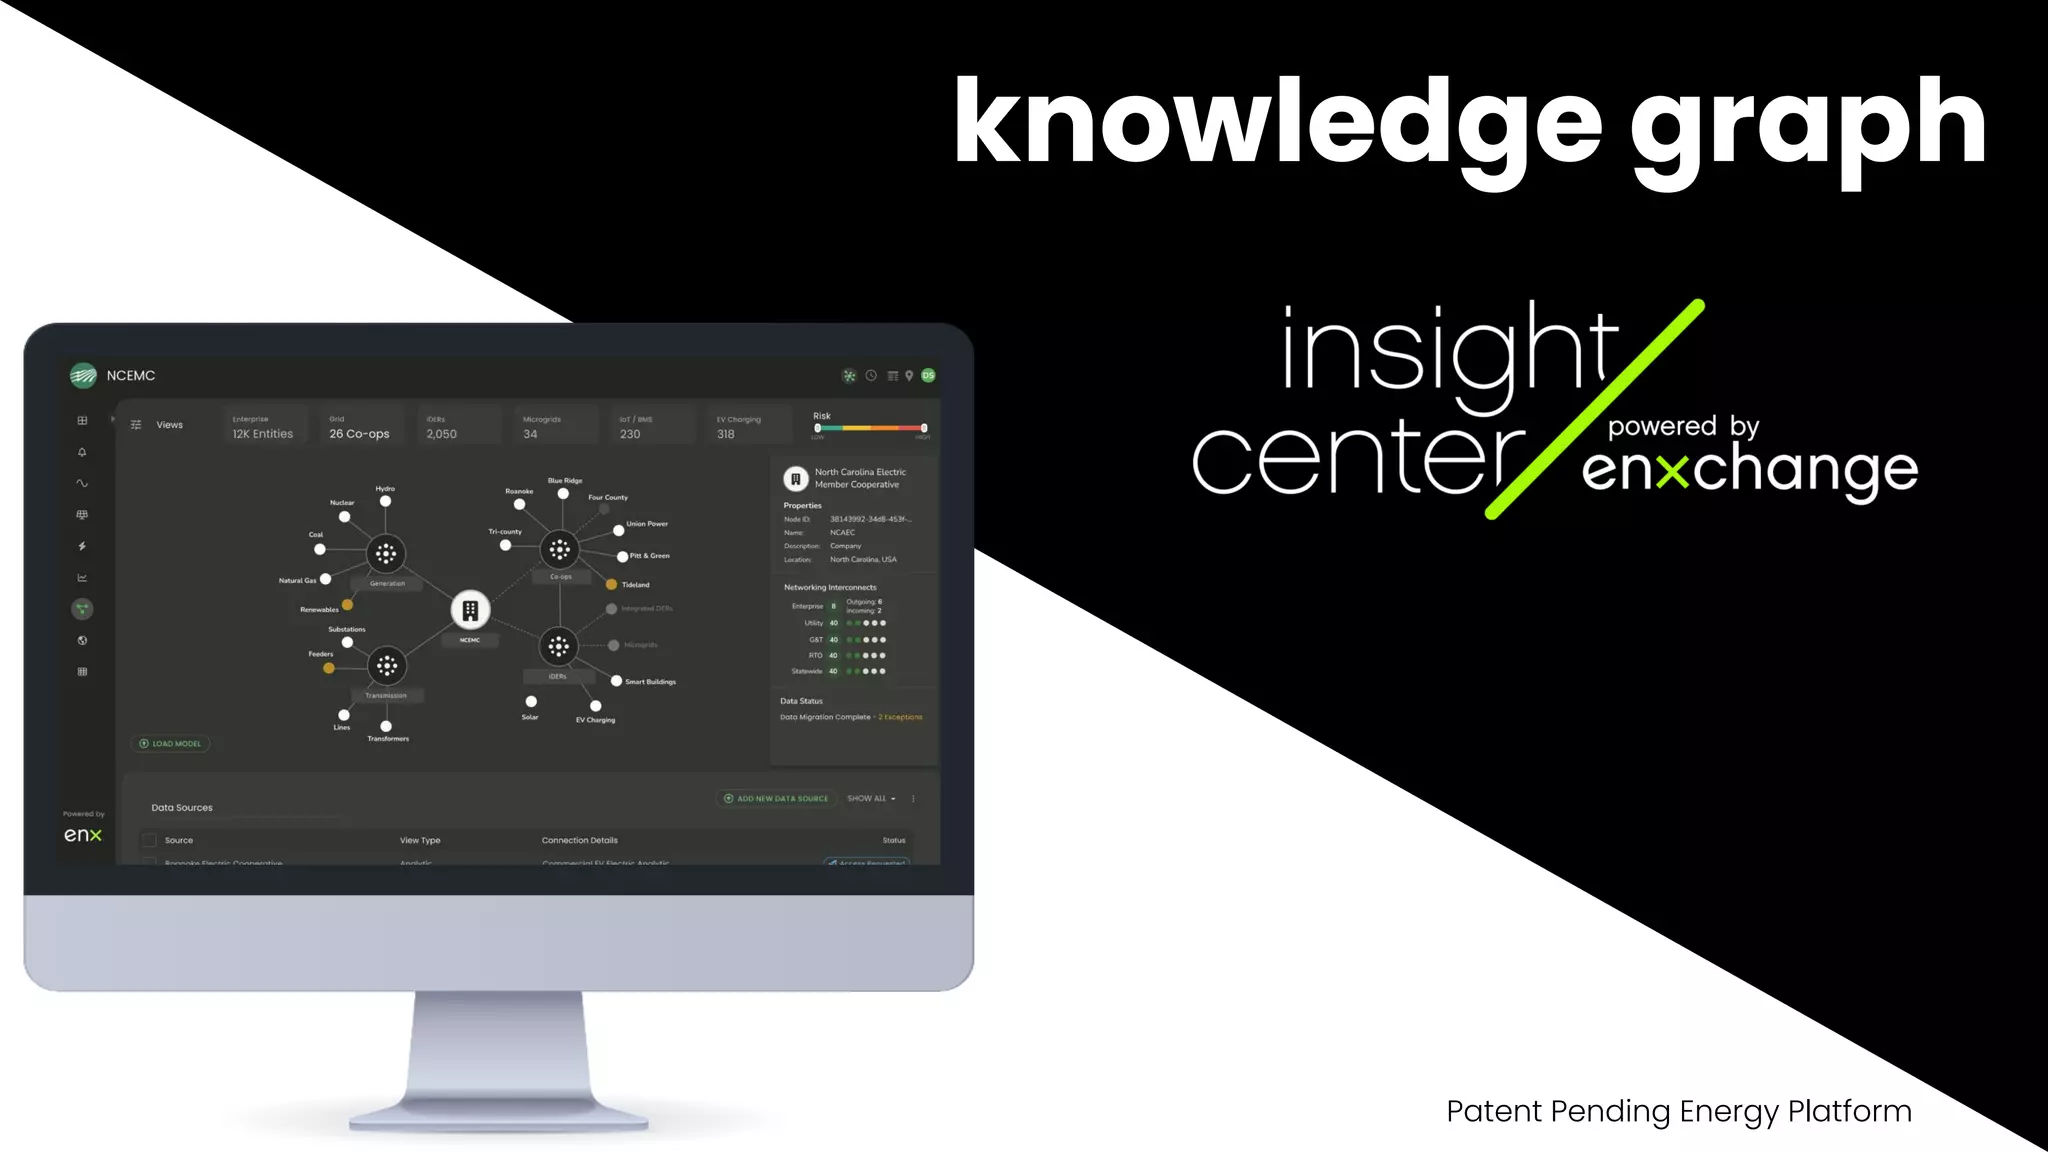
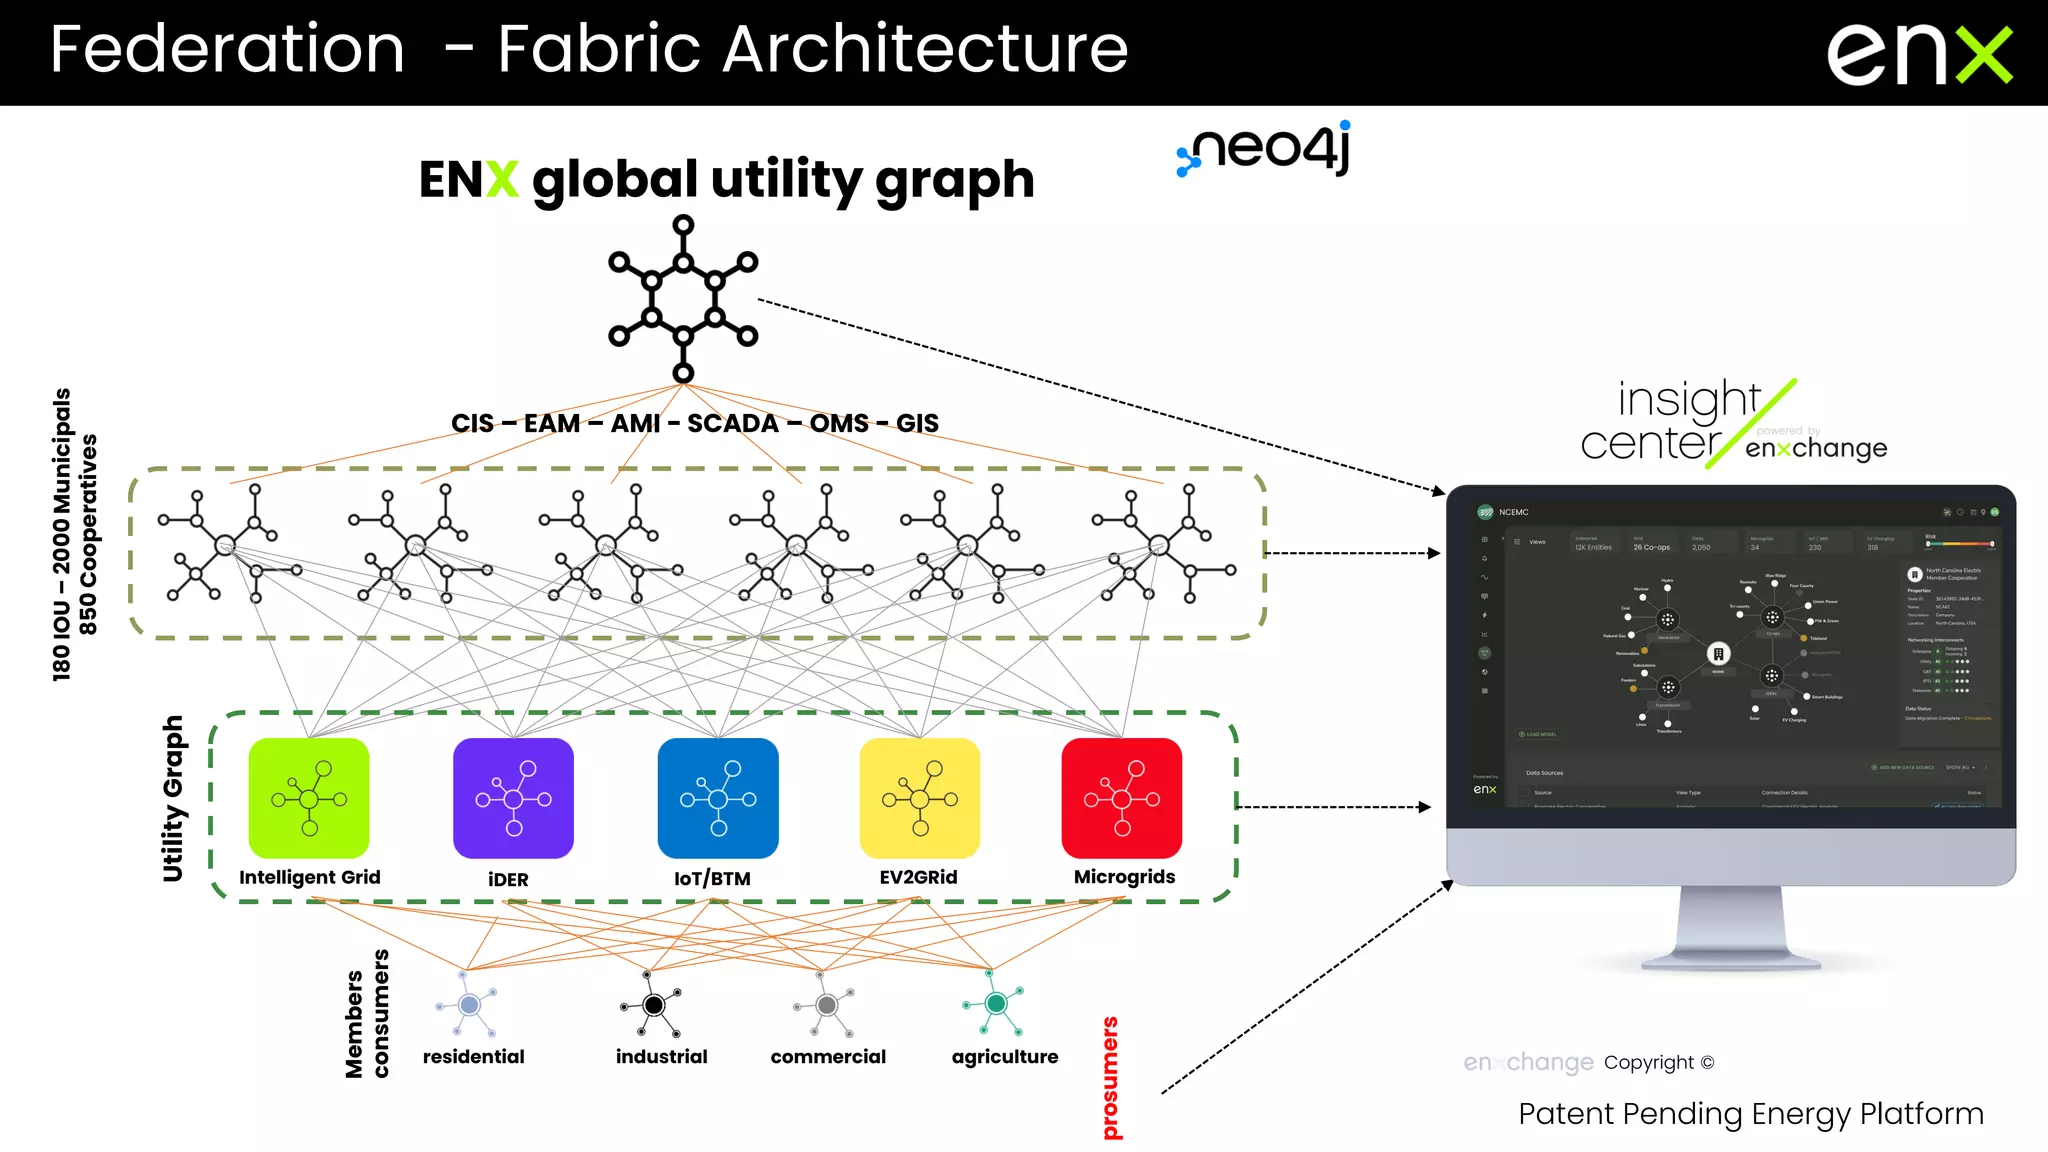
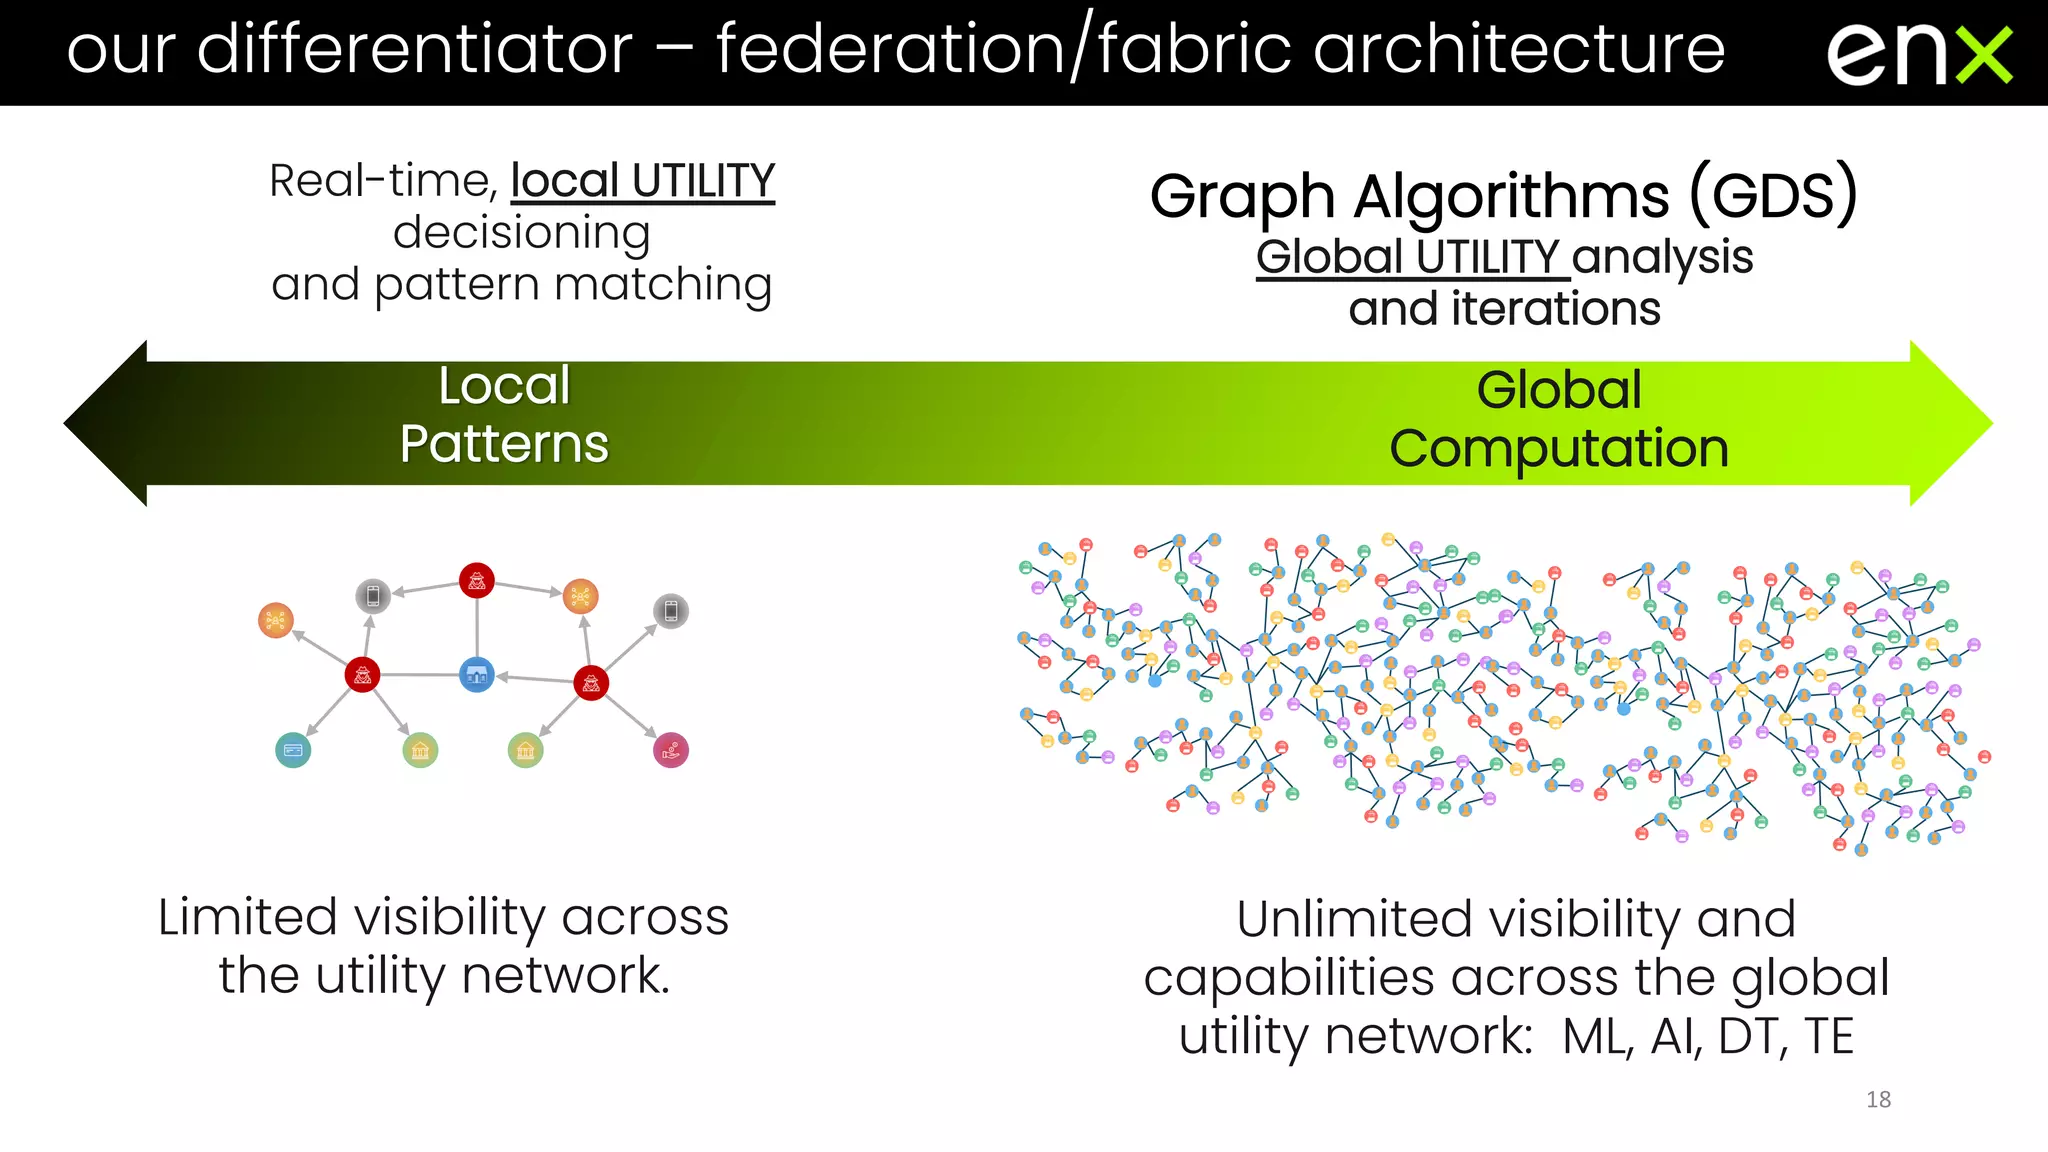
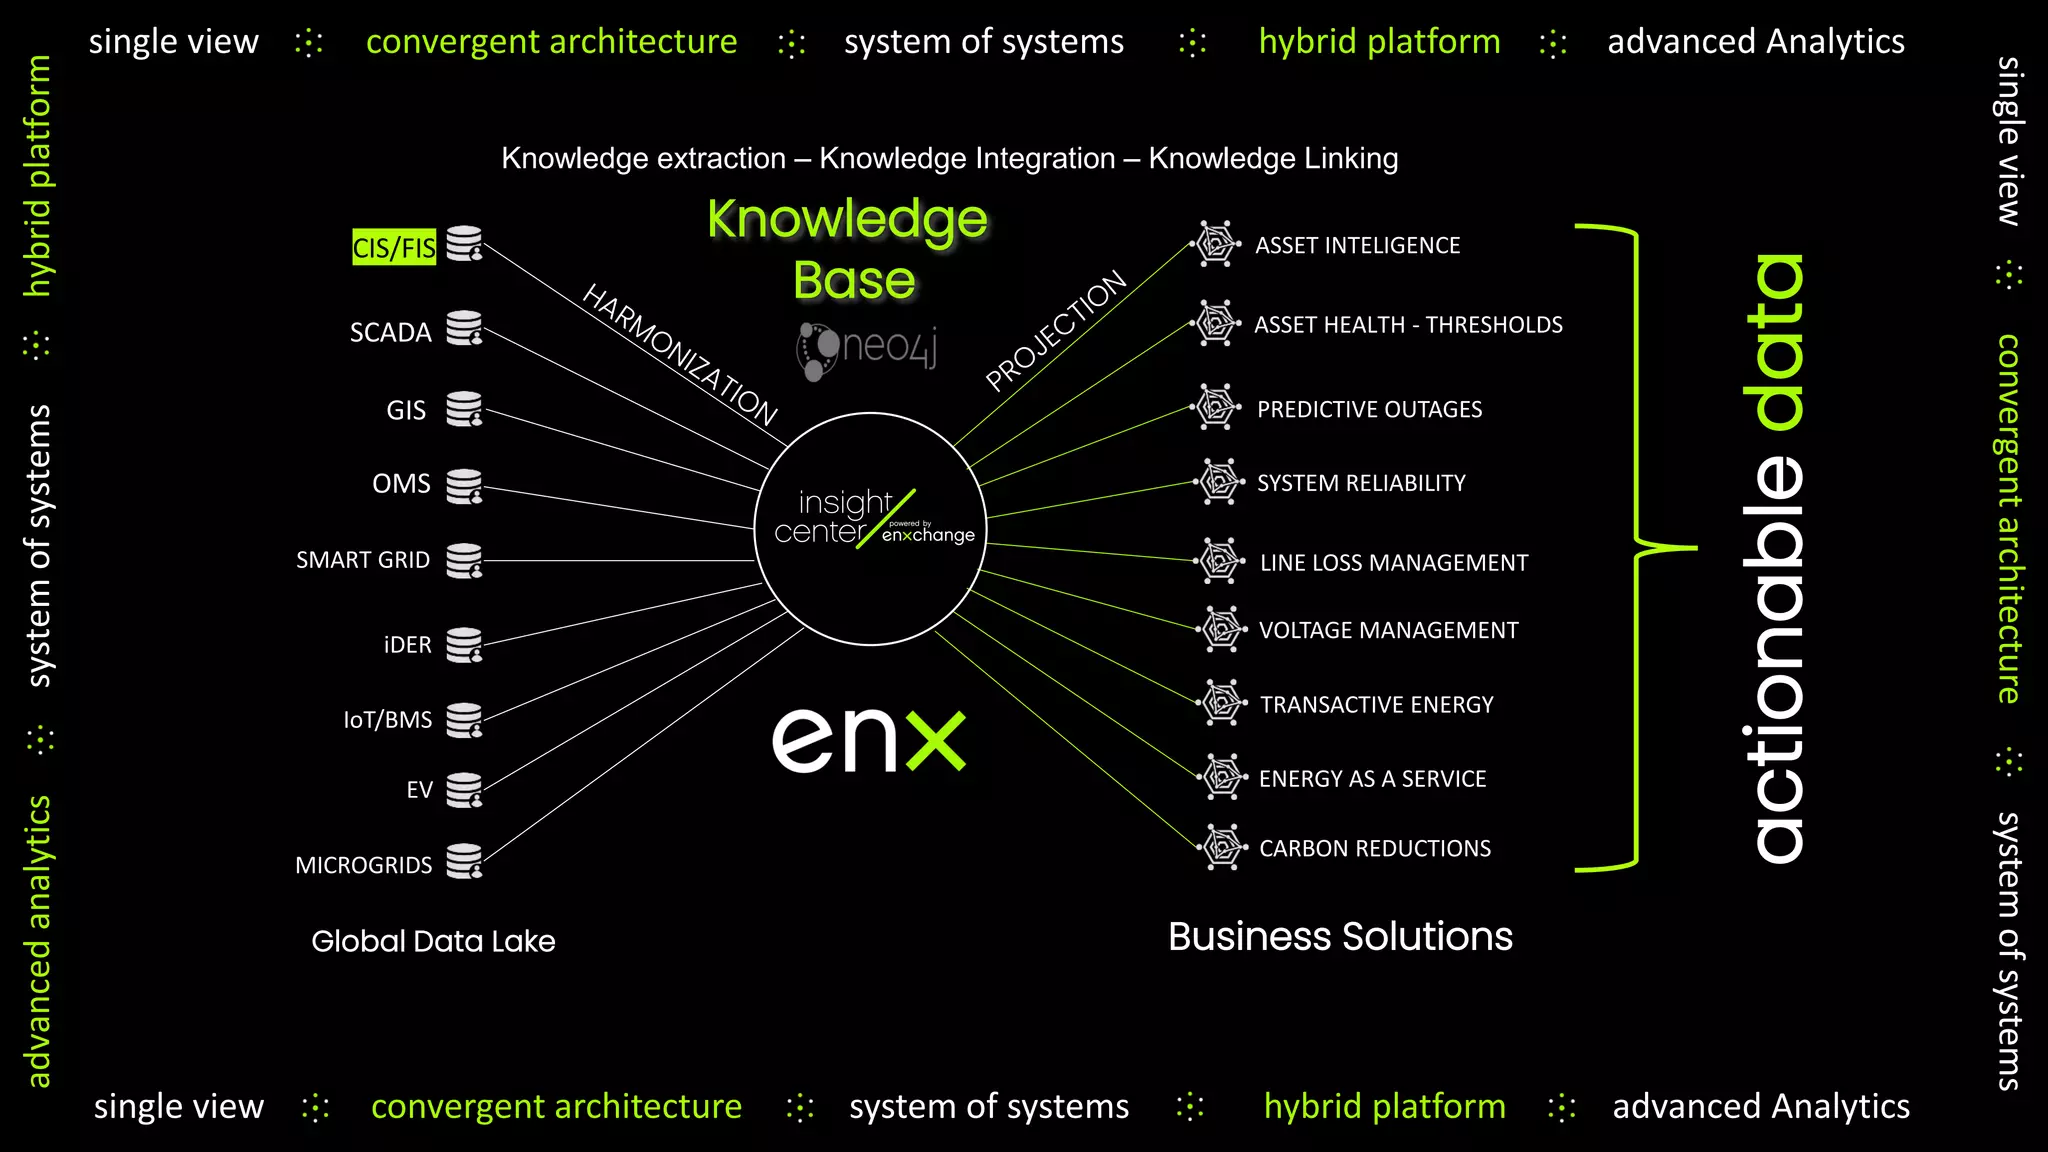
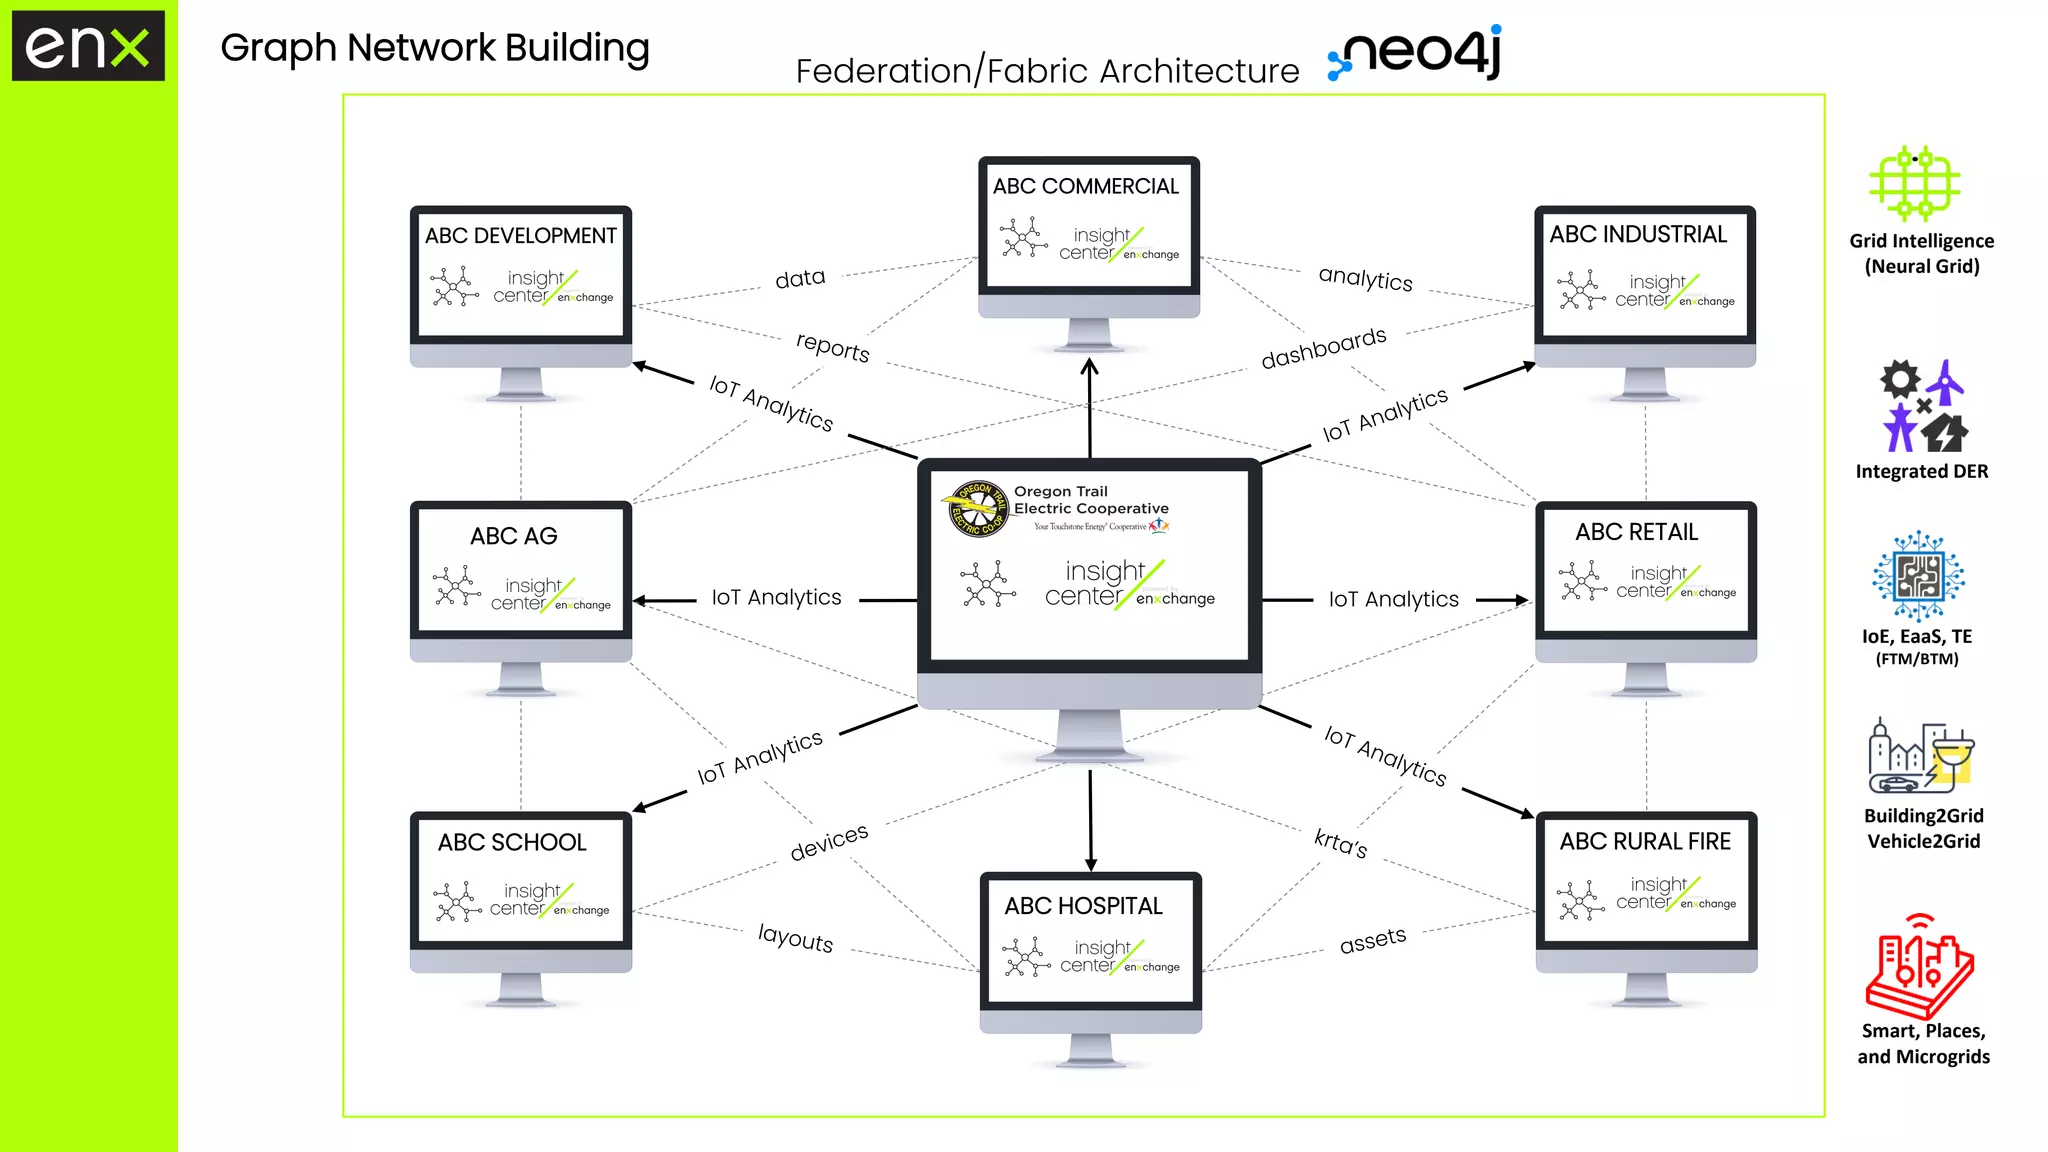
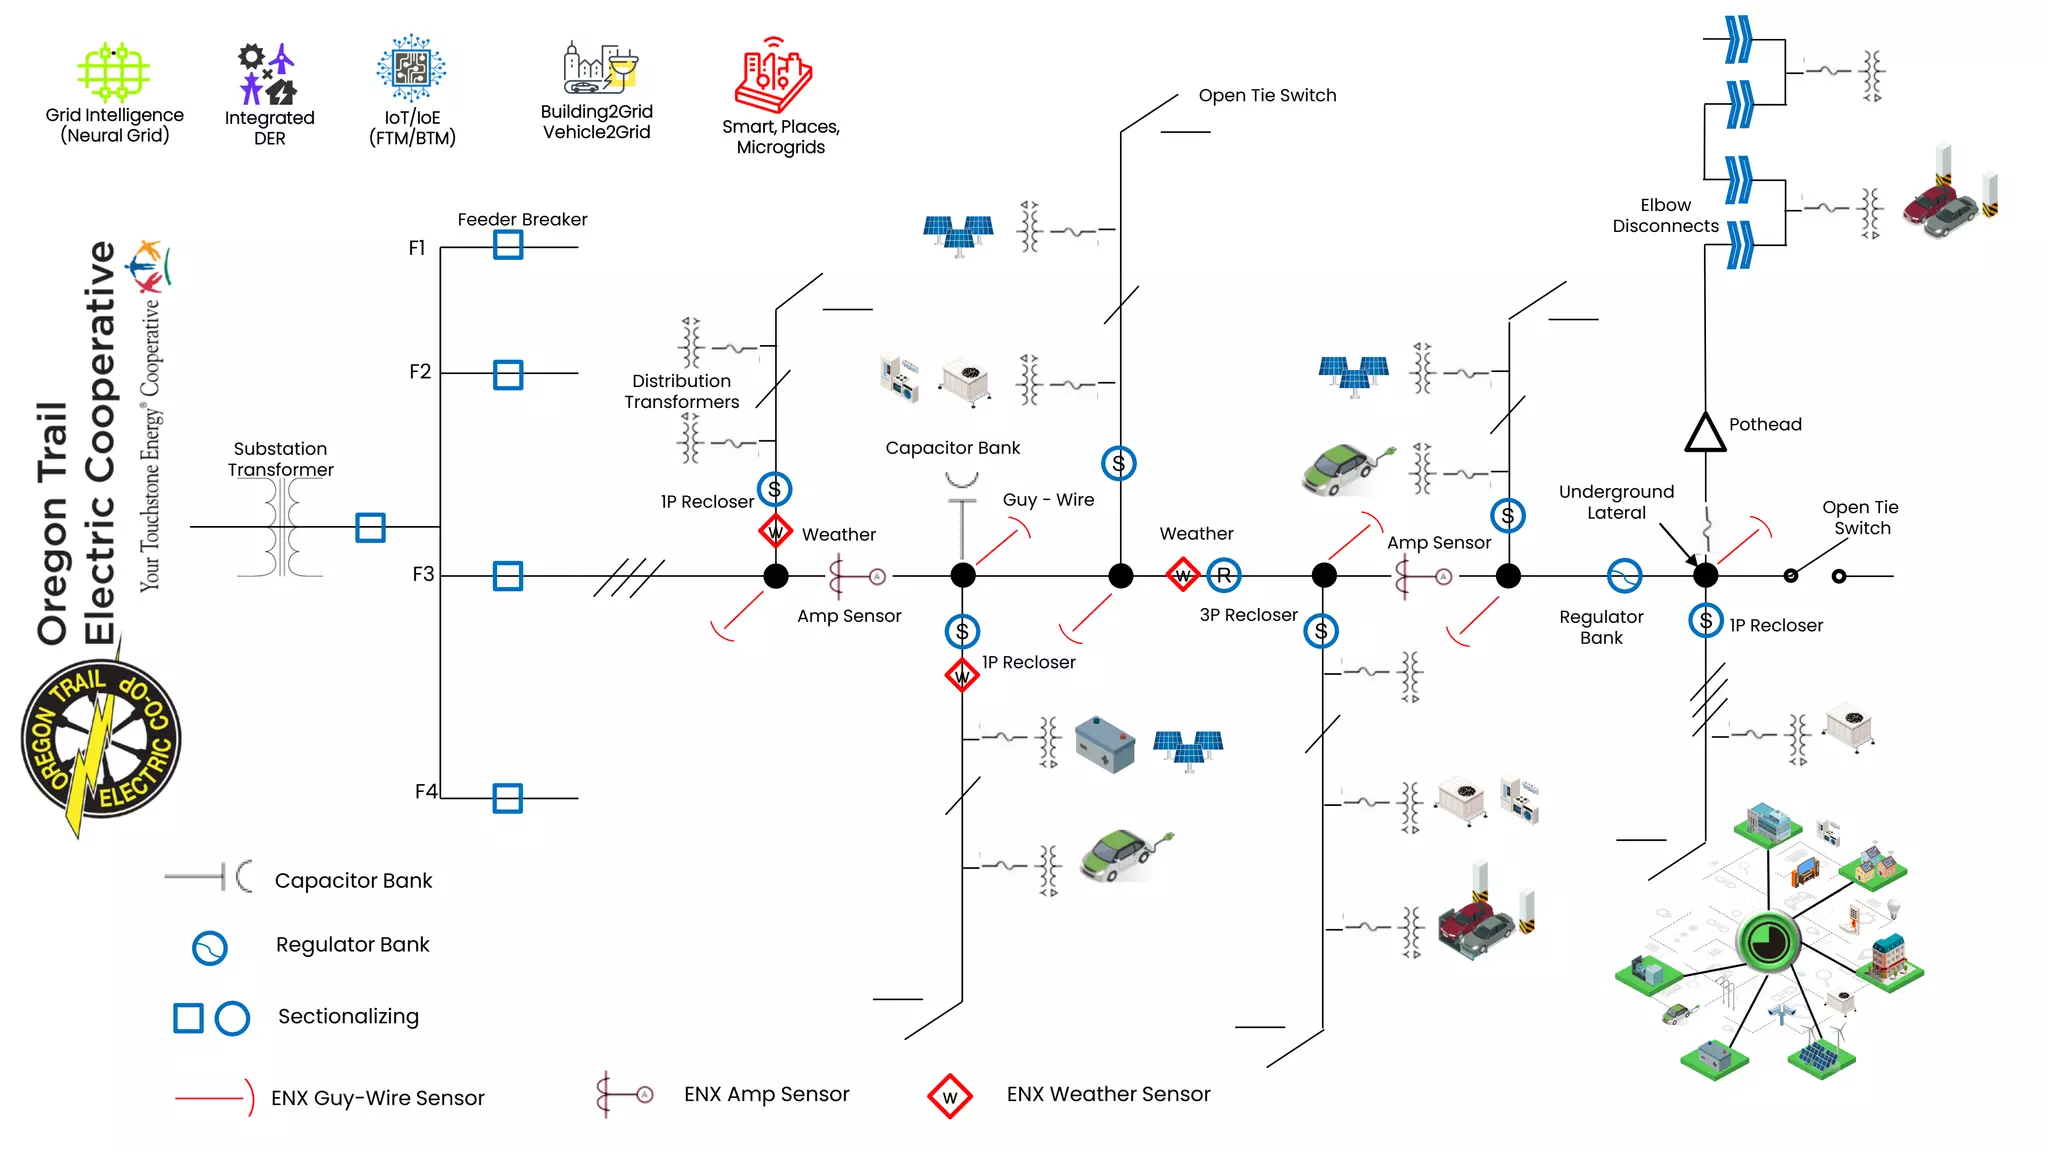
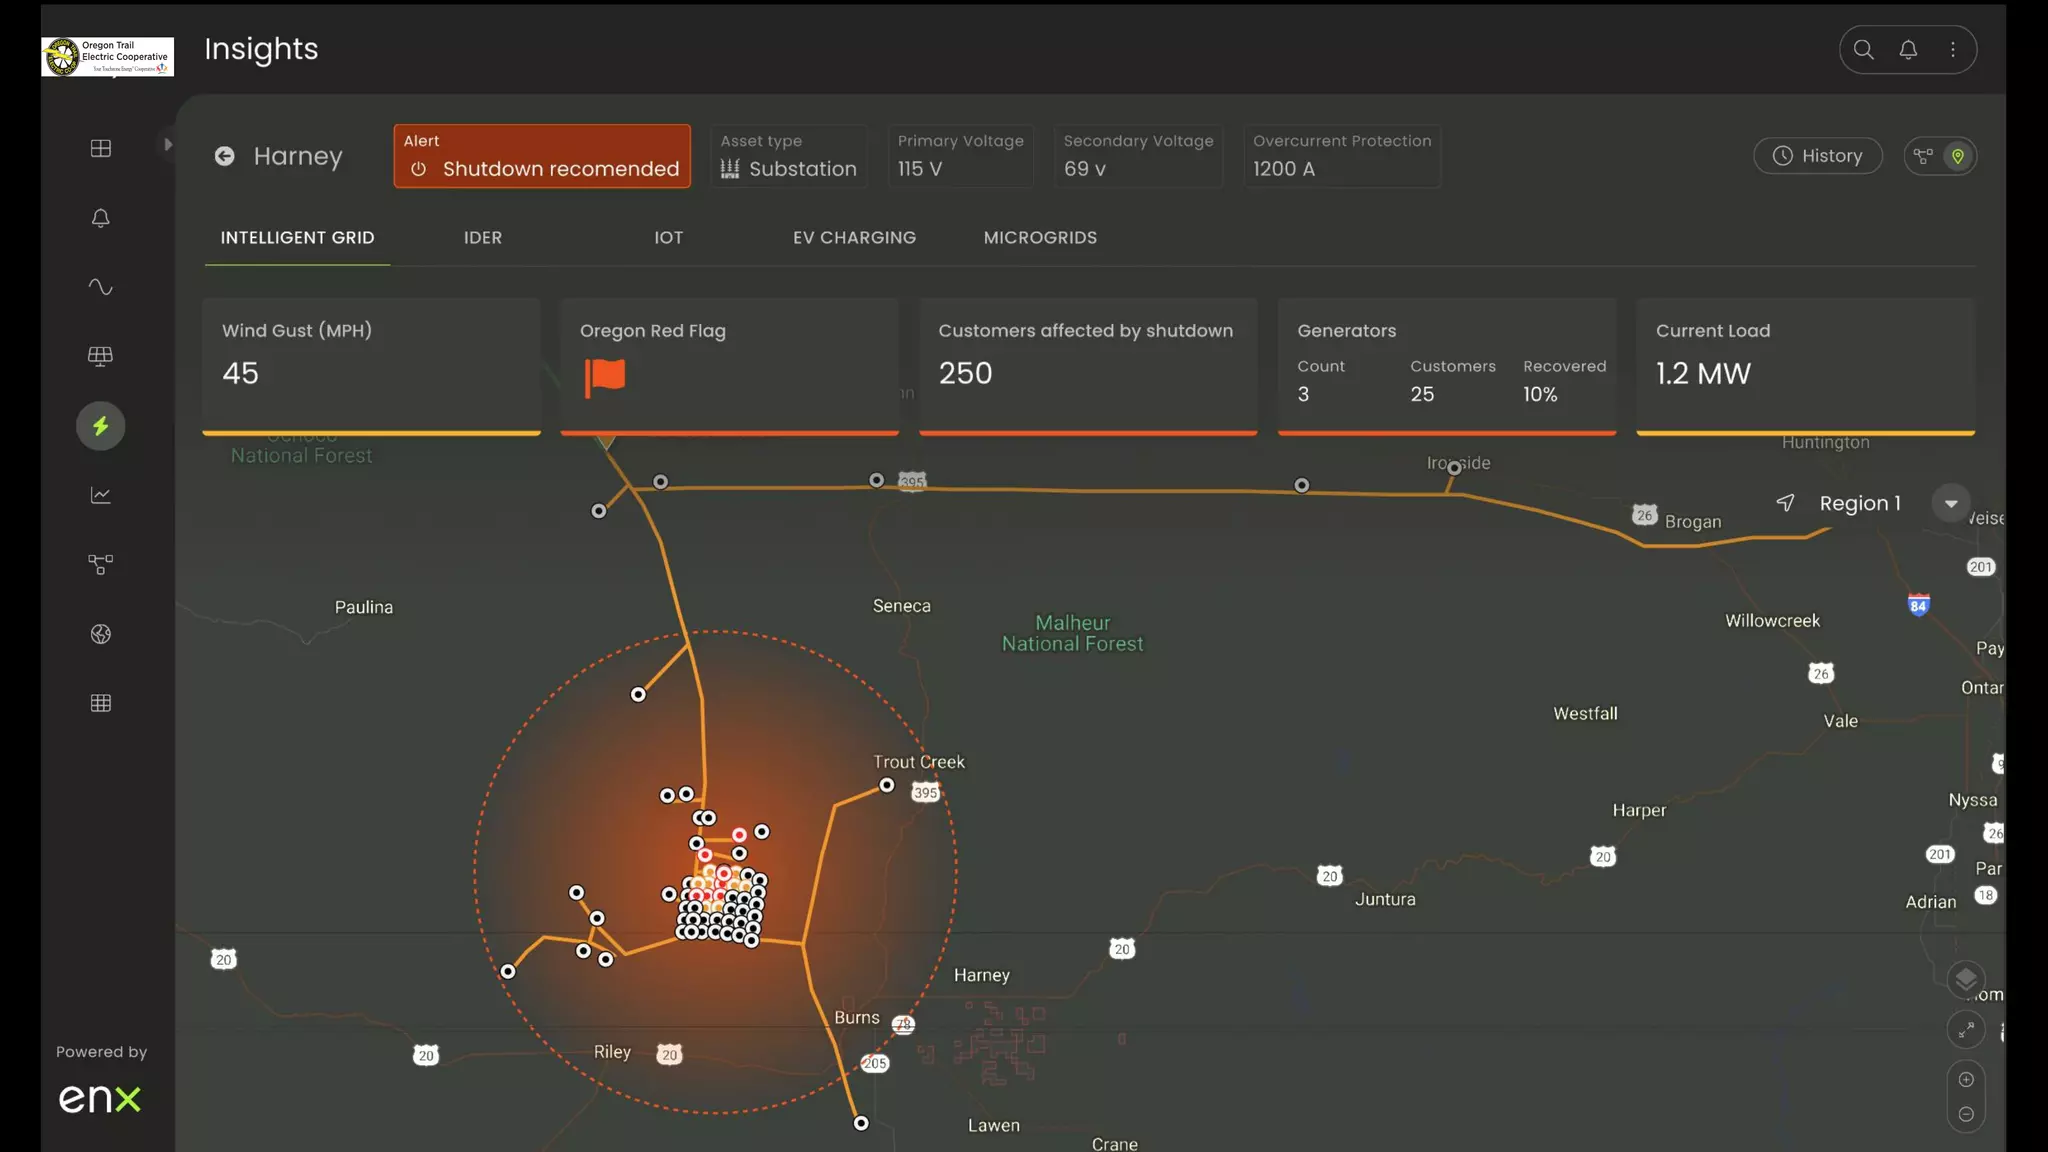
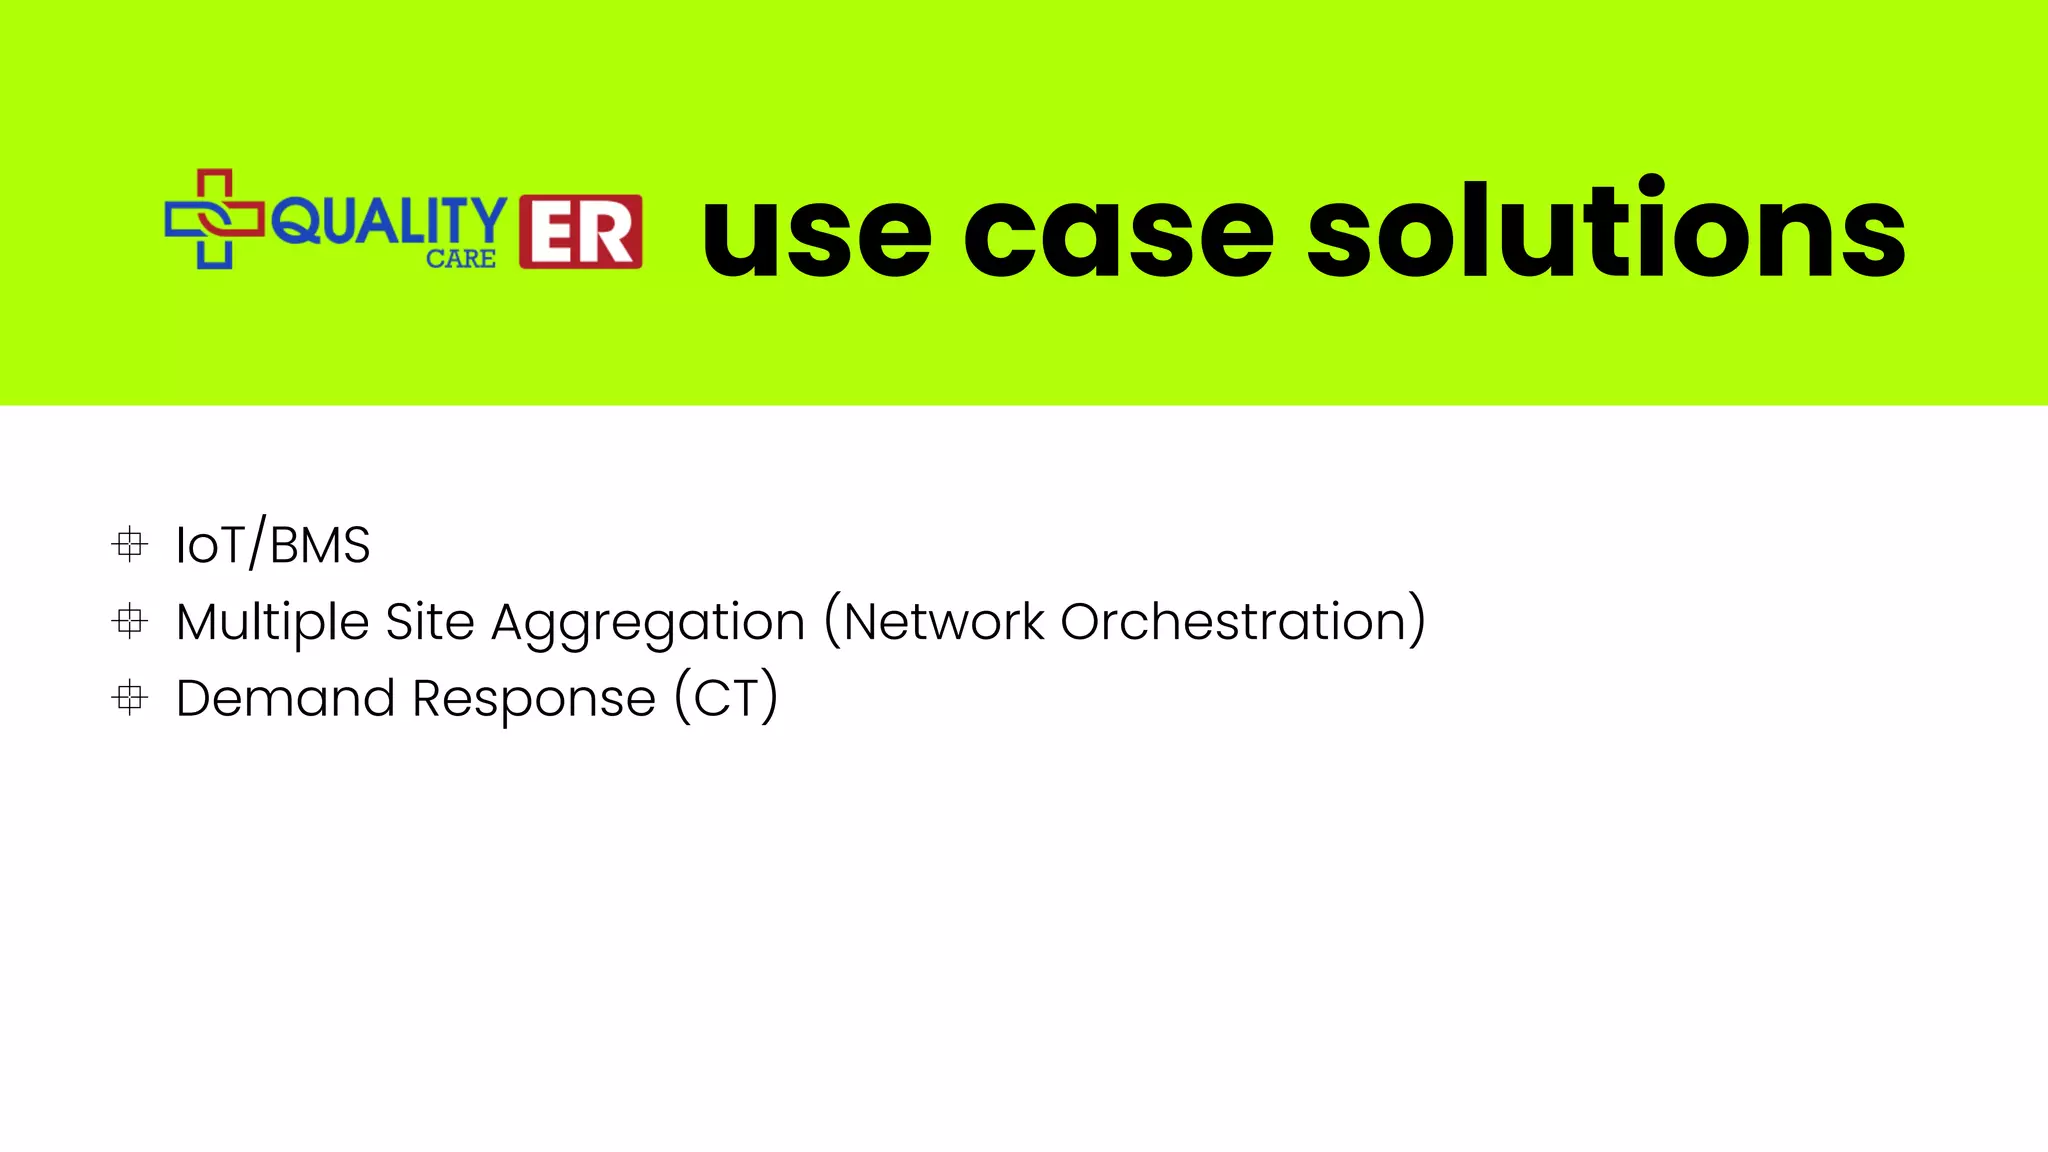
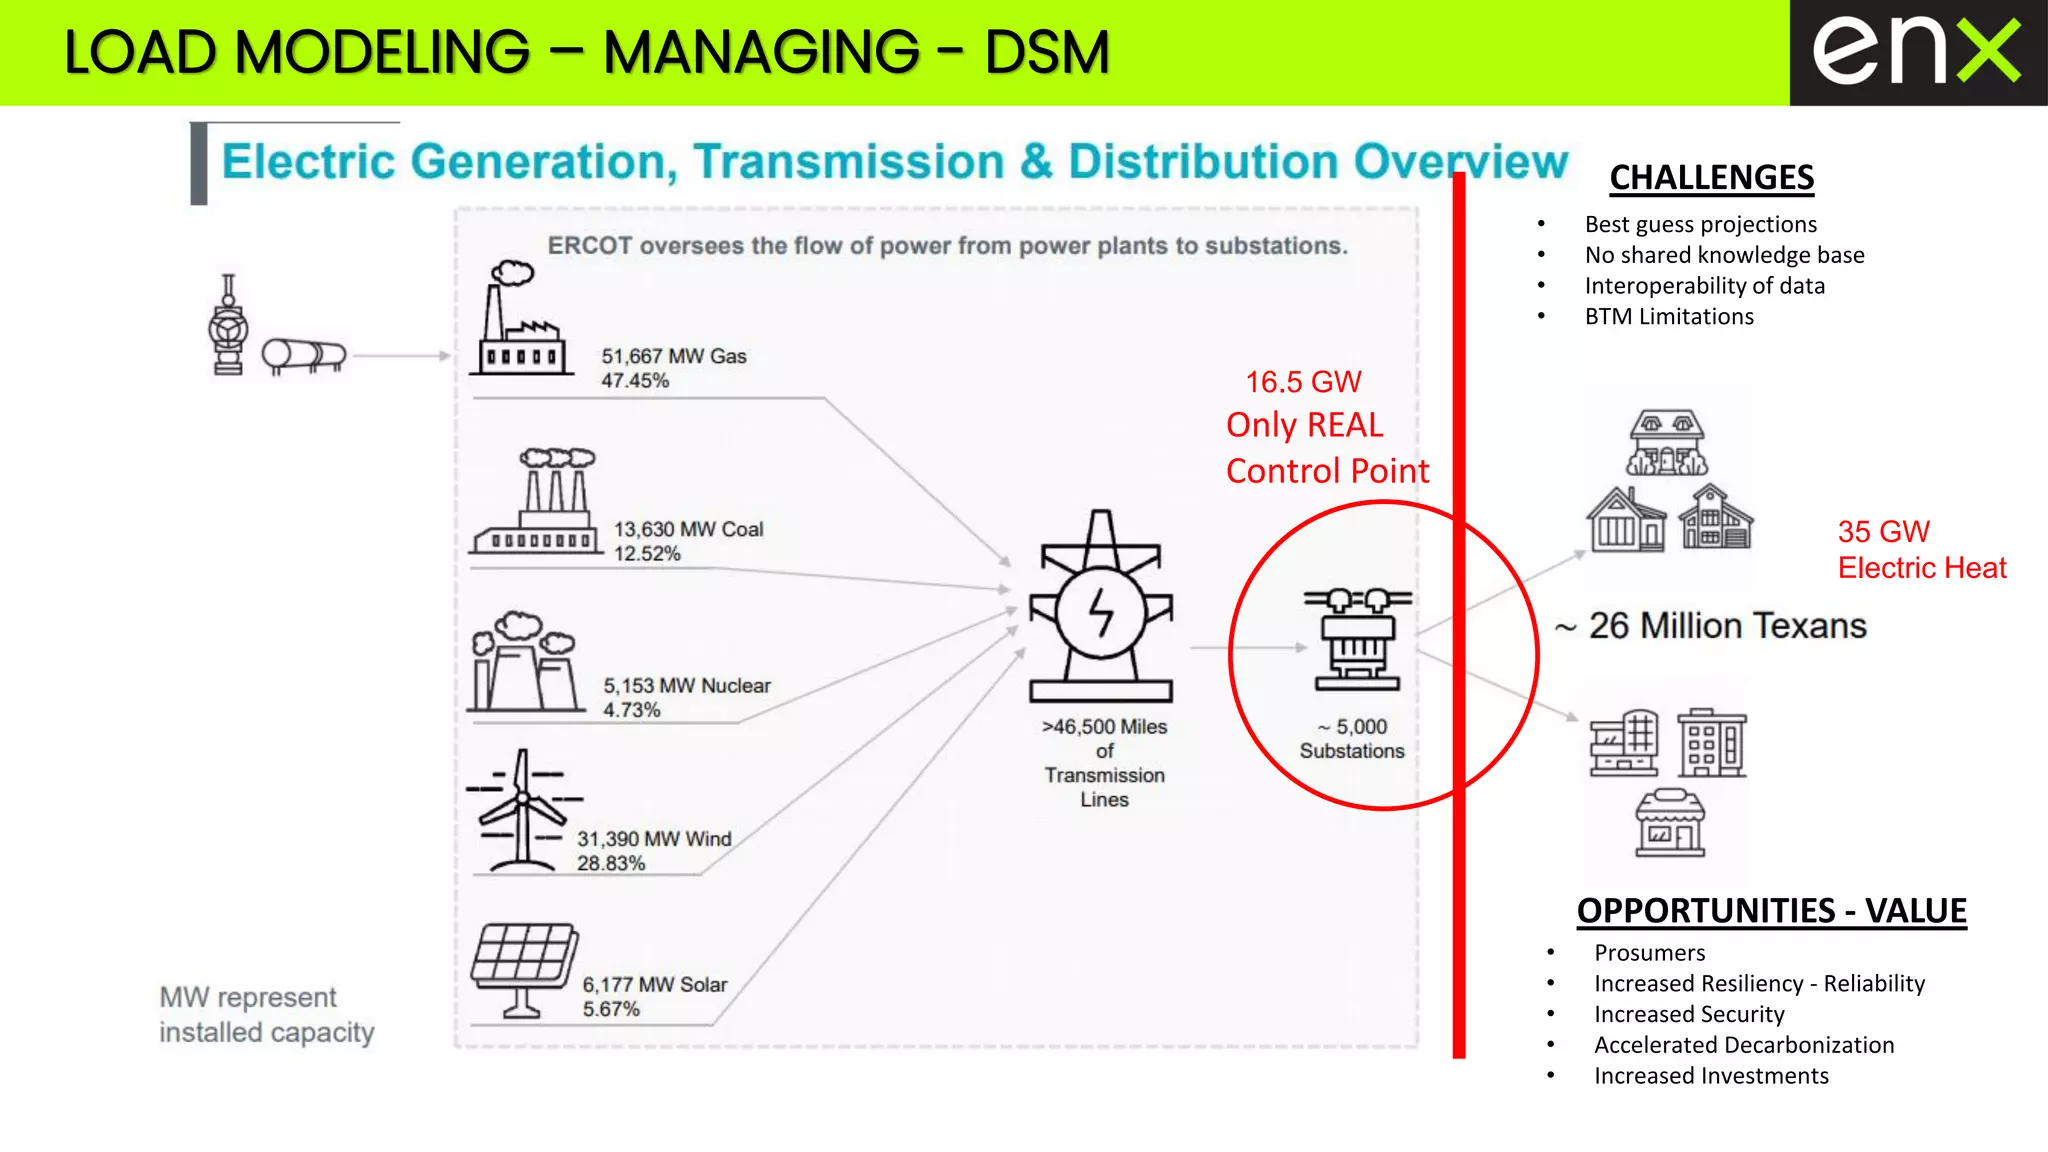
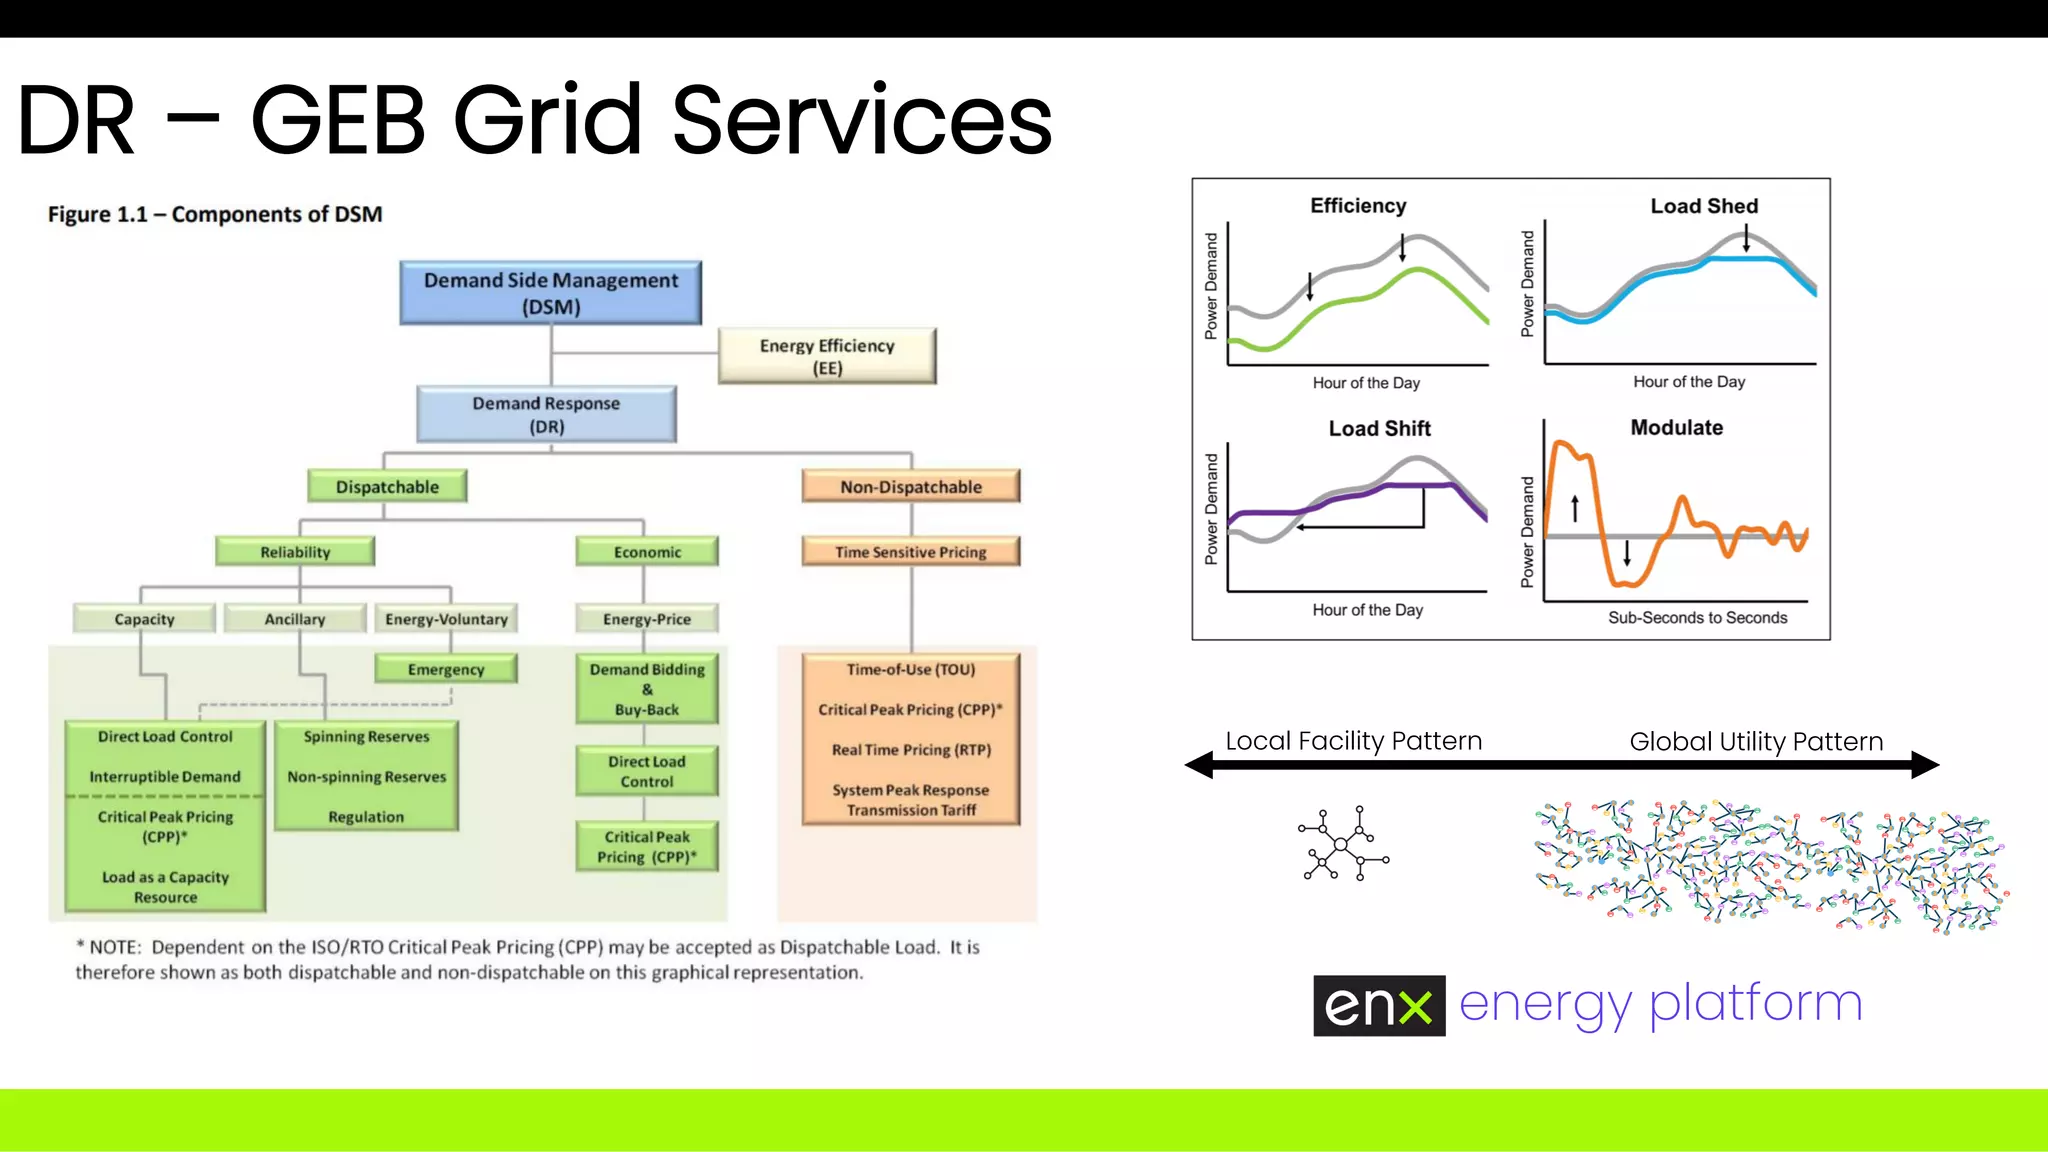
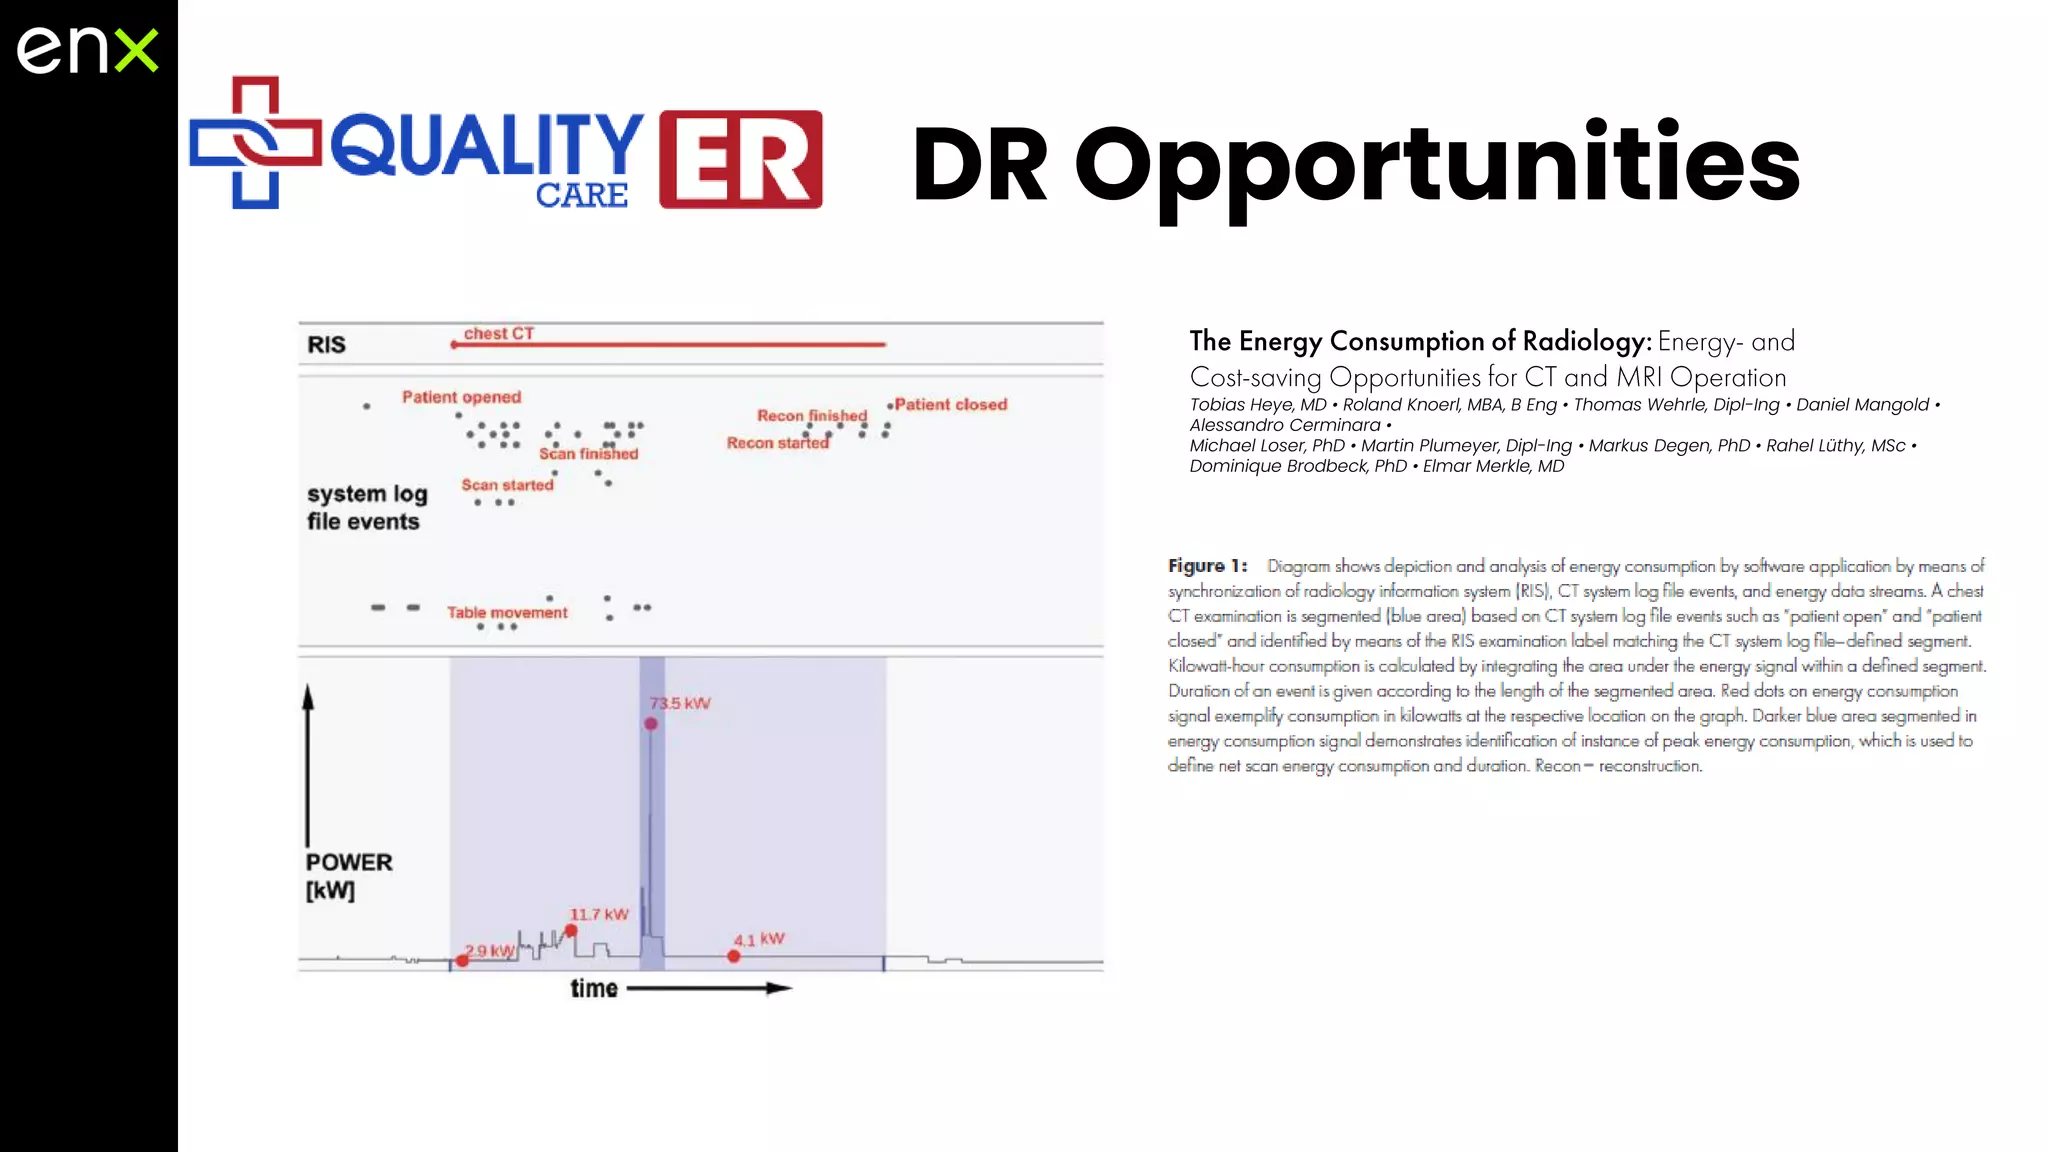
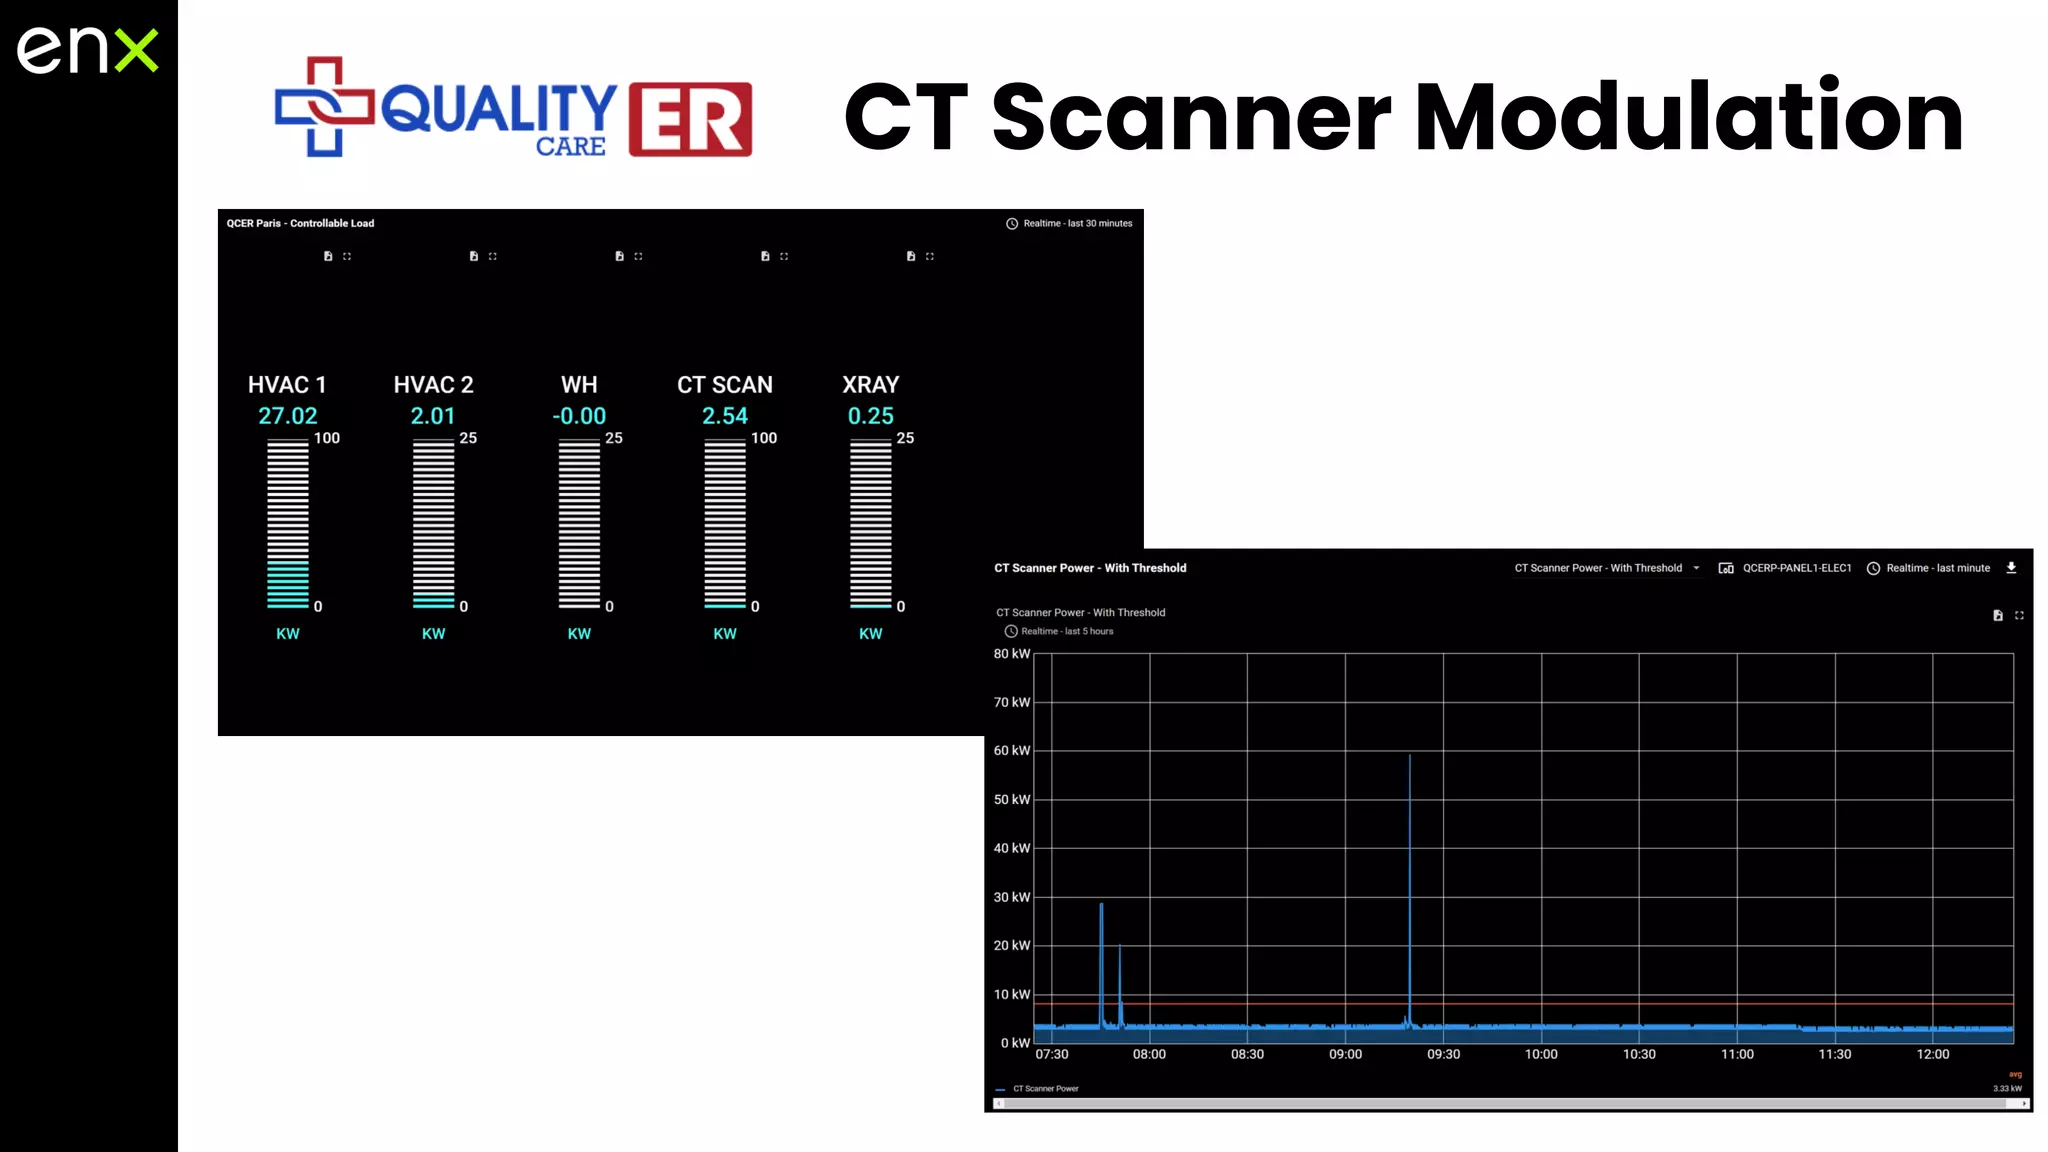
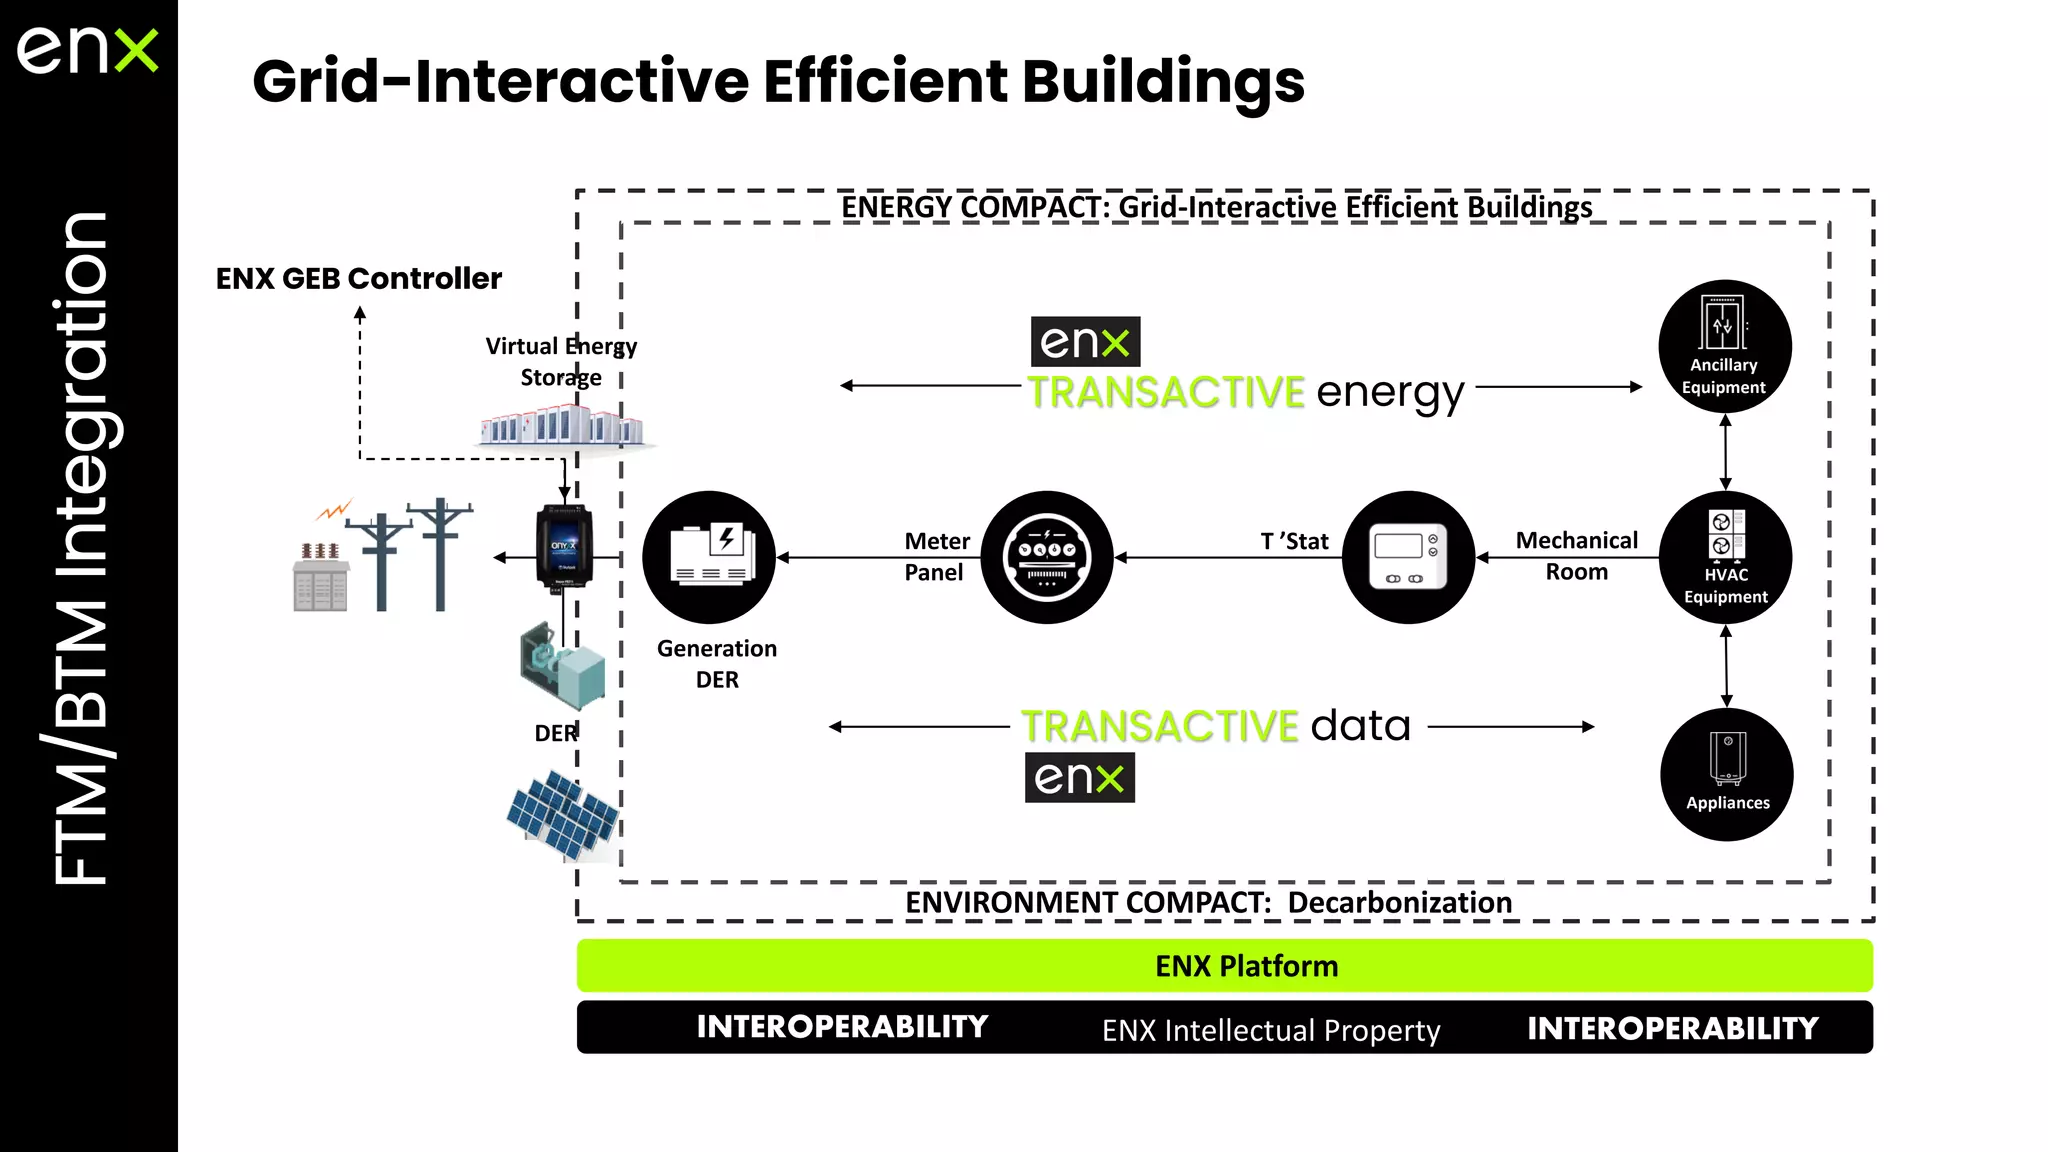
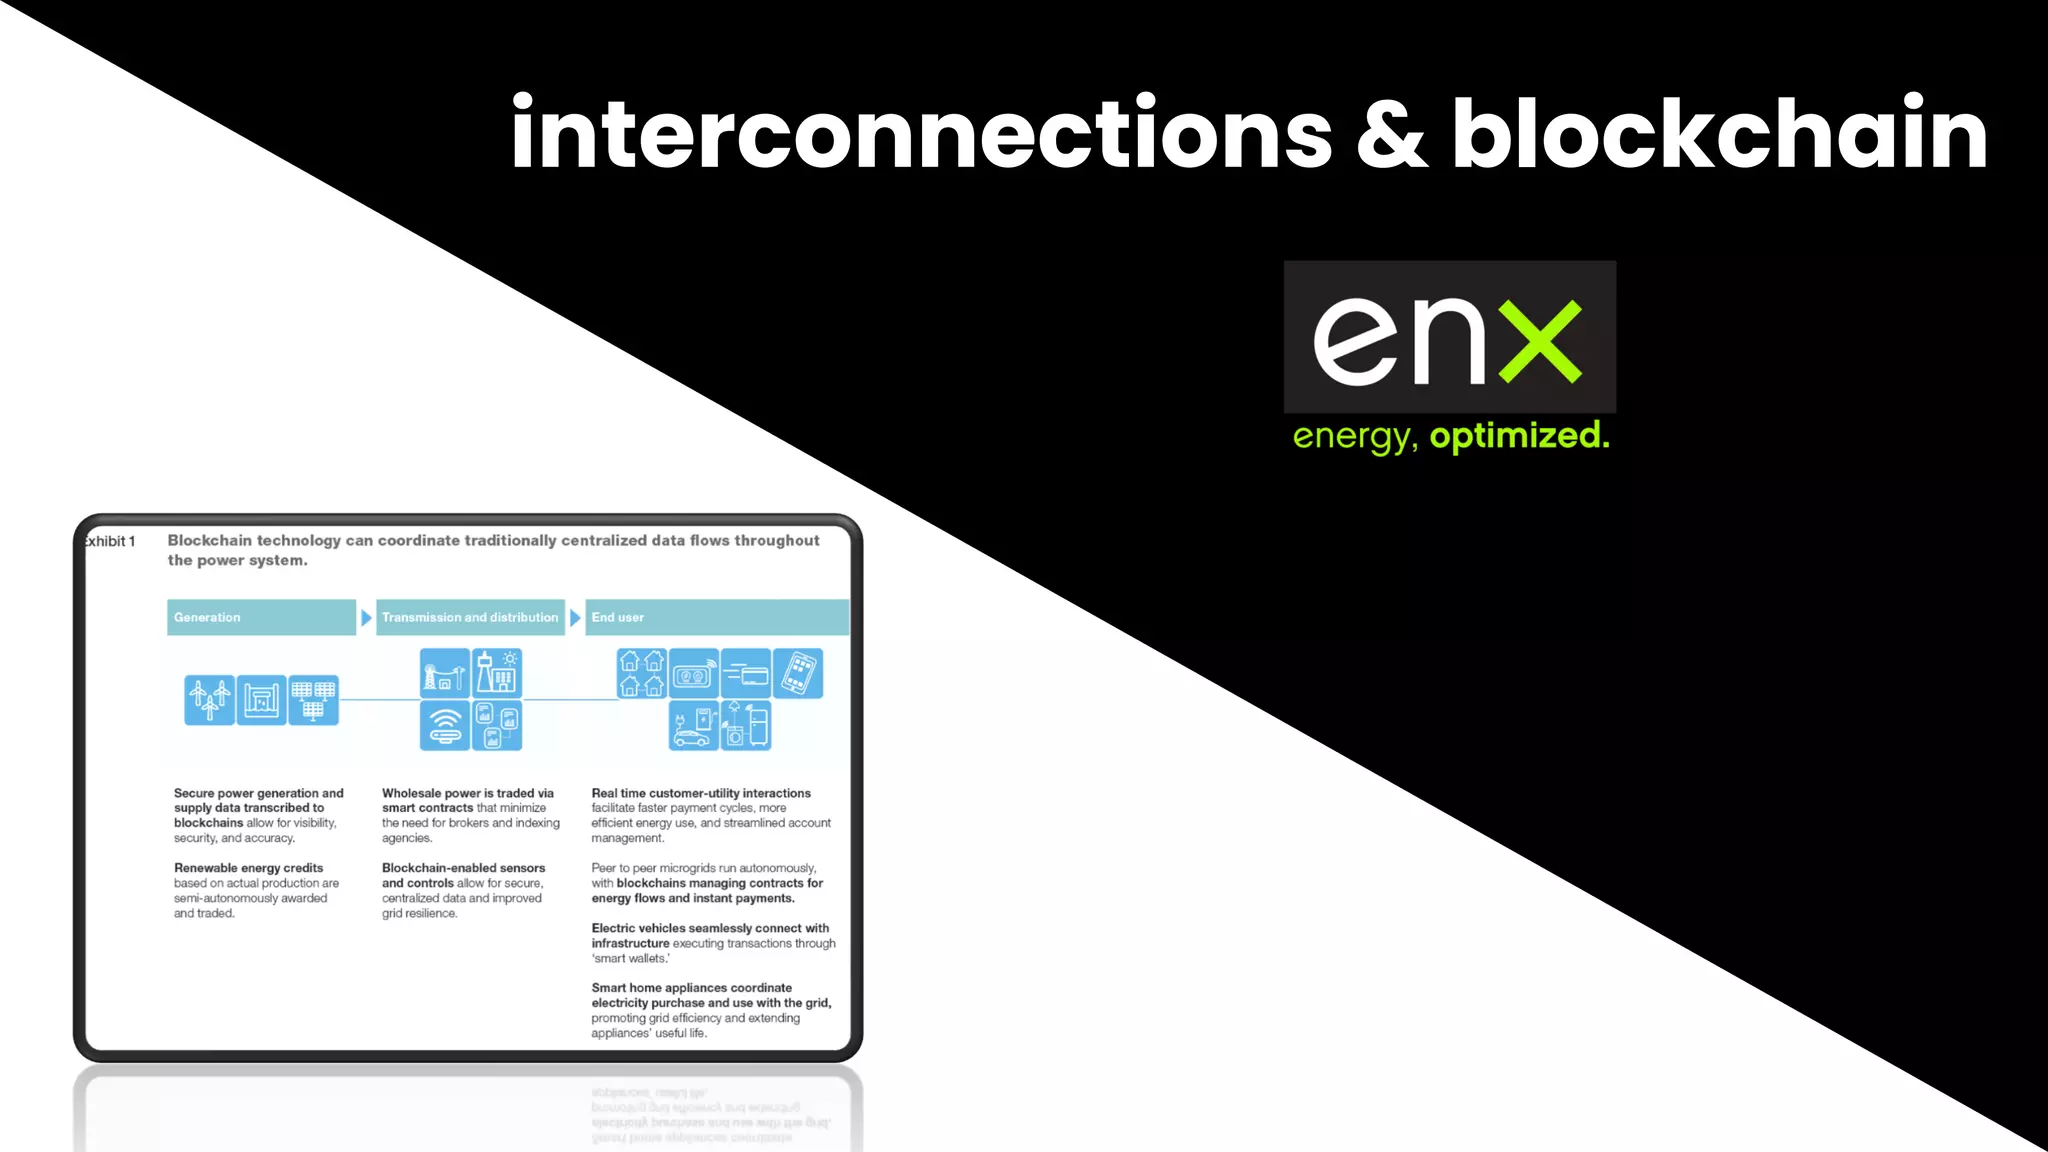
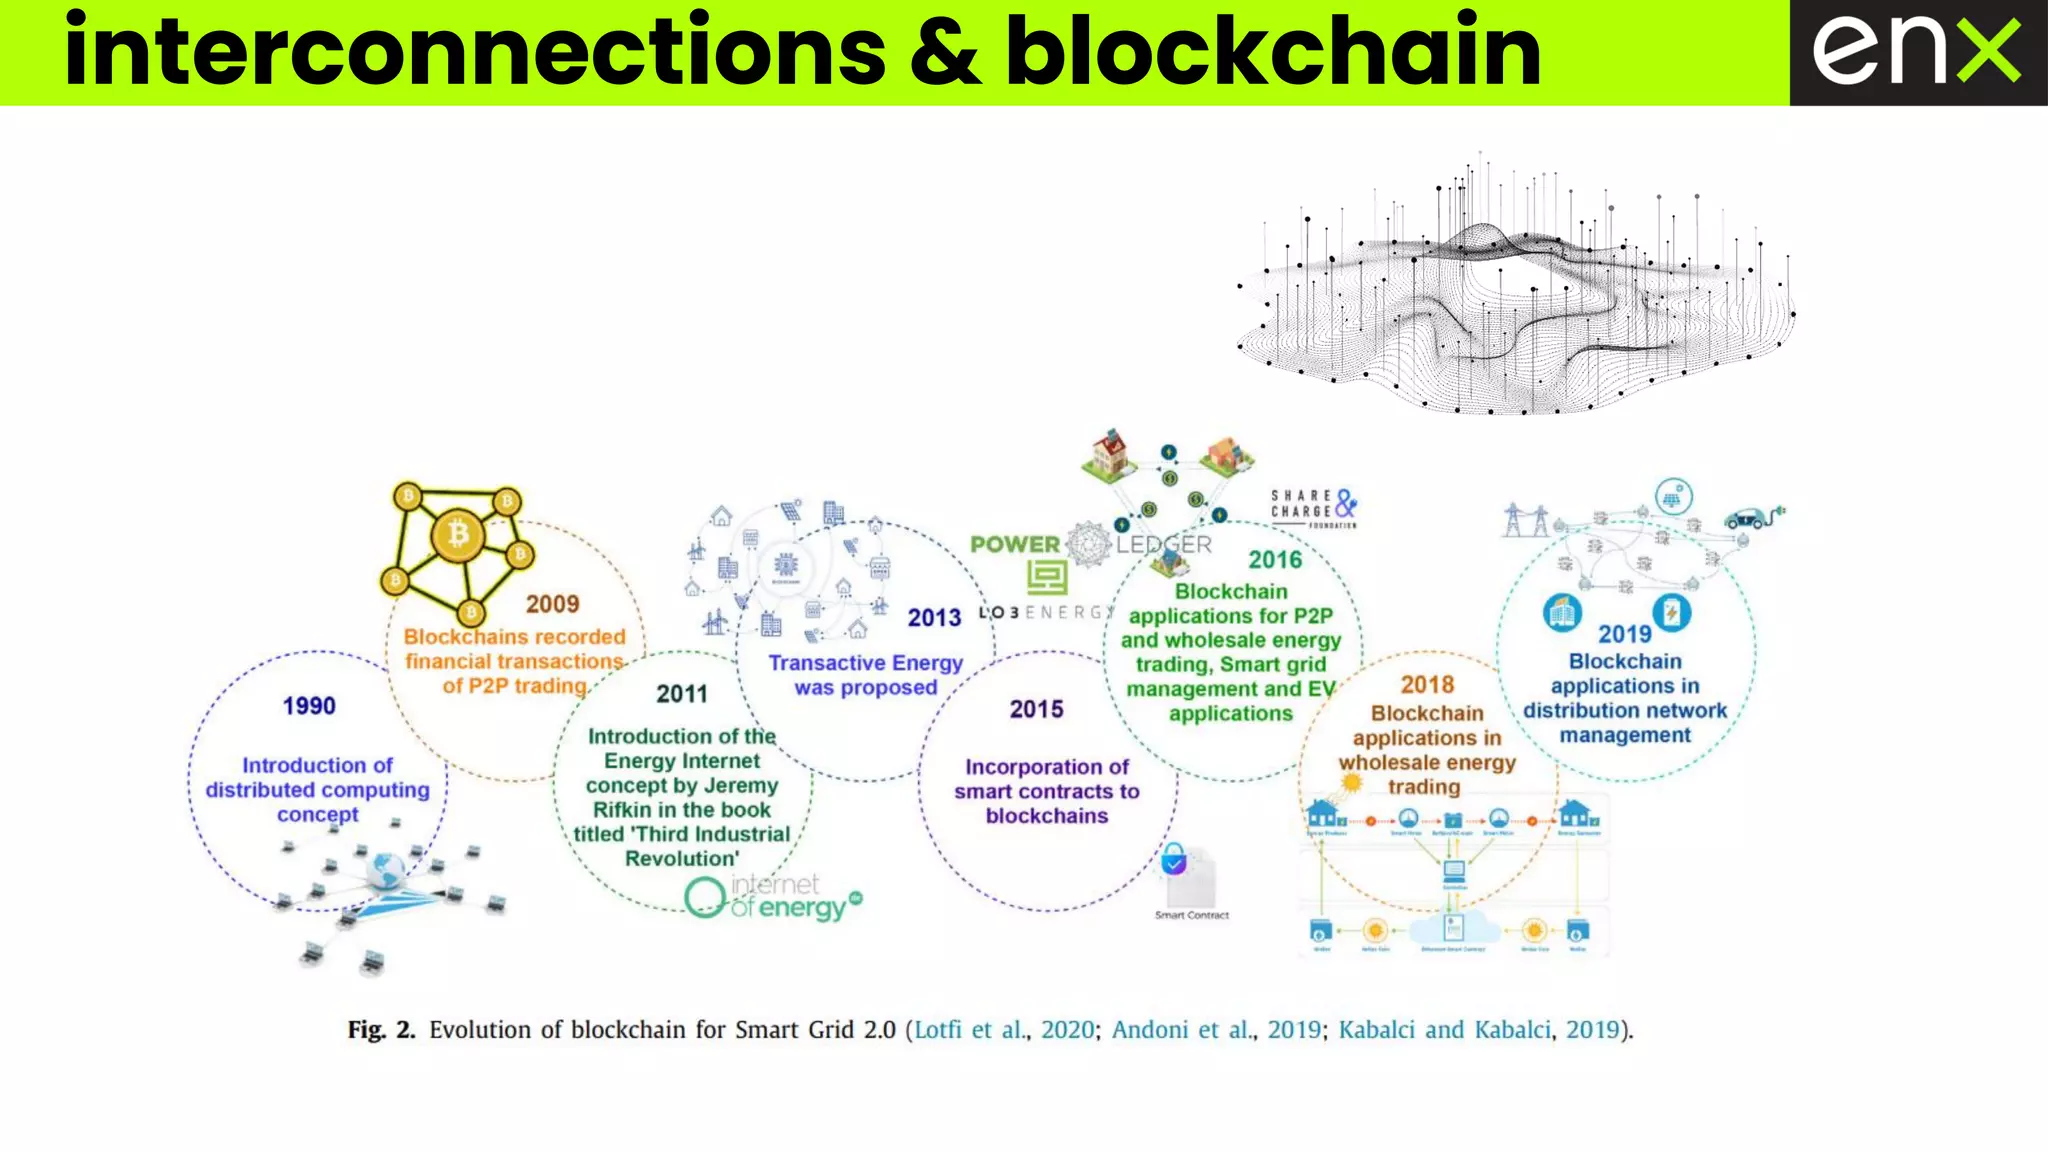
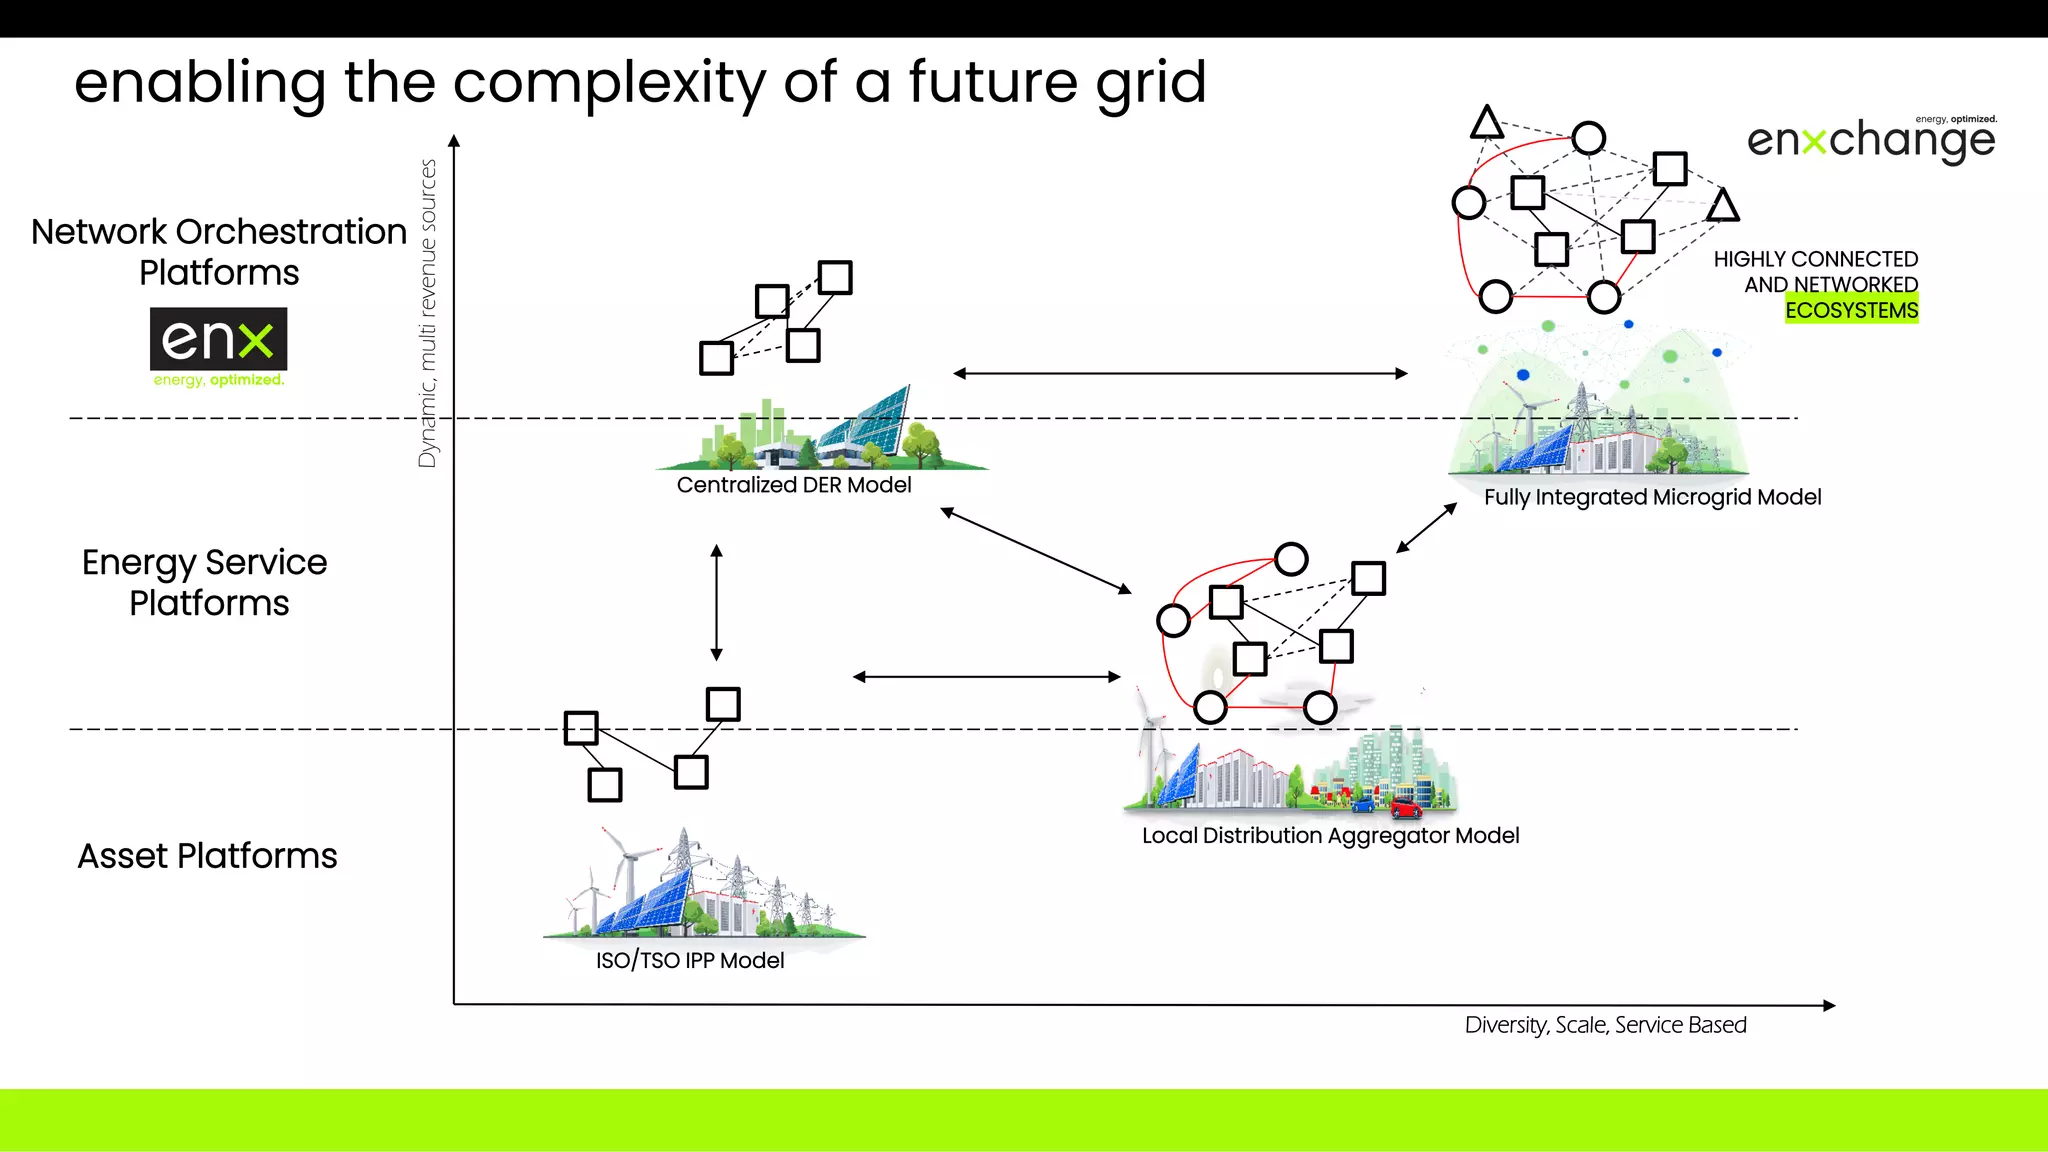
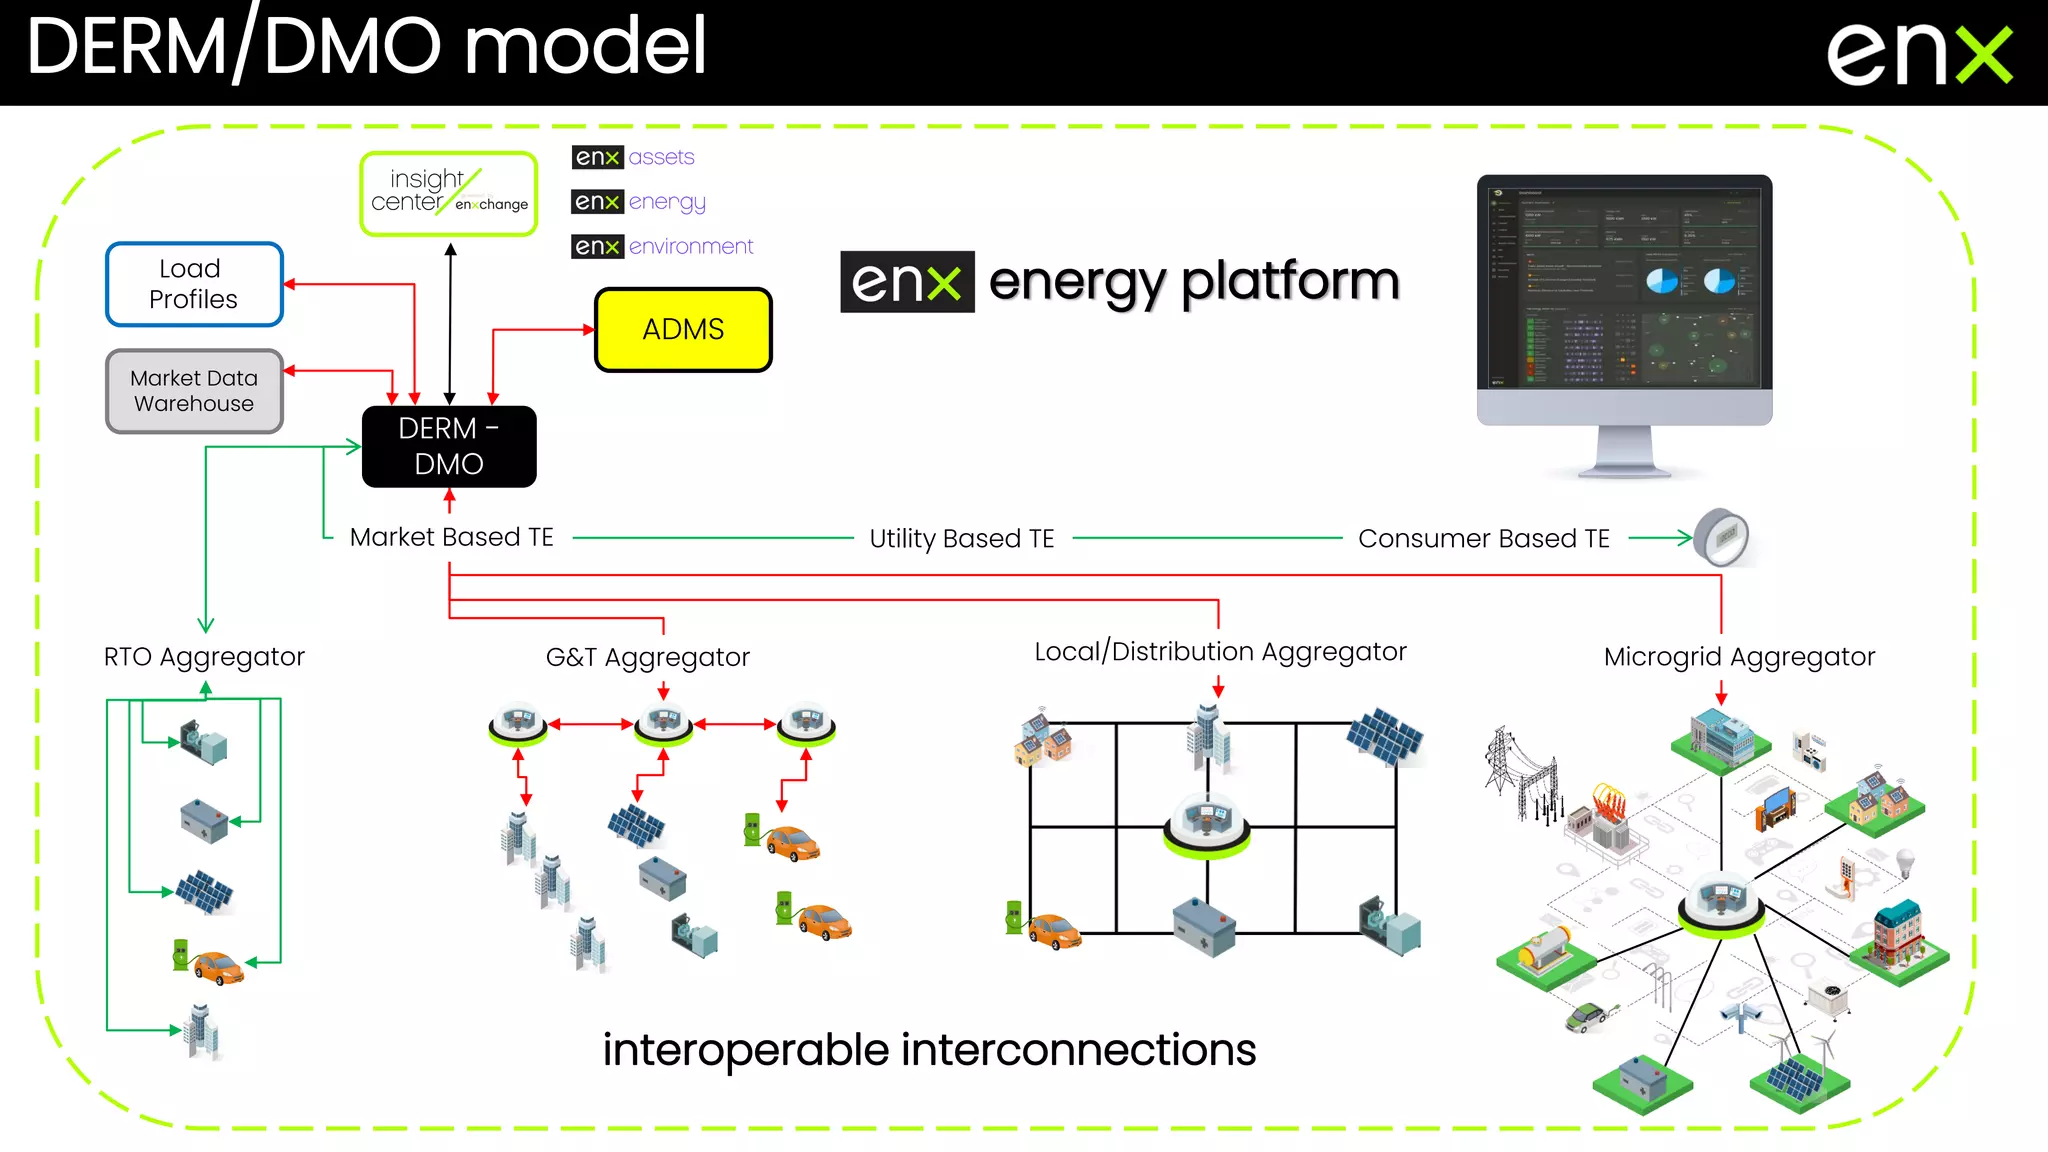
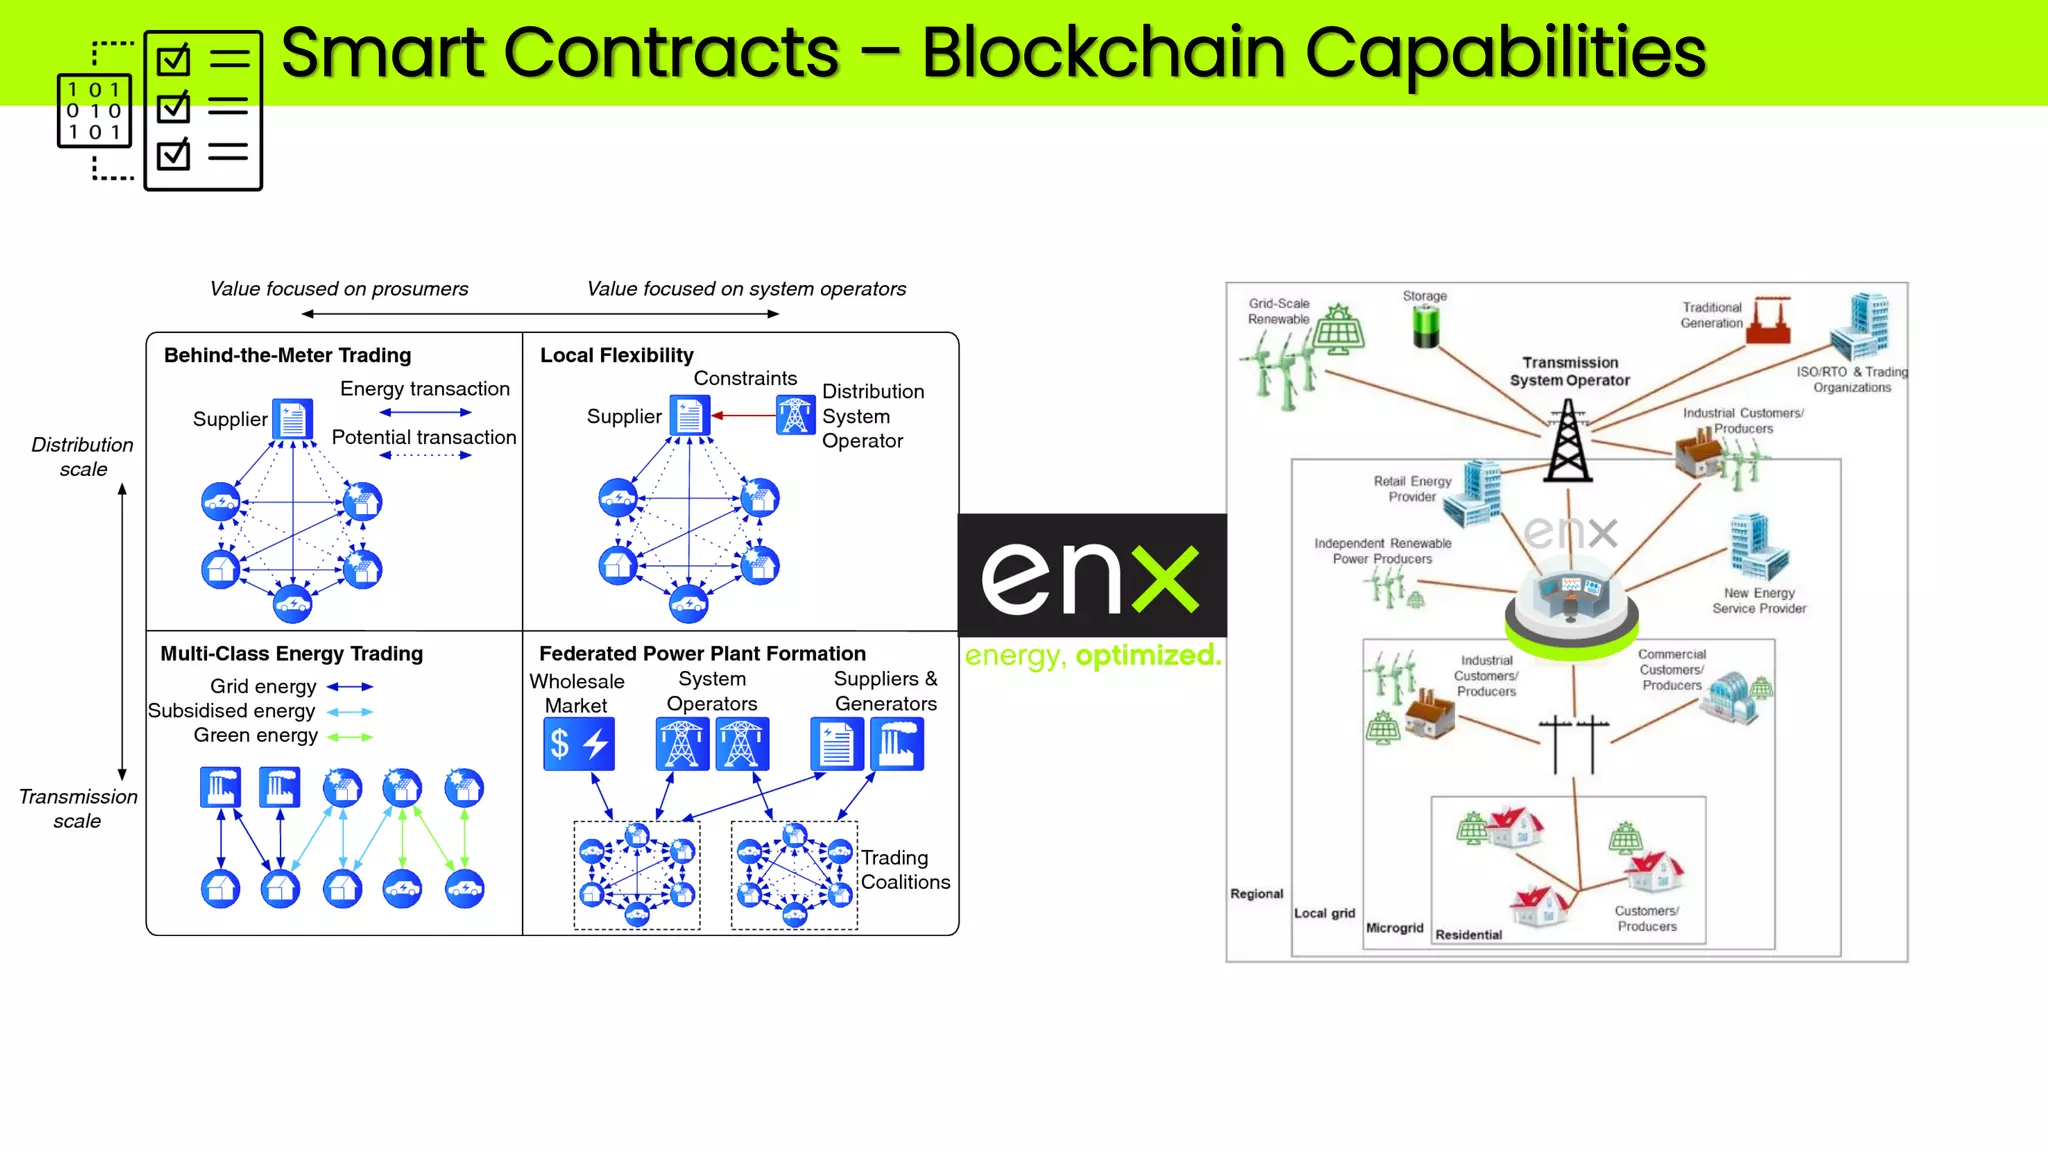
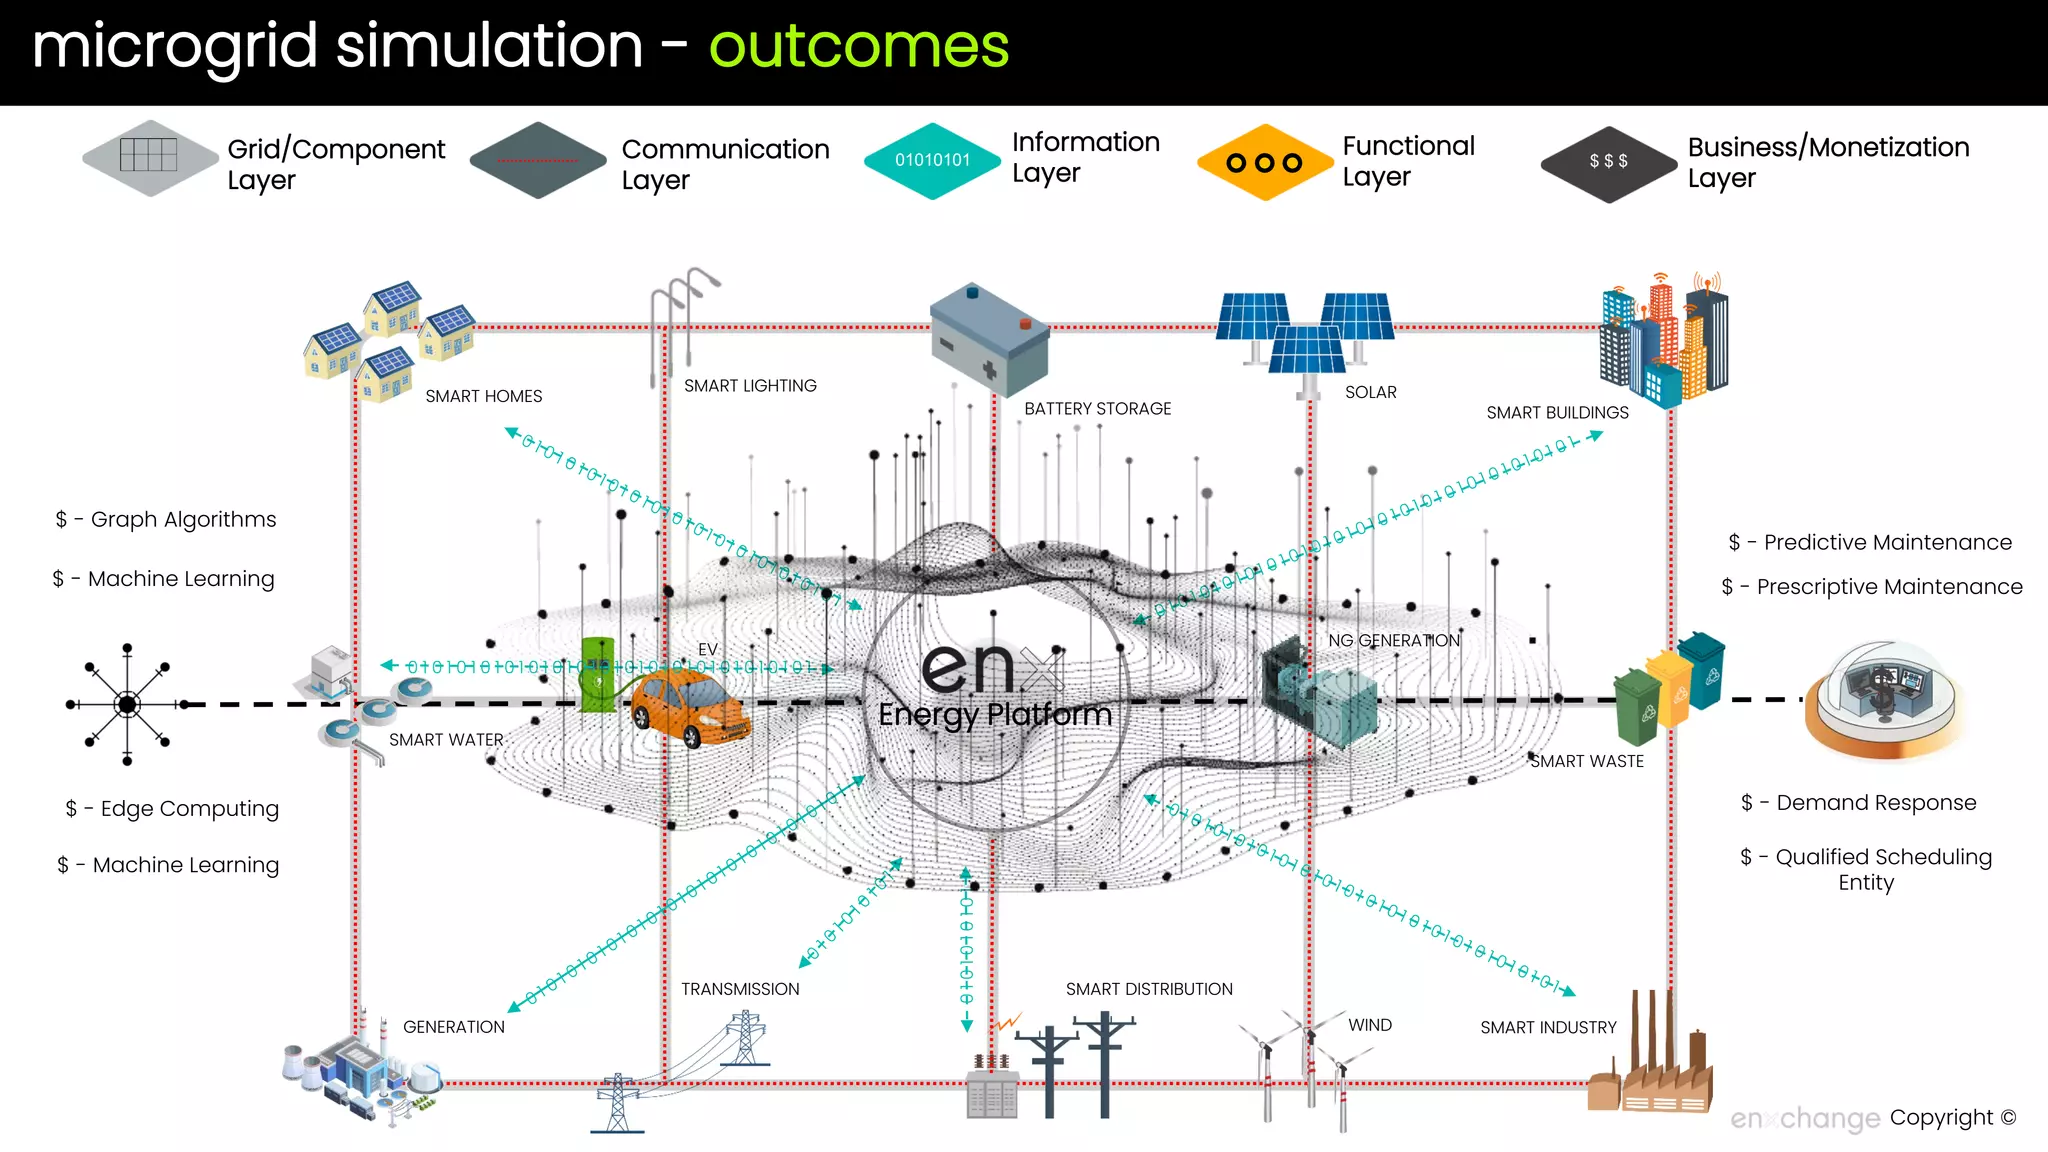
Copyright ©
Revolutionizing the Energy
Industry with Graphs
www.enxchange.io
David Swank, CEO
• 30+ Years in the Utility Industry with over 15 years
as CEO and 15 years utility engineering and
operations.
• DISTRIBUTECH Utility Automation Innovation Project
of the Year 1998
• City of Stillwater Leading Edge Award (Smart
Cities) Innovator of the Year 2018
• Public Utility Fortnightly 2018 Energy Innovator
Honor Role
• Oklahoma State University Research Partner of the
Year 2016 (National Energy Solutions Institute)
• CEO/Founder of the ENX Energy Platform
www.enxchange.io
DER Integration
Smart IoT
GEB – Virtual Power
Smart Infrastructure
EV Charging
Digital Platform
Microgrid - Smart Development/City
Connecting Data
Connecting
Generation to Toaster-
topics
 Why – How - What
 ENX Energy Platform - INTEROPERABILITY
 Knowledge Graph – Insight Center
 Transformative Use Cases (ML – AI)
 Utility Interconnections and Blockchain
 Q&A
www.enxchange.io
90%
DATA CREATED IN
LAST 3-4 YEARS
80%
DATA IS
UNSTRUCTURED
250PB
DATA PER DAY
FROM A SMART CITY
150GB
DATA PER HOUR FROM A
SMART BUILDING
220M
DEVICES WILL COME
ONLINE PER HOUR BY
2025
$110B by 2026
DER/Microgrids
$103B by 2023
BIG DATA REVENUE
PER YEAR
$142B by 2026
IoT Market
Market Capacity
Utilities are
leveraging less
than 4% of grid
data.
Utility Analytic
Revenues $2.3B by
2025.
Utility IoT and
the Grid Market
forecast $2B
Virtual (Physical)
Grid Model
Connecting
Data
Connecting
People
Connecting
Real Solutions
Transactive
Energy/Data
energy platform
Component
Layer
Network
Layer
Information
Layer
Functional
Layer
Business
Layer
Data Value - Actionable
Structured Data – Graph Model
6
Electricity Transmission / Distribution Networks are GRAPHS
WHY
GENERATION TRANSMISSION DISTRIBUTION MEMBER - CONSUMERS
current utility -
linear structure
RTO/ISO
DERM/DMO
energy platform
170 2000 850
 VPP
 EaaS
 Microgrids
 Transactive
Energy
 PROSUMERS
ENABLING
bi-directional energy flows
HOW
GENERATION TRANSMISSION DISTRIBUTION MEMBER - CONSUMERS
WHAT
current utility - linear structure to EaaS
DERM/DMO
energy platform
WHAT
Solar
Wind
Fossil Fuel
Hydro
Nuclear
Distribution
Power
Affected
Population
Critical
Consumers
Interconnect
Market
Sensitivity
Transport
Power
Critical
Time
Lost Power
Forecasting
Equipment
Age
Load Forecasting
Reliability Forecasting
Contingency Planning
Predictive
Actions
Prescriptive
Actions
Risk Index - Alerts
generation
transmission
distribution
INPUT LAYER HIDDEN LAYER OUTPUT LAYER VALUE LAYER
Graph Algorithms for Utility Predictive – Prescriptive Maintenance – Risk Mitigation
What that looks like
Graph Scenario Builder
energy platform
“Energy doesn’t exist in a vacuum”
HEADLINE
IoT/Tech
Components
Data
Mapping
Control
Schemes
Grid Intelligence
(Neural Grid)
Integrated
DER
Building2Grid
Vehicle2Grid
Smart, Places,
Microgrids
IoT/IoE
(FTM/BTM)
Data
Visualization
energy
platform
resiliency
insights
 Demand Response
 EaaS
 Microgrids
 VPP
 Business Intelligence
 Forecasting
 Machine Learning
 Digital Twins
 Air Quality
 Healthy Buildings
 Carbon Footprint
 Backup Generation
 Critical Loads
 Sustainability
 Redundancy
 Remote Asset Tracking
 Asset Health
 Asset Lifecycle
 Predictive Maintenance
single view convergent architecture system of systems hybrid platform advanced Analytics
Patent Pending Energy Platform
Networking Data - Generation to Toaster
Toaster
Patent Pending Energy Platform
knowledge graph
Patent Pending Energy Platform
180
IOU
–
2000
Municipals
850
Cooperatives
ENX global utility graph
CIS – EAM – AMI - SCADA – OMS - GIS
Utility
Graph
Intelligent Grid iDER IoT/BTM EV2GRid Microgrids
commercial
industrial
residential agriculture
Members
consumers
prosumers
Federation - Fabric Architecture
Copyright ©
Patent Pending Energy Platform
18
Real-time, local UTILITY
decisioning
and pattern matching
Graph Algorithms (GDS)
Global UTILITY analysis
and iterations
Limited visibility across
the utility network.
Unlimited visibility and
capabilities across the global
utility network: ML, AI, DT, TE
Local
Patterns
Global
Computation
our differentiator – federation/fabric architecture
Knowledge
Base
CIS/FIS
SCADA
GIS
OMS
SMART GRID
iDER
IoT/BMS
EV
MICROGRIDS
Global Data Lake
ASSET INTELIGENCE
ASSET HEALTH - THRESHOLDS
PREDICTIVE OUTAGES
SYSTEM RELIABILITY
LINE LOSS MANAGEMENT
VOLTAGE MANAGEMENT
TRANSACTIVE ENERGY
ENERGY AS A SERVICE
CARBON REDUCTIONS
Business Solutions
actionable
data
single view convergent architecture system of systems hybrid platform advanced Analytics
single
view
convergent
architecture
system
of
systems
single view convergent architecture system of systems hybrid platform advanced Analytics
advanced
analytics
system
of
systems
hybrid
platform
Knowledge extraction – Knowledge Integration – Knowledge Linking
Graph Network Building
Federation/Fabric Architecture
IoT Analytics
IoT Analytics
ABC COMMERCIAL
ABC INDUSTRIAL
ABC DEVELOPMENT
ABC AG ABC RETAIL
ABC SCHOOL
ABC HOSPITAL
ABC RURAL FIRE
Grid Intelligence
(Neural Grid)
Integrated DER
Building2Grid
Vehicle2Grid
Smart, Places,
and Microgrids
IoE, EaaS, TE
(FTM/BTM)
use cases
Utility Community Orchestration
R
S
S
w
w
w
w
ENX Weather Sensor
ENX Amp Sensor
ENX Guy-Wire Sensor
F1
F2
F3
F4
Feeder Breaker
Distribution
Transformers
Substation
Transformer
Open Tie Switch
3P Recloser
Weather
Regulator
Bank
1P Recloser
Weather
Capacitor Bank
1P Recloser
Guy - Wire
Amp Sensor
Amp Sensor
Pothead
S
S
S
S
Underground
Lateral
Elbow
Disconnects
1P Recloser
Open Tie
Switch
Sectionalizing
Regulator Bank
Capacitor Bank
Grid Intelligence
(Neural Grid)
Integrated
DER
Building2Grid
Vehicle2Grid Smart, Places,
Microgrids
IoT/IoE
(FTM/BTM)
 IoT/BMS
 Multiple Site Aggregation (Network Orchestration)
 Demand Response (CT)
use case solutions
• Prosumers
• Increased Resiliency - Reliability
• Increased Security
• Accelerated Decarbonization
• Increased Investments
Only REAL
Control Point
• Best guess projections
• No shared knowledge base
• Interoperability of data
• BTM Limitations
CHALLENGES
OPPORTUNITIES - VALUE
LOAD MODELING – MANAGING - DSM
16.5 GW
35 GW
Electric Heat
DR – GEB Grid Services
Local Facility Pattern Global Utility Pattern
energy platform
DR Opportunities
Tobias Heye, MD • Roland Knoerl, MBA, B Eng • Thomas Wehrle, Dipl-Ing • Daniel Mangold •
Alessandro Cerminara •
Michael Loser, PhD • Martin Plumeyer, Dipl-Ing • Markus Degen, PhD • Rahel Lüthy, MSc •
Dominique Brodbeck, PhD • Elmar Merkle, MD
CT Scanner Modulation
Grid-Interactive Efficient Buildings
Mechanical
Room
Meter
Panel
T ’Stat
TRANSACTIVE energy
ENX Platform
ENX Intellectual Property
Generation
DER
ENVIRONMENT COMPACT: Decarbonization
ENERGY COMPACT: Grid-Interactive Efficient Buildings
Virtual Energy
Storage
DER
HVAC
Equipment
Ancillary
Equipment
Appliances
INTEROPERABILITY INTEROPERABILITY
FTM/BTM
Integration
ENX GEB Controller
TRANSACTIVE data
interconnections & blockchain
ISO/TSO IPP Model
Centralized DER Model
Local Distribution Aggregator Model
Fully Integrated Microgrid Model
Diversity, Scale, Service Based
Dynamic,
multi
revenue
sources
Asset Platforms
Energy Service
Platforms
Network Orchestration
Platforms
HIGHLY CONNECTED
AND NETWORKED
ECOSYSTEMS
enabling the complexity of a future grid
energy platform
Load
Profiles
Market Data
Warehouse
DERM -
DMO
ADMS
Microgrid Aggregator
G&T Aggregator Local/Distribution Aggregator
RTO Aggregator
Utility Based TE Consumer Based TE
Market Based TE
interoperable interconnections
DERM/DMO model
Utility Ecosystem Building – Network Orchestration
Navigant reports “that every company uses one or more of
four basic business models: asset builder, service provider,
technology creator, and network orchestrator.” Among
Fortune 500 companies, linear business model
(asset builder, service provider, and technology creator) on
average scale more slowly and are less profitable
than the platform focused network orchestrator business
models
VALUE OF NETWORK ORCEHSTRATING
Substation
Local Utility
Transmission
Generation
RTO Market
Facilities
LOADS
Voltage
Traditional Utility Interconnections
Line Loss
Energy Demand
PF
Harmonics
N1 Resiliency
TOP DOWN – LINEAR PLANNING MODEL
interconnections
Overbuilt Infrastructure – Operational Deficiencies (Line Loss – Load Factor)
interconnections
interconnections
interconnections
interconnections
interconnections
Substation
Local Utility
Transmission
Generation
RTO Market
Facilities
LOADS
Grid Optimization – Decreased Line Loss – Increased Load Factory – DR Flexibility
Voltage
BOTTOM UP – NETWORKS OF NETWORKS PLANNING MODEL
Smart Contracts – Utility Interconnections
Line Loss
Energy Demand
PF
Harmonics
N1 Resiliency
smart contract
interconnections
transactive
energy
smart contract
interconnections
transactive
energy
smart contract
interconnections
transactive
energy
smart contract
interconnections
transactive
energy
smart contract
interconnections
transactive
energy
smart contract
interconnections
transactive
energy
Smart Contracts – Blockchain Capabilities
microgrid simulation - outcomes
SMART LIGHTING
SMART INDUSTRY
WIND
TRANSMISSION
GENERATION
SMART WATER
SMART WASTE
EV
Grid/Component
Layer
SMART DISTRIBUTION
Energy Platform
$
$ - Qualified Scheduling
Entity
NG GENERATION
Communication
Layer
Information
Layer
01010101
Functional
Layer
Business/Monetization
Layer
$ $ $
0 1 0 1 0 1 0 1 0 1 0 1 0 1 0 1 0 1 0 1 0 1 0 1 0 1 0 1 0 1 0 1 0 1
0
1
0
1
0
1
0
1
0
1
SOLAR
BATTERY STORAGE SMART BUILDINGS
SMART HOMES
$
$ - Predictive Maintenance
$ - Prescriptive Maintenance
$ - Demand Response
$ - Graph Algorithms
$ - Machine Learning
$ - Edge Computing
$ - Machine Learning
Copyright ©
thank you
Copyright ©

Revolutionizing the Energy Industry with Graphs

  • 1.
    Copyright © Revolutionizing theEnergy Industry with Graphs www.enxchange.io
  • 2.
    David Swank, CEO •30+ Years in the Utility Industry with over 15 years as CEO and 15 years utility engineering and operations. • DISTRIBUTECH Utility Automation Innovation Project of the Year 1998 • City of Stillwater Leading Edge Award (Smart Cities) Innovator of the Year 2018 • Public Utility Fortnightly 2018 Energy Innovator Honor Role • Oklahoma State University Research Partner of the Year 2016 (National Energy Solutions Institute) • CEO/Founder of the ENX Energy Platform www.enxchange.io
  • 3.
    DER Integration Smart IoT GEB– Virtual Power Smart Infrastructure EV Charging Digital Platform Microgrid - Smart Development/City Connecting Data Connecting Generation to Toaster-
  • 4.
    topics  Why –How - What  ENX Energy Platform - INTEROPERABILITY  Knowledge Graph – Insight Center  Transformative Use Cases (ML – AI)  Utility Interconnections and Blockchain  Q&A www.enxchange.io
  • 5.
    90% DATA CREATED IN LAST3-4 YEARS 80% DATA IS UNSTRUCTURED 250PB DATA PER DAY FROM A SMART CITY 150GB DATA PER HOUR FROM A SMART BUILDING 220M DEVICES WILL COME ONLINE PER HOUR BY 2025 $110B by 2026 DER/Microgrids $103B by 2023 BIG DATA REVENUE PER YEAR $142B by 2026 IoT Market Market Capacity Utilities are leveraging less than 4% of grid data. Utility Analytic Revenues $2.3B by 2025. Utility IoT and the Grid Market forecast $2B Virtual (Physical) Grid Model Connecting Data Connecting People Connecting Real Solutions Transactive Energy/Data energy platform Component Layer Network Layer Information Layer Functional Layer Business Layer Data Value - Actionable Structured Data – Graph Model
  • 6.
    6 Electricity Transmission /Distribution Networks are GRAPHS WHY
  • 7.
    GENERATION TRANSMISSION DISTRIBUTIONMEMBER - CONSUMERS current utility - linear structure RTO/ISO DERM/DMO energy platform 170 2000 850  VPP  EaaS  Microgrids  Transactive Energy  PROSUMERS ENABLING bi-directional energy flows HOW
  • 8.
    GENERATION TRANSMISSION DISTRIBUTIONMEMBER - CONSUMERS WHAT current utility - linear structure to EaaS DERM/DMO energy platform WHAT
  • 9.
    Solar Wind Fossil Fuel Hydro Nuclear Distribution Power Affected Population Critical Consumers Interconnect Market Sensitivity Transport Power Critical Time Lost Power Forecasting Equipment Age LoadForecasting Reliability Forecasting Contingency Planning Predictive Actions Prescriptive Actions Risk Index - Alerts generation transmission distribution INPUT LAYER HIDDEN LAYER OUTPUT LAYER VALUE LAYER Graph Algorithms for Utility Predictive – Prescriptive Maintenance – Risk Mitigation What that looks like
  • 10.
  • 11.
    energy platform “Energy doesn’texist in a vacuum” HEADLINE
  • 13.
    IoT/Tech Components Data Mapping Control Schemes Grid Intelligence (Neural Grid) Integrated DER Building2Grid Vehicle2Grid Smart,Places, Microgrids IoT/IoE (FTM/BTM) Data Visualization energy platform resiliency insights  Demand Response  EaaS  Microgrids  VPP  Business Intelligence  Forecasting  Machine Learning  Digital Twins  Air Quality  Healthy Buildings  Carbon Footprint  Backup Generation  Critical Loads  Sustainability  Redundancy  Remote Asset Tracking  Asset Health  Asset Lifecycle  Predictive Maintenance single view convergent architecture system of systems hybrid platform advanced Analytics Patent Pending Energy Platform
  • 14.
    Networking Data -Generation to Toaster Toaster Patent Pending Energy Platform
  • 16.
  • 17.
    180 IOU – 2000 Municipals 850 Cooperatives ENX global utilitygraph CIS – EAM – AMI - SCADA – OMS - GIS Utility Graph Intelligent Grid iDER IoT/BTM EV2GRid Microgrids commercial industrial residential agriculture Members consumers prosumers Federation - Fabric Architecture Copyright © Patent Pending Energy Platform
  • 18.
    18 Real-time, local UTILITY decisioning andpattern matching Graph Algorithms (GDS) Global UTILITY analysis and iterations Limited visibility across the utility network. Unlimited visibility and capabilities across the global utility network: ML, AI, DT, TE Local Patterns Global Computation our differentiator – federation/fabric architecture
  • 19.
    Knowledge Base CIS/FIS SCADA GIS OMS SMART GRID iDER IoT/BMS EV MICROGRIDS Global DataLake ASSET INTELIGENCE ASSET HEALTH - THRESHOLDS PREDICTIVE OUTAGES SYSTEM RELIABILITY LINE LOSS MANAGEMENT VOLTAGE MANAGEMENT TRANSACTIVE ENERGY ENERGY AS A SERVICE CARBON REDUCTIONS Business Solutions actionable data single view convergent architecture system of systems hybrid platform advanced Analytics single view convergent architecture system of systems single view convergent architecture system of systems hybrid platform advanced Analytics advanced analytics system of systems hybrid platform Knowledge extraction – Knowledge Integration – Knowledge Linking
  • 20.
    Graph Network Building Federation/FabricArchitecture IoT Analytics IoT Analytics ABC COMMERCIAL ABC INDUSTRIAL ABC DEVELOPMENT ABC AG ABC RETAIL ABC SCHOOL ABC HOSPITAL ABC RURAL FIRE Grid Intelligence (Neural Grid) Integrated DER Building2Grid Vehicle2Grid Smart, Places, and Microgrids IoE, EaaS, TE (FTM/BTM)
  • 21.
  • 22.
    R S S w w w w ENX Weather Sensor ENXAmp Sensor ENX Guy-Wire Sensor F1 F2 F3 F4 Feeder Breaker Distribution Transformers Substation Transformer Open Tie Switch 3P Recloser Weather Regulator Bank 1P Recloser Weather Capacitor Bank 1P Recloser Guy - Wire Amp Sensor Amp Sensor Pothead S S S S Underground Lateral Elbow Disconnects 1P Recloser Open Tie Switch Sectionalizing Regulator Bank Capacitor Bank Grid Intelligence (Neural Grid) Integrated DER Building2Grid Vehicle2Grid Smart, Places, Microgrids IoT/IoE (FTM/BTM)
  • 24.
     IoT/BMS  MultipleSite Aggregation (Network Orchestration)  Demand Response (CT) use case solutions
  • 25.
    • Prosumers • IncreasedResiliency - Reliability • Increased Security • Accelerated Decarbonization • Increased Investments Only REAL Control Point • Best guess projections • No shared knowledge base • Interoperability of data • BTM Limitations CHALLENGES OPPORTUNITIES - VALUE LOAD MODELING – MANAGING - DSM 16.5 GW 35 GW Electric Heat
  • 26.
    DR – GEBGrid Services Local Facility Pattern Global Utility Pattern energy platform
  • 27.
    DR Opportunities Tobias Heye,MD • Roland Knoerl, MBA, B Eng • Thomas Wehrle, Dipl-Ing • Daniel Mangold • Alessandro Cerminara • Michael Loser, PhD • Martin Plumeyer, Dipl-Ing • Markus Degen, PhD • Rahel Lüthy, MSc • Dominique Brodbeck, PhD • Elmar Merkle, MD
  • 28.
  • 29.
    Grid-Interactive Efficient Buildings Mechanical Room Meter Panel T’Stat TRANSACTIVE energy ENX Platform ENX Intellectual Property Generation DER ENVIRONMENT COMPACT: Decarbonization ENERGY COMPACT: Grid-Interactive Efficient Buildings Virtual Energy Storage DER HVAC Equipment Ancillary Equipment Appliances INTEROPERABILITY INTEROPERABILITY FTM/BTM Integration ENX GEB Controller TRANSACTIVE data
  • 30.
  • 31.
  • 32.
    ISO/TSO IPP Model CentralizedDER Model Local Distribution Aggregator Model Fully Integrated Microgrid Model Diversity, Scale, Service Based Dynamic, multi revenue sources Asset Platforms Energy Service Platforms Network Orchestration Platforms HIGHLY CONNECTED AND NETWORKED ECOSYSTEMS enabling the complexity of a future grid
  • 33.
    energy platform Load Profiles Market Data Warehouse DERM- DMO ADMS Microgrid Aggregator G&T Aggregator Local/Distribution Aggregator RTO Aggregator Utility Based TE Consumer Based TE Market Based TE interoperable interconnections DERM/DMO model
  • 34.
    Utility Ecosystem Building– Network Orchestration Navigant reports “that every company uses one or more of four basic business models: asset builder, service provider, technology creator, and network orchestrator.” Among Fortune 500 companies, linear business model (asset builder, service provider, and technology creator) on average scale more slowly and are less profitable than the platform focused network orchestrator business models VALUE OF NETWORK ORCEHSTRATING
  • 35.
    Substation Local Utility Transmission Generation RTO Market Facilities LOADS Voltage TraditionalUtility Interconnections Line Loss Energy Demand PF Harmonics N1 Resiliency TOP DOWN – LINEAR PLANNING MODEL interconnections Overbuilt Infrastructure – Operational Deficiencies (Line Loss – Load Factor) interconnections interconnections interconnections interconnections interconnections
  • 36.
    Substation Local Utility Transmission Generation RTO Market Facilities LOADS GridOptimization – Decreased Line Loss – Increased Load Factory – DR Flexibility Voltage BOTTOM UP – NETWORKS OF NETWORKS PLANNING MODEL Smart Contracts – Utility Interconnections Line Loss Energy Demand PF Harmonics N1 Resiliency smart contract interconnections transactive energy smart contract interconnections transactive energy smart contract interconnections transactive energy smart contract interconnections transactive energy smart contract interconnections transactive energy smart contract interconnections transactive energy
  • 37.
    Smart Contracts –Blockchain Capabilities
  • 38.
    microgrid simulation -outcomes SMART LIGHTING SMART INDUSTRY WIND TRANSMISSION GENERATION SMART WATER SMART WASTE EV Grid/Component Layer SMART DISTRIBUTION Energy Platform $ $ - Qualified Scheduling Entity NG GENERATION Communication Layer Information Layer 01010101 Functional Layer Business/Monetization Layer $ $ $ 0 1 0 1 0 1 0 1 0 1 0 1 0 1 0 1 0 1 0 1 0 1 0 1 0 1 0 1 0 1 0 1 0 1 0 1 0 1 0 1 0 1 0 1 SOLAR BATTERY STORAGE SMART BUILDINGS SMART HOMES $ $ - Predictive Maintenance $ - Prescriptive Maintenance $ - Demand Response $ - Graph Algorithms $ - Machine Learning $ - Edge Computing $ - Machine Learning Copyright ©
  • 39.