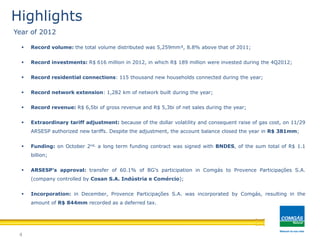
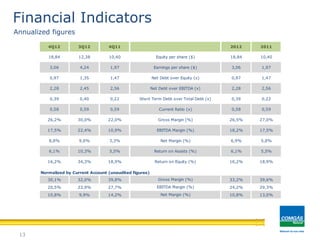
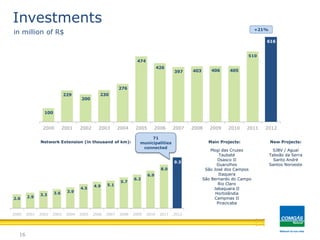
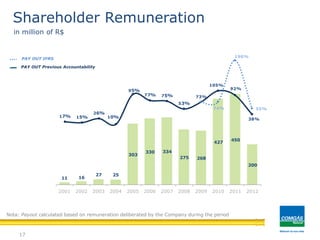
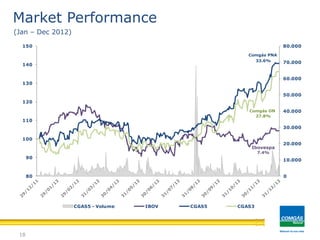
1
COMPANHIA DE GÁS DE SÃO PAULO
Financial and Operational Results
December 31st, 2012
Disclaimer
The statements contained in this report regarding the outlook on business,
estimations on financial and operational results and growth prospects for COMGÁS
are merely estimations and, as such, are based exclusively on management
expectations regarding future events and tendencies, that affect or may affect the
business. These estimations are subject to many risks and uncertainties and are
made considering the information currently available, and depend, substancially on
market conditions, the Brazilian economys performance, the business sector and
international markets, and are therefore subject to change without pior notice.
Because of these uncertainties, the investor should not make any investment
decisions based on these estimations and declarations on future operations.
Financial and Operational Results
4
Highlights
 Record volume: the total volume distributed was 5,259mm³, 8.8% above that of 2011;
 Record investments: R$ 616 million in 2012, in which R$ 189 million were invested during the 4Q2012;
 Record residential connections: 115 thousand new households connected during the year;
 Record network extension: 1,282 km of network built during the year;
 Record revenue: R$ 6,5bi of gross revenue and R$ 5,3bi of net sales during the year;
 Extraordinary tariff adjustment: because of the dollar volatility and consequent raise of gas cost, on 11/29
ARSESP authorized new tariffs. Despite the adjustment, the account balance closed the year in R$ 381mm;
 Funding: on October 2nd, a long term funding contract was signed with BNDES, of the sum total of R$ 1.1
billion;
 ARSESP’s approval: transfer of 60.1% of BG’s participation in Comgás to Provence Participações S.A.
(company controlled by Cosan S.A. Indústria e Comércio);
 Incorporation: in December, Provence Participações S.A. was incorporated by Comgás, resulting in the
amount of R$ 844mm recorded as a deferred tax.
Year of 2012
Fornecimento de Gás Natural: CONTRATOS
5
Daily quantity contracted:
approximately 14.3 millions of m³/day,
besides auction contracts.
Daily quantity demanded:
approximately 12.9 millions of m³.
Contracts
Natural Gas Supply
Contracts TCQ Firm Contract Firm of Energy Auction
Contract Models Firm Firm Firm of Energy Firm of Short Term
Gas Source Bolivian Undetermined Undetermined
Surplus of PB's contracts with other
distributors / thermal power plants
DQC
End of Contract Jun/19 Dec/13 Dec/12 Sep/13
Commodity +
Transportation
Fixed Charge +
Variable Charge
Fixed Charge +
Variable Charge
Transportation: annual
readjustment according to USA
Inflation: CPI
Fixed Charge: annual readjustment
by IGP-M
Fixed Charge: annual readjustment
by IGP-M
Commodity: quarterly correction
based on Oil Basket
+ Exchange Rate
Variable Charge: quarterly
correction based on Oil Basket
Variable Charge: quarterly
correction based on Oil Basket
Price
8.10 MMm3
/day for Aug/2012
forward
5.22 MMm3
/day for Aug/2012
forward
1.0 MMm³/day according to bids
According to the bid made by the
Auction Winner
2000 2001 2002 2003 2004 2005 2006 2007 2008 2009 2010 2011 2012
Industrial Segment: Sector
Composition
CAGR (00-12)
10.0%
1,676
2,243
2,952
3,418
3,812
4,342
4,761
5,069
4,261
5,253 5,259
4,8354,910
+8.8%
6
Volume
in million of m3
72,0%
6,8%
5,2%
3,8%
2,1%
10,0%
Industrial Cogeneration NGV Residential Commercial Thermal Generation
22.7%
19.0%
14.4%
12.3%
10.1%
7.6%
6.4%
3.4%
2.2%
1.0%
0.7%
0.2%
CHEMICAL / PETROCHEMICAL
CERAMICS
PAPER AND CELLULOSE
METALS / FOUNDRY AND NON
FERROUS
GLASS / CRYSTALS
DRINKS / FOOD
AUTOMOTIVE / PNEUMATIC
TEXTILE / LAUNDRY / DRY
CLEANING
OTHERS
STEEL SECTOR
PHARMACEUTICAL
ELECTRO / ELECTRONIC
Meters
7
Total per Segment
*UDA’s (Householders)
887.162 871.934 824.457 1,7% 7,6%
1.202.805 1.177.761 1.087.705 2,1% 10,6%
11.268 11.106 10.381 1,5% 8,5%
1.008 1.012 1.002 -0,4% 0,6%
2 2 2 0,0% 0,0%
25 23 23 8,7% 8,7%
324 329 357 -1,5% -9,2%
899.789 884.406 836.222 1,74% 7,60%
1.215.432 1.190.233 1.099.470 2,1% 10,5%
4Q12 4Q11
THERMAL GENERATION
INDUSTRIAL
3Q12 4Q12 x 4Q11
RESIDENTIAL
NUMBER OF UDA's*
COMMERCIAL
4Q12 x 3Q12
COGENERATION
AUTOMOTIVE
TOTAL METERS
TOTAL CUSTOMERS
8
Volume per Segment
in thousands of m3
*Excluding Thermal Generation
50,469 56,789 48,399 -11.1% 4.3% 198,872 183,028 8.7%
28,274 29,293 27,993 -3.5% 1.0% 111,662 108,272 3.1%
937,275 970,248 932,850 -3.4% 0.5% 3,788,744 3,850,930 -1.6%
89,344 92,440 87,553 -3.3% 2.0% 357,530 345,754 3.4%
66,759 70,081 75,799 -4.7% -11.9% 274,809 290,878 -5.5%
1,172,121 1,218,851 1,172,594 -3.8% 0.0% 4,731,617 4,778,862 -1.0%
12.7 13.2 12.7 12.9 13.1
256,790 75,356 10,479 240.8% 2350.5% 527,014 55,884 843.0%
1,428,911 1,294,207 1,183,073 10.4% 20.8% 5,258,631 4,834,746 8.8%
AUTOMOTIVE
4Q12 x 3Q12 4Q12 x 4Q11
COMMERCIAL
TOTAL
INDUSTRIAL
COGENERATION
4Q11
TOTAL
MMm³/day*
THERMAL GENERATION
4Q12 3Q12
RESIDENTIAL
2012 2011 2012 x 2011
72%
7%
5%
4%
2%
10%
56%
4%
3%
27%
9%
1%
9
Margin x Volume
Margin Volume
in IFRS
5.3 bi m³1.4 bi R$
72,0%
6,8%
5,2%
3,8%
2,1%
10,0%
Industrial Cogeneration NGV Residential Commercial Thermal Generation
107
177
347 330
549
668
860
925
1.035
838
928
1.107
962
1.363
1.182
716
1.170
2000 2001 2002 2003 2004 2005 2006 2007 2008 2009 2010 2011 2012
10
CAGR (00-12)
22.1%
EBTIDA
in million of R$
Normalized IFRS
Note: Calculation of CAGR using normalized results
45 64
108 103
242
319
427 443
514
368
413
487
367
690
580
236
523
2000 2001 2002 2003 2004 2005 2006 2007 2008 2009 2010 2011 2012
11
Net Income
in million of R$
CAGR (00-12)
22.7%
Normalized IFRS
Note: Calculation of CAGR using normalized results
12
Financial Performance
in thousand of R$
1.467.168 1.413.476 1.067.984 3,8% 37,4% 5.279.523 4.102.660 28,7%
-1.083.253 -990.012 -833.143 9,4% 30,0% -3.881.871 -2.996.617 29,5%
383.915 423.464 234.841 -9,3% 63,5% 1.397.652 1.106.043 26,4%
-124.929 -104.439 -117.250 19,6% 6,5% -426.442 -387.744 10,0%
-1.520 -2.217 -1.496 -31,4% 1,6% -9.450 -2.015 369,0%
257.466 316.808 116.095 -18,7% 121,8% 961.760 716.284 34,3%
-73.438 -77.293 -63.437 -5,0% 15,8% -290.008 -240.595 20,5%
-28.957 -47.312 -19.234 -38,8% 50,6% -163.650 -159.960 2,3%
155.071 192.203 33.424 -19,3% 364,0% 508.102 315.729 60,9%
129.280 127.087 35.155 1,7% 267,7% 366.655 236.139 55,3%
Normalized by Current Account (unaudited figures)
18.757 2.486 155.205 654,5% -87,9% 230.528 380.025 -39,3%
269.935 312.348 270.455 -13,6% -0,2% 1.169.892 1.107.120 5,7%
142.598 129.670 138.529 10,0% 2,9% 522.561 490.712 6,5%
4Q12
EBITDA
4Q12 x 3Q12
OPERATIONAL RESULT
NET SALES
Cost of Assets and / or Services Rendered
Expenditures with Sales, General and Adm.
GROSS MARGIN
Depreciation and Amortization
3Q12 4Q11
Financial Results
Other Operational Results
NET INCOME
NET INCOME
CURRENT ACCOUNT
EBITDA
4Q12 x 4Q11 2012 x 20112012 2011
13
Financial Indicators
Annualized figures
18,84 12,38 10,40 18,84 10,40
3,06 4,24 1,97 3,06 1,97
0,97 1,35 1,47 0,97 1,47
2,28 2,45 2,56 2,28 2,56
0,39 0,40 0,22 0,39 0,22
0,58 0,59 0,59 0,58 0,59
26,2% 30,0% 22,0% 26,5% 27,0%
17,5% 22,4% 10,9% 18,2% 17,5%
8,8% 9,0% 3,3% 6,9% 5,8%
6,1% 10,3% 5,5% 6,1% 5,5%
16,2% 34,3% 18,9% 16,2% 18,9%
Normalized by Current Account (unaudited figures)
30,1% 32,0% 39,8% 33,2% 39,6%
20,5% 23,9% 27,7% 24,2% 29,3%
10,8% 9,9% 14,2% 10,8% 13,0%
4Q12 3Q12 4Q11
Return on Assets (%)
Return on Equity (%)
Gross Margin (%)
Net Debt over Equity (x)
Net Debt over EBITDA (x)
Short Term Debt over Total Debt (x)
Current Ratio (x)
Gross Margin (%)
Net Margin (%)
EBITDA Margin (%)
2012 2011
Equity per share ($)
Earnings per share ($)
EBITDA Margin (%)
Net Margin (%)
14
Current Account
in million of R$
528
469
264
153
29
12
-55
-157
-230
-198
-128
-5
150
204
360 362
381
dec.08 mar.09 jun.09 sep.09 dec.09 mar.10 jun.10 sep.10 dec.10 mar.11 jun.11 sep.11 dec.11 mar-12 jun.12 sep.12 dec.12
EIB
24%
BNDES
46%
Others
30%
Long
Term
61%
Short
Term
39%
638
277
135 170 114 164
287
52
85 91 184
163
2013 2014 2015 2016 2017 2018
forward
Local Currency Foreign Currency
Estrutura de Endividamento
329
220
261
298 327
925
Debt Structure
in million of R$
Debt Amortization Schedule (R$ mm) Debt Composition - 2012
Debt 2012 2011 2012 x 2011
Short Term Debt 925.305 421.104 120%
Long Term Debt 1.435.120 1.452.956 -1%
Total Debt 2.360.425 1.874.060 26%
(-) Cash 169.725 41.110 313%
(=) Net Debt 2.190.700 1.832.950 20%
EBITDA 961.760 716.284 34%
Net Debt / EBITDA 2,28 2,56 -11%
Short Term Debt / Total Debt 0,39 0,22 74%
2.6 2.9
3.3 3.6 3.9
4.5
4.9 5.1
5.7
6.2
6.9
8.0
9.3
2000 2001 2002 2003 2004 2005 2006 2007 2008 2009 2010 2011 2012
100
229
200
230
276
474
426
397 403 406 405
510
616
2000 2001 2002 2003 2004 2005 2006 2007 2008 2009 2010 2011 2012
Investimentos
Main Projects:Network Extension (in thousand of km):
Mogi das Cruzes
Taubaté
Osasco II
Guarulhos
São José dos Campos
Itaquera
São Bernardo do Campo
Rio Claro
Jabaquara II
Hortolândia
Campinas II
Piracicaba
New Projects:
SJBV / Aguaí
Taboão da Serra
Santo André
Santos Noroeste
16
71
municipalities
connected
Investments
in million of R$ +21%
17
PAY OUT Previous Accountability
PAY OUT IFRS
Shareholder Remuneration
in million of R$
Nota: Payout calculated based on remuneration deliberated by the Company during the period
11 16
27 25
303
330 334
275 268
427
450
200
2001 2002 2003 2004 2005 2006 2007 2008 2009 2010 2011 2012
17% 15%
26%
10%
95%
77% 75%
53%
73%
105%
92%
38%
74%
190%
55%
0
10.000
20.000
30.000
40.000
50.000
60.000
70.000
80.000
80
90
100
110
120
130
140
150
CGAS5 - Volume IBOV CGAS5 CGAS3
Ibovespa
7.4%
Comgás PNA
33.6%
Comgás ON
27.8%
18
Market Performance
(Jan – Dec 2012)
INVESTOR RELATIONS
investidores@comgas.com.br
www.comgas.com.br/en/investors
ROBERTO LAGE
CFO and
IRO
PAULO POLEZI
Treasury and
Investor Relations
ANDRÉ SALGUEIRO
Investor Relations
Rua Olimpíadas, nº 205, 10º floor - Vila Olímpia - CEP 04551-000 / São Paulo - SP - Brazil
19

Results presentation 4 q12

  • 1.
    1 COMPANHIA DE GÁSDE SÃO PAULO Financial and Operational Results December 31st, 2012
  • 2.
    Disclaimer The statements containedin this report regarding the outlook on business, estimations on financial and operational results and growth prospects for COMGÁS are merely estimations and, as such, are based exclusively on management expectations regarding future events and tendencies, that affect or may affect the business. These estimations are subject to many risks and uncertainties and are made considering the information currently available, and depend, substancially on market conditions, the Brazilian economys performance, the business sector and international markets, and are therefore subject to change without pior notice. Because of these uncertainties, the investor should not make any investment decisions based on these estimations and declarations on future operations.
  • 3.
  • 4.
    4 Highlights  Record volume:the total volume distributed was 5,259mm³, 8.8% above that of 2011;  Record investments: R$ 616 million in 2012, in which R$ 189 million were invested during the 4Q2012;  Record residential connections: 115 thousand new households connected during the year;  Record network extension: 1,282 km of network built during the year;  Record revenue: R$ 6,5bi of gross revenue and R$ 5,3bi of net sales during the year;  Extraordinary tariff adjustment: because of the dollar volatility and consequent raise of gas cost, on 11/29 ARSESP authorized new tariffs. Despite the adjustment, the account balance closed the year in R$ 381mm;  Funding: on October 2nd, a long term funding contract was signed with BNDES, of the sum total of R$ 1.1 billion;  ARSESP’s approval: transfer of 60.1% of BG’s participation in Comgás to Provence Participações S.A. (company controlled by Cosan S.A. Indústria e Comércio);  Incorporation: in December, Provence Participações S.A. was incorporated by Comgás, resulting in the amount of R$ 844mm recorded as a deferred tax. Year of 2012
  • 5.
    Fornecimento de GásNatural: CONTRATOS 5 Daily quantity contracted: approximately 14.3 millions of m³/day, besides auction contracts. Daily quantity demanded: approximately 12.9 millions of m³. Contracts Natural Gas Supply Contracts TCQ Firm Contract Firm of Energy Auction Contract Models Firm Firm Firm of Energy Firm of Short Term Gas Source Bolivian Undetermined Undetermined Surplus of PB's contracts with other distributors / thermal power plants DQC End of Contract Jun/19 Dec/13 Dec/12 Sep/13 Commodity + Transportation Fixed Charge + Variable Charge Fixed Charge + Variable Charge Transportation: annual readjustment according to USA Inflation: CPI Fixed Charge: annual readjustment by IGP-M Fixed Charge: annual readjustment by IGP-M Commodity: quarterly correction based on Oil Basket + Exchange Rate Variable Charge: quarterly correction based on Oil Basket Variable Charge: quarterly correction based on Oil Basket Price 8.10 MMm3 /day for Aug/2012 forward 5.22 MMm3 /day for Aug/2012 forward 1.0 MMm³/day according to bids According to the bid made by the Auction Winner
  • 6.
    2000 2001 20022003 2004 2005 2006 2007 2008 2009 2010 2011 2012 Industrial Segment: Sector Composition CAGR (00-12) 10.0% 1,676 2,243 2,952 3,418 3,812 4,342 4,761 5,069 4,261 5,253 5,259 4,8354,910 +8.8% 6 Volume in million of m3 72,0% 6,8% 5,2% 3,8% 2,1% 10,0% Industrial Cogeneration NGV Residential Commercial Thermal Generation 22.7% 19.0% 14.4% 12.3% 10.1% 7.6% 6.4% 3.4% 2.2% 1.0% 0.7% 0.2% CHEMICAL / PETROCHEMICAL CERAMICS PAPER AND CELLULOSE METALS / FOUNDRY AND NON FERROUS GLASS / CRYSTALS DRINKS / FOOD AUTOMOTIVE / PNEUMATIC TEXTILE / LAUNDRY / DRY CLEANING OTHERS STEEL SECTOR PHARMACEUTICAL ELECTRO / ELECTRONIC
  • 7.
    Meters 7 Total per Segment *UDA’s(Householders) 887.162 871.934 824.457 1,7% 7,6% 1.202.805 1.177.761 1.087.705 2,1% 10,6% 11.268 11.106 10.381 1,5% 8,5% 1.008 1.012 1.002 -0,4% 0,6% 2 2 2 0,0% 0,0% 25 23 23 8,7% 8,7% 324 329 357 -1,5% -9,2% 899.789 884.406 836.222 1,74% 7,60% 1.215.432 1.190.233 1.099.470 2,1% 10,5% 4Q12 4Q11 THERMAL GENERATION INDUSTRIAL 3Q12 4Q12 x 4Q11 RESIDENTIAL NUMBER OF UDA's* COMMERCIAL 4Q12 x 3Q12 COGENERATION AUTOMOTIVE TOTAL METERS TOTAL CUSTOMERS
  • 8.
    8 Volume per Segment inthousands of m3 *Excluding Thermal Generation 50,469 56,789 48,399 -11.1% 4.3% 198,872 183,028 8.7% 28,274 29,293 27,993 -3.5% 1.0% 111,662 108,272 3.1% 937,275 970,248 932,850 -3.4% 0.5% 3,788,744 3,850,930 -1.6% 89,344 92,440 87,553 -3.3% 2.0% 357,530 345,754 3.4% 66,759 70,081 75,799 -4.7% -11.9% 274,809 290,878 -5.5% 1,172,121 1,218,851 1,172,594 -3.8% 0.0% 4,731,617 4,778,862 -1.0% 12.7 13.2 12.7 12.9 13.1 256,790 75,356 10,479 240.8% 2350.5% 527,014 55,884 843.0% 1,428,911 1,294,207 1,183,073 10.4% 20.8% 5,258,631 4,834,746 8.8% AUTOMOTIVE 4Q12 x 3Q12 4Q12 x 4Q11 COMMERCIAL TOTAL INDUSTRIAL COGENERATION 4Q11 TOTAL MMm³/day* THERMAL GENERATION 4Q12 3Q12 RESIDENTIAL 2012 2011 2012 x 2011
  • 9.
    72% 7% 5% 4% 2% 10% 56% 4% 3% 27% 9% 1% 9 Margin x Volume MarginVolume in IFRS 5.3 bi m³1.4 bi R$ 72,0% 6,8% 5,2% 3,8% 2,1% 10,0% Industrial Cogeneration NGV Residential Commercial Thermal Generation
  • 10.
    107 177 347 330 549 668 860 925 1.035 838 928 1.107 962 1.363 1.182 716 1.170 2000 20012002 2003 2004 2005 2006 2007 2008 2009 2010 2011 2012 10 CAGR (00-12) 22.1% EBTIDA in million of R$ Normalized IFRS Note: Calculation of CAGR using normalized results
  • 11.
    45 64 108 103 242 319 427443 514 368 413 487 367 690 580 236 523 2000 2001 2002 2003 2004 2005 2006 2007 2008 2009 2010 2011 2012 11 Net Income in million of R$ CAGR (00-12) 22.7% Normalized IFRS Note: Calculation of CAGR using normalized results
  • 12.
    12 Financial Performance in thousandof R$ 1.467.168 1.413.476 1.067.984 3,8% 37,4% 5.279.523 4.102.660 28,7% -1.083.253 -990.012 -833.143 9,4% 30,0% -3.881.871 -2.996.617 29,5% 383.915 423.464 234.841 -9,3% 63,5% 1.397.652 1.106.043 26,4% -124.929 -104.439 -117.250 19,6% 6,5% -426.442 -387.744 10,0% -1.520 -2.217 -1.496 -31,4% 1,6% -9.450 -2.015 369,0% 257.466 316.808 116.095 -18,7% 121,8% 961.760 716.284 34,3% -73.438 -77.293 -63.437 -5,0% 15,8% -290.008 -240.595 20,5% -28.957 -47.312 -19.234 -38,8% 50,6% -163.650 -159.960 2,3% 155.071 192.203 33.424 -19,3% 364,0% 508.102 315.729 60,9% 129.280 127.087 35.155 1,7% 267,7% 366.655 236.139 55,3% Normalized by Current Account (unaudited figures) 18.757 2.486 155.205 654,5% -87,9% 230.528 380.025 -39,3% 269.935 312.348 270.455 -13,6% -0,2% 1.169.892 1.107.120 5,7% 142.598 129.670 138.529 10,0% 2,9% 522.561 490.712 6,5% 4Q12 EBITDA 4Q12 x 3Q12 OPERATIONAL RESULT NET SALES Cost of Assets and / or Services Rendered Expenditures with Sales, General and Adm. GROSS MARGIN Depreciation and Amortization 3Q12 4Q11 Financial Results Other Operational Results NET INCOME NET INCOME CURRENT ACCOUNT EBITDA 4Q12 x 4Q11 2012 x 20112012 2011
  • 13.
    13 Financial Indicators Annualized figures 18,8412,38 10,40 18,84 10,40 3,06 4,24 1,97 3,06 1,97 0,97 1,35 1,47 0,97 1,47 2,28 2,45 2,56 2,28 2,56 0,39 0,40 0,22 0,39 0,22 0,58 0,59 0,59 0,58 0,59 26,2% 30,0% 22,0% 26,5% 27,0% 17,5% 22,4% 10,9% 18,2% 17,5% 8,8% 9,0% 3,3% 6,9% 5,8% 6,1% 10,3% 5,5% 6,1% 5,5% 16,2% 34,3% 18,9% 16,2% 18,9% Normalized by Current Account (unaudited figures) 30,1% 32,0% 39,8% 33,2% 39,6% 20,5% 23,9% 27,7% 24,2% 29,3% 10,8% 9,9% 14,2% 10,8% 13,0% 4Q12 3Q12 4Q11 Return on Assets (%) Return on Equity (%) Gross Margin (%) Net Debt over Equity (x) Net Debt over EBITDA (x) Short Term Debt over Total Debt (x) Current Ratio (x) Gross Margin (%) Net Margin (%) EBITDA Margin (%) 2012 2011 Equity per share ($) Earnings per share ($) EBITDA Margin (%) Net Margin (%)
  • 14.
    14 Current Account in millionof R$ 528 469 264 153 29 12 -55 -157 -230 -198 -128 -5 150 204 360 362 381 dec.08 mar.09 jun.09 sep.09 dec.09 mar.10 jun.10 sep.10 dec.10 mar.11 jun.11 sep.11 dec.11 mar-12 jun.12 sep.12 dec.12
  • 15.
    EIB 24% BNDES 46% Others 30% Long Term 61% Short Term 39% 638 277 135 170 114164 287 52 85 91 184 163 2013 2014 2015 2016 2017 2018 forward Local Currency Foreign Currency Estrutura de Endividamento 329 220 261 298 327 925 Debt Structure in million of R$ Debt Amortization Schedule (R$ mm) Debt Composition - 2012 Debt 2012 2011 2012 x 2011 Short Term Debt 925.305 421.104 120% Long Term Debt 1.435.120 1.452.956 -1% Total Debt 2.360.425 1.874.060 26% (-) Cash 169.725 41.110 313% (=) Net Debt 2.190.700 1.832.950 20% EBITDA 961.760 716.284 34% Net Debt / EBITDA 2,28 2,56 -11% Short Term Debt / Total Debt 0,39 0,22 74%
  • 16.
    2.6 2.9 3.3 3.63.9 4.5 4.9 5.1 5.7 6.2 6.9 8.0 9.3 2000 2001 2002 2003 2004 2005 2006 2007 2008 2009 2010 2011 2012 100 229 200 230 276 474 426 397 403 406 405 510 616 2000 2001 2002 2003 2004 2005 2006 2007 2008 2009 2010 2011 2012 Investimentos Main Projects:Network Extension (in thousand of km): Mogi das Cruzes Taubaté Osasco II Guarulhos São José dos Campos Itaquera São Bernardo do Campo Rio Claro Jabaquara II Hortolândia Campinas II Piracicaba New Projects: SJBV / Aguaí Taboão da Serra Santo André Santos Noroeste 16 71 municipalities connected Investments in million of R$ +21%
  • 17.
    17 PAY OUT PreviousAccountability PAY OUT IFRS Shareholder Remuneration in million of R$ Nota: Payout calculated based on remuneration deliberated by the Company during the period 11 16 27 25 303 330 334 275 268 427 450 200 2001 2002 2003 2004 2005 2006 2007 2008 2009 2010 2011 2012 17% 15% 26% 10% 95% 77% 75% 53% 73% 105% 92% 38% 74% 190% 55%
  • 18.
    0 10.000 20.000 30.000 40.000 50.000 60.000 70.000 80.000 80 90 100 110 120 130 140 150 CGAS5 - VolumeIBOV CGAS5 CGAS3 Ibovespa 7.4% Comgás PNA 33.6% Comgás ON 27.8% 18 Market Performance (Jan – Dec 2012)
  • 19.
    INVESTOR RELATIONS investidores@comgas.com.br www.comgas.com.br/en/investors ROBERTO LAGE CFOand IRO PAULO POLEZI Treasury and Investor Relations ANDRÉ SALGUEIRO Investor Relations Rua Olimpíadas, nº 205, 10º floor - Vila Olímpia - CEP 04551-000 / São Paulo - SP - Brazil 19