The document describes optimizing quantitative PCR (qPCR) to detect levels of the PPO gene in apples and tobacco plants. Temperature gradients were run to determine the optimal annealing temperatures for PPO, ACTIN, GAPDH, and EF primers. PPO and ACTIN were optimized at 54.7°C, while GAPDH and EF were optimized at lower temperatures. Serial dilutions showed that higher DNA concentrations resulted in lower Ct values, confirming qPCR is quantitative. EF proved the most reliable control based on consistent Ct increases across dilutions. The optimized qPCR can now be used to examine how wounding impacts PPO levels in apples and tobacco.
1. Optimization of qPCR for Detection of the PPO Gene
Introduction: Polymerase Chain Reaction, or PCR, allows for the cloning of a portion of a DNA
sequence. It involves three steps that allow for this to occur. The first of these three steps are
denaturation, which splits double stranded DNA into single stranded DNA. This is done with a
substantial amount of heat that is hot enough to cause the double strands to split into single
strands. Second is the annealing step, which is when the forward primer binds to the single
strand DNA going from 5’ to 3’, and the reverse primer binds to the strand going 3’ to 5’. The
forward primer attaches to the strand of DNA that runs from 5’ to 3’ and the reverse primer
attaches to the 3’ to 5’ strand. The third step is the extension step where each primer copies
the DNA and creates replicates for that section. After this step occurs there are now two
identical double stranded pieces of DNA.
Quantitative Polymerase Chain Reaction, or qPCR, is a PCR method that quantitatively
allows for the determination of the starting amount of DNA. QPCR uses a fluorescent dye that
attaches to double stranded DNA and can be detected by a fluorescence reader in the
instrument. In order to optimize qPCR there are two tests that must be performed. The first is
to find the ideal temperature of each primer by running a temperature gradient. Next, it must
be proven that the starting amount of DNA alters the ending amount of DNA by running serial
dilutions. A temperature gradient and serial dilutions were performed in order to examine the
optimal conditions under which to perform qPCR with the following primers: PPO, Actin,
glyceraldehydes 3-phosphate dehydrogenase (GAPDH), and Elongation Factor 1α (EF).
PPO is a gene that causes the browning of apples and can act as a plant defense
mechanism. Arctic apples are apples that do not brown due genetic modification that stops the
oxidation reaction of PPO from occurring. After optimizing the qPCR with the primers the future
goal is to examine how wounding apples and tobacco plants impacts PPO levels. In order to test
how PPO levels change a non-bruised and bruised DNA sample is taken from the apples. In the
tobacco plants DNA is extracted from a control sample, a sample bruised with tweezers, and
another covered in salicylic acid. In order to examine how PPO levels change in apples and
tobacco first the primers and qPCR must be optimized with the temperature gradient and serial
dilutions.
Procedure: DNA samples were extracted from two different materials. The first material DNA
was extracted from was the seed of an apple for testing with PPO and Actin. The seed contains
high levels of DNA and would provide the largest concentrations of DNA. In addition, tobacco
samples were taken from the leaves of the nicotiana benthamiana species. This DNA sample
was used for testing the qPCR primers GAPDH and EF.
2. In order to run qPCR in the CFX96 Bio-Rad qPCR instrument a master mix based off of the Sso
Fast Evagreen Supermix guide from Bio-Rad was designed. It consisted of of Sso Fast Evagreen
super mix, forward and reverse primers, DEPC treated water, and the DNA sample. The
Evagreen acted as the dye used in the qPCR reactions to detect DNA. The master mix created by
Bio-Rad was designed for a 20 µl reaction which was modified to a 10 µl reaction. In order to
run more than one reaction the volumes can be multiplied by the necessary amount and the
ratios kept the same.
Componet Volume
Sso Fast Evagreen Supermix 5 µl
Forward Primer 0.5 µl
Reverse Primer 0.5 µl
DEPC treated water 3.75 µl
DNA template 0.25 µl
After preparing the master mix it should be vortexed or mixed by inversion to ensure complete
mixing.
The qPCR protocol used was also based on the Sso Fast Evagreen Supermix guide
provided by Bio-Rad and performed with the CFX96 Bio-Rad instrument. The annealing and
extension temperature were determined by running the temperature gradient. The
denaturation, annealing, and extension were repeated for 39 more cycles.
Step Name Temperature and time
Enzyme Activation 95 °C for 2 minutes
Denaturation 95 °C for 5 seconds
Anneal/Extension 5 seconds
Melt Curve 50 °C to 65 °C
Primers: The forward and reverse PPO primers were designed to match those presented by
Mario Di Guardo in the paper “A Multidisciplinary Approach Providing New Insight into Fruit
Flesh Browning Physiology in Apple.” The forward primer was CCTACTCACAAAGCCCAAGC,and
the reverse primer was CCTCCAAGACCAAGAAGCAC.
CCTACTCACAAAGCCCAAGCGTTCCTTGGGACGTGAGGTCTCATGCAACGCCACAAACAATGACCAATT
TGATCAAGCACAGTCCAAACTAGACAGGAGAAATGTGCTTCTTGGICTIGGAGG
3. The ACTIN primers were also designed to replicate Guardo’s research. The forward primer was
TGACCGAATGAGCAAGGAAATTACT, and the reverse primer used was TACTCAGCTTTGGCA
ATCCACATC.
TGACCGAATGAGCAAGGAAATTACTGCATTGGCCCCAAGCAGCATGAAGATCAAGGTGGTTGCCCCAC
CAGAGAGAAAGTACAGTGTCTGGATCGGAGGCTCCATCTTAGCTTCCCTCAGTACATTCCAGCAGATGT
GGATTGCCAAAGCTGAGTA
The GAPDH primers were derived from Li Fangfang’s research article “Suprression of RNA
Silencing by a Plant DNA Viurs Satellite Requires a Host Calmodulin-Like Protein to Repress
RDR6 Expression.” The primers from the article were modified using Nicotiana Benthamiana
sequence found on the National Center for Biotechnology Information’s website. The primer
sequences used were GCACYACCAACTGCCTTGC-for and GATGGACCATCAACAGTCTTCTGG-rev.
GCACTACCAACTGCCTTGCACCTTTGGCTAAGGTCATCAATGATAGGTTTGGCATTGTGGAGGGTCTCAT
GACAACTGTCCACTCCCTCACTGCCACCCAGAAGACTGTTGATGGTCCATC
The primers used for EF were based off of those presented by Gregor W. Schmidt in the paper,
“Stable internal reference genes for normalization of real-time RT-PCR in tobacco (Nicotiana
tabacum) during development and abiotic stress.” The sequences were modified to match the
Nicotiana Benthamiana sequence found on the NCBI website. The forward primer was
AACCTTGACTGGTACAAGGG, and the reverse primer was TTGTCTGAGGGCCTCTTG.
AACCTTGACTGGTACAAGGGCCCAACCCTTCTTGAGGCTCTTGACCAGATTAATGAGCCCAAGAGGCCC
TCAGACAA
Temperature Optimization Protocol: The goal of temperature optimization was to find the
temperature with the lowest C(t) value. The C(t) value is the number of cycles needed until the
amount of fluorescence detected reaches a value assigned by the qPCR instrument. Since the
dyes bind to DNA the more fluorescence detected by the reader the more DNA was present.
The temperature with the lowest C(t) value reached the assigned amount of fluorescence first
and at the end would have the most replicated DNA.
In order to find the optimal temperature qPCR was performed with a temperature
gradient during the annealing and extension step on 8 identical samples. Enough master mix
was prepared for 9 reactions in order to ensure ample amounts of master mix and uniform
composition throughout the 8 samples. The reactions were placed in a 96 well plate with a clear
film or flat qPCR lid to prevent any liquid from escaping. The gradient was run above and below
the melting point in order to test a wide range of values and discover the optimal temperature.
4. Temperature Optimization of PPO: The temperature gradient was run using a CFX96 Bio-Rad
qPCR instrument. A temperature gradient was run with a range of 12°C from 50-62°C and the
optimal temperature was found to be 50.8°C with a C(t) value 24.59. The next best optimal
temperatures were found to be 52.4 °C and 54.7 °C with C(t) values of 24.68 and 24.96
respectively. The qPCR machine did not record a C(t) value for 50.0 °C The melting point of the
forward primer was 56.1 °C and the melting point of the reverse was 55.8 °C. Above these
temperatures the C(t) value appears to begin to increase exponentially.
Temperature Optimization of ACTIN: The ACTIN primers were one of the three primers tested
to act as a viable control to compare against PPO. Temperature optimization of ACTIN was run
side by side with the PPO primers. The optimized temperature of the ACTIN primers in the
apple sample was 54.7 °C which had a C(t) value of 23.66. The second smallest C(t) value was
23.82 obtained at 57.6 °C and the third smallest was 23.9 at 52.4 °C. The melting point of the
forward ACTIN primer was 56.6 °C and the reverse was 57.4 °C. The graph of the C(t) vs
temperature appears to be the beginning of a parabola, where if the gradient temperature was
below 51 °C or 61 °C the C(t) value began to rise sharply.
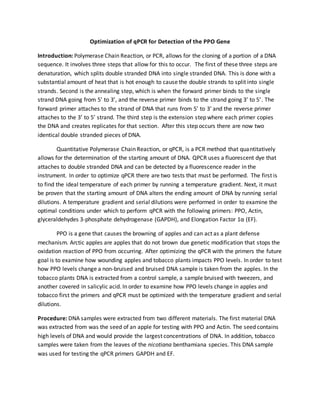
Temperature Optimization of GAPDH: In, addition to the ACTIN primers, GAPDH and EF were
tested to act as controls in determining the amount of PPO present. The temperature gradient
for GAPDH was run from 50 °C to 60 °C, and the optimal temperature for qPCR was 50.7 °C with
a C(t) value of 24.34. The second optimal temperature was 52 °C which had a C(t) value of 24.34
and 50 °C which had a C(t) of 24.71. The melting point of the forward GAPDH was 58.5 °C and
the reverse primer’s melting point was 57.4 °C. Below the optimal temperature appears to be
the beginning of half a parabola, with the other half being relatively clear above 50.7 °C.
Temperature Optimization of EF: The optimal temperature of the Elongation Factor 1α primer
appears to be approximately 56.3 °C which had a C(t) value of 25.17. Similar to GAPDH it was
run in a temperature gradient of 10 °C from 50 °C to 60 °C. The second smallest C(t) value was
25.42 at temperature 53.9 °C and the third smallest 25.49 at 52.0 °C. The melting point of the
EF forward primer is 54.5 °C, and the melting point of the reverse is 54.3 °C. The optimal
temperature of EF was above the forward and reverse primers’ respective melting points.
6. 20
22
24
26
28
30
32
48 50 52 54 56 58 60 62
C(t)
Temperature (°C)
GAPDH Temperature Optimization
25
25.5
26
26.5
27
27.5
28
48 50 52 54 56 58 60 62
C(t)
Temperature (°C)
EF Temperature Optimization
7. Temperature Optimization Results and Discussions: The temperature proved to play an
important role in the speed and amount of DNA that was able to be replicated. If the
temperature was far enough below the melting point the primer would anneal but not
complete the extension step. When the annealing and extension temperature was above the
optimal value the primer would begin to stop annealing. In both cases the amplification of DNA
is stopped due to too large a temperature difference. The temperature gradient helped to
discover the optimal temperature to run PPO in conjunction with one of the other three tested
control genes.
These temperature gradient experiments allowed for the formulation of the ideal
temperature to run PPO in qPCR with one of the control genes. For PPO and ACTIN the ideal
temperature to use is 54.7 °C. This was the temperature that Actin was optimized at and the
results for PPO at this temperature were similar to the optimized temperature. The difference
in C(t) values from 54.7 °C and the optimized temperature for PPO was 0.37.
If the GAPDH from tobacco were use in comparison with PPO the optimal temperatures
for qPCR should be 50.7 or 50.8 °C. The optimal temperature of PPO was 50.8 °C and GAPDH
was 50.7 °C, so the difference between the optimal temperatures was only 0.1 °C. This
difference is so small that setting the annealing and extension step to either temperature will
not make a noticeable difference.
The third control primer that was tested was EF. The optimal temperature for qPCR with
PPO and EF is in the range of 52.0 °C to 52.4 °C. This range did not produce the lowest C(t) value
for either primer, but the optimal temperature of EF causes about a cycle shift in PPO which can
be avoided by using the range of 52.0 °C to 52.4 °C. The difference in C(t) between the optimal
temperature of PPO and 52.4 °C is 0.09, which is a much smaller shift than using the optimal
temperature of EF. In addition, the difference in C(t) between the optimized temperature of EF
and 52.0 °C is 0.32. Compare this to the difference between using the optimal temperature of
PPO and there is a 1.02 cycle difference between the two optimal temperatures for EF. The
difference is much smaller using the range of 52.0-52.4 °C than using either optimal
temperature.
Serial Dilution Procedure: The main goal of the serial dilution runs performed were to prove
that qPCR is quantitative, so this means that starting with greater amounts of DNA allows for
more to be replicated creating lower C(t) values. The following procedure was protocol was
used to run serial dilutions and see how differing amounts of starting DNA affected the C(t)
value.
1. Place 9 µl of DEPC treated water in PCR tubes
2. Place 1 µl of DNA in well 1 and thoroughly mix by stirring
3. Transfer 1 µl of sample from well 1 to well 2 and thoroughly mix well 2
4. Transfer 1 µl of sample from well 2 to well 3 and thoroughly mix well 3
8. 5. Continue this pattern until DNA is in all desired wells
6. Prepare the mastermix using
Componet 9 reactions
Sso Fast Evagreen Mix 45 µl
Forward Primer 4.5 µl
Reverse Primer 4.5 µl
DEPC treated water 33.75 µl
7. Place 9.75 µl of mastermix in fresh PCR tubes
8. Transfer 0.25 µl of DNA from well 1 of the serial dilutions to well 1 with master mix, and
repeat for each well.
9. Run qPCR using protocol from the temperature gradient protocol along with each
primer’s optimized temperature.
Serial Dilution Results: The concentration of DNA was found to have an impact on the C(t)
value recorded with the PPO primers. The more the DNA was diluted with DEPC treated water
the C(t) value appeared to increase. Similar results were seen in the 3 control primers, but EF
would display the most consistent increase in C(t). In the serial dilution trials for Actin very few
C(t) values were able to be recorded by the qPCR instrument. As a result it would not act as a
viable control with such little data to accurately compare with PPO. GAPDH’s C(t) values in the
serial dilution runs was inconsistent. In the graph of C(t) vs –log[Dilution] there was no data for
the fourth serial dilution and the fifth had the greatest C(t) value on the graph. This type
inconsistency kept GAPDH from working as the ideal control primer.
From the three control primers that were tested EF proved to be the most stable control.
Comparing GAPDH and EF, EF had the larger R2 of 0.8903 vs GAPDH’s 0.8222. From this EF
demonstrated the more linear relationship allowing for better quantification of DNA in later
stages. In the graph below EF is lacking a C(t) value in the 7th dilution, and this is more
acceptable than in GAPDH because it is near the most dilute sample of DNA.
10. Results and Discussion: The temperature gradient and serial dilution experiments allowed for
the optimization of four different primers used in qPCR. The ideal temperature for PPO is
50.8 °C. From there the optimized temperatures of the other primers could be compared to
PPO in order to find the optimal temperature to perform qPCR. The serial dilution results
y = 1.612x + 28.056
R² = 0.8222
0.00
5.00
10.00
15.00
20.00
25.00
30.00
35.00
40.00
45.00
0 1 2 3 4 5 6 7 8 9
C(t)
-log[Dilution]
GAPDH Serial Dilutions
y = 1.0269x + 30.397
R² = 0.8903
15.00
20.00
25.00
30.00
35.00
40.00
0 1 2 3 4 5 6 7 8 9
C(t)
-log([C(t))]
EF Serial Dilution
11. showed that the best control primer to use in comparison with PPO was EF. This means that in
future qPCR experiments using the primers PPO and EF the optimal temperature would be
approximately 52.0-52.4 °C. In future experimentation a temperature gradient should be
performed along with serial dilutions in order to test how different temperatures affect the C(t)
while diluting
In the serial dilution data EF displayed the most linear graph and the missing C(t) value
was more acceptable at the end than the beginning or middle. This inconsistency in EF was
most likely due to the miniscule amount of DNA being pipetted from the serial dilution. In the
future a master mix should be created that allows for more DNA to be placed in the master mix
than 0.25 µl. In this small amount a tiny amount of error will create very large changes in the
results. However, this would create problems in that the amount of primer or dye used would
need to be reduced to keep the 10 µl reactions consistent. Decreasing the amount of primer
used would cause there to be less replication of DNA, and decreasing the dye used would lower
the quantity of DNA that could be detected by the qPCR instrument.
Conclusion: PCR is effective in replicating DNA, but the downside is that it is unable to detect
the quantity of DNA during amplification. This is the advantage of qPCR, it allows for the
quantification of DNA in a sample. In order to optimize the primers were tested in temperature
gradients and serial dilutions. The temperature gradient allowed for the discovery of the
optimal temperature of each primer, and the serial dilution demonstrated which primers would
be the easiest to quantify. In the end it was found that EF would act as the best control in
detecting levels of PPO in apples and tobacco in future experiments.
References:
Guardo, M. (2013) A MultidisciplinaryApproachProvidingNewInsightintoFruitFleshBrowning
PhysiologyinApple (Malusx domesticaBorkh.),PLoSOne.8(10).
Schmidt,G. (2010) Stable internal reference genesfornormalizationof real-timeRT-PCRintobacco
(Nicotianatabacum) duringdevelopmentand abioticstress,Mol GenetGenomics.283,233-241.