Downloaded 14 times
![Civil and Environmental Research www.iiste.org
ISSN 2222-1719 (Paper) ISSN 2222-2863 (Online)
Vol 2, No.2, 2012
1
ε ij = (ui ,j + uj .i ) (3)
2
Where: ε ij is the strain[1-3].
(4) Stress Boundary Condition
σ ij Lj = s i(x ,y ,z ) , (x ,y ,z ) ∈ S 1
, (4)
u i = g i(x ,y ,z ,t ) , (x ,y ,z ) ∈ S 2
Where, g i(x ,y ,z ,t ) is the surface displacement on the boundary S2 of known function. s i(x ,y ,z ) is
the surface forces on the boundary S1 of known function.
2.2 Mathematical model of the dam seepage
In practical engineering, often have to consider water, pumping, rainfall and evaporation conditions. We can add in
the basic equations to be considered the source and sink items I can get:
(1) Seepage Continuity Equation
∂( ρv x ) ∂( ρv y ) ∂( ρv z ) ∂ρn
+ + +I = − (5)
∂x ∂y ∂z ∂t
(2) Initial Conditions
Initial conditions in a given time (usually expressed as t = 0) the D value of each point of the head, namely:
H (x ,y ,z ,t )t = 0 = H 0(x ,y ,z ),(x ,y ,z ) ∈ D (6)
Where, H0 is on D , the known functions.
(3) Boundary Conditions[4-6]
H (x , y ,z ,t ) S = H ∗(x , y ,z ,t ),(x , y ,z ) ∈ S 1 (7)
1
Where H (x ,y ,z ,t ) indicates S1 point on the boundary (x, y, z) at time the head, H ∗(x ,y ,z ,t ) is a
known function on S1 .
∂H
kn = q ∗ (x , y ,z ,t ),(x , y ,z ) ∈ S 2 (8)
∂n S2
Where, kn is the boundary normal direction of the permeability coefficient, n is the boundary normal direction,
q ∗ (x , y ,z ,t ) is on the S 2 known functions.
2](https://image.slidesharecdn.com/researchontheconcretedamdamageandfailureruleundertheactionoffluid-solidcoupling-120610014854-phpapp01/75/Research-on-the-concrete-dam-damage-and-failure-rule-under-the-action-of-fluid-solid-coupling-2-2048.jpg)
![Civil and Environmental Research www.iiste.org
ISSN 2222-1719 (Paper) ISSN 2222-2863 (Online)
Vol 2, No.2, 2012
∂H
+ αH = β (9)
∂n
Where, α β are known functions on the boundary, the second boundary known as the third type of boundary or
mixed border.
3 Model establishment and analysis of concrete dam
A reservoir staunch that is shown as fig.1 is built of concrete materials. There is no crack instability and signs
including no bad geological process.
3.1 Calculation related conditions
We set the horizontal and vertical two constraints in the bottom of the dam foundation. In contact with water on the
boundary of the added pore pressure boundary, through to the definition of drainage boundary, it can satisfy the face
completely saturated area and unsaturated area in the boundary, the pore pressure is zero [7-9]. The concrete material
parameters are shown in table 1.
Table 1 Basic mechanics parameters of the dam
ρ [ Kg / m 3 ] E[GPa] µ k[cm/s] γ w [ kN / m 3 ] e
2500 30 0.35 1E-007 9.8 1
Water
55m
53m Dam
Water
17m Base
12m
146m
Fig. 1 Slope of the dam Fig. 2 Computational grid diagram
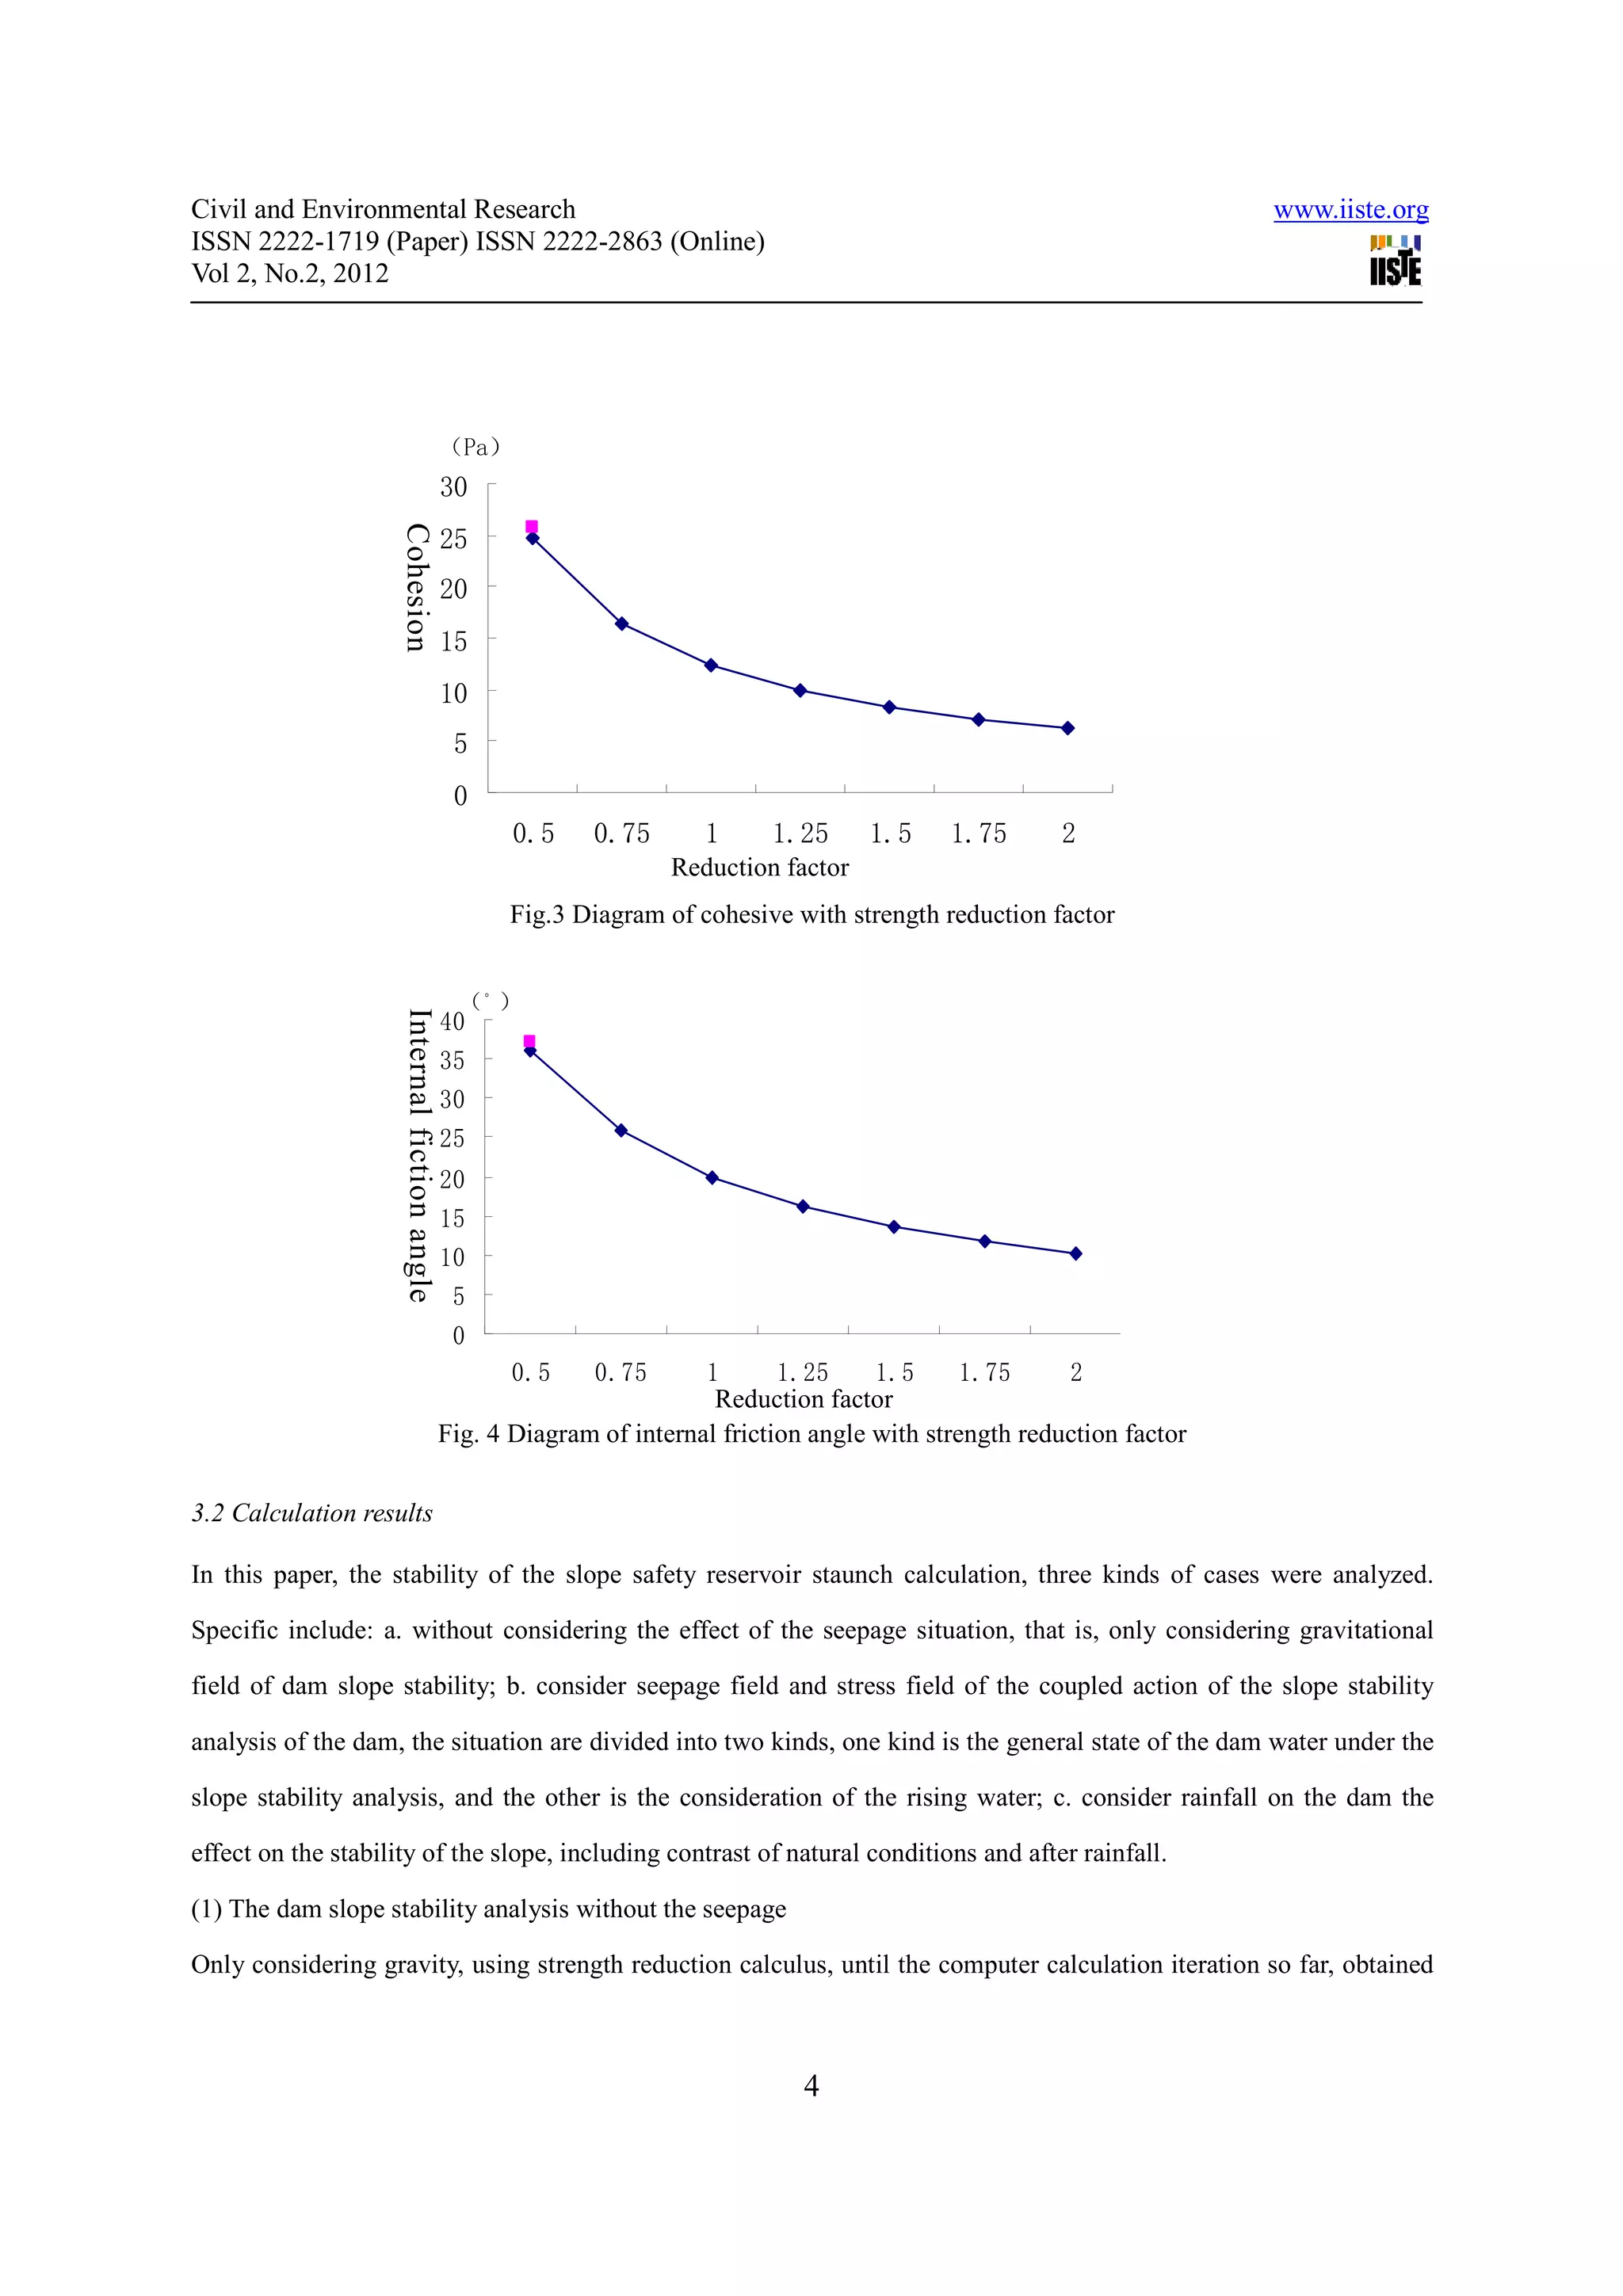
The cohesion and inner friction angle with the reduction coefficient function is shown below.
3](https://image.slidesharecdn.com/researchontheconcretedamdamageandfailureruleundertheactionoffluid-solidcoupling-120610014854-phpapp01/75/Research-on-the-concrete-dam-damage-and-failure-rule-under-the-action-of-fluid-solid-coupling-3-2048.jpg)
![Civil and Environmental Research www.iiste.org
ISSN 2222-1719 (Paper) ISSN 2222-2863 (Online)
Vol 2, No.2, 2012
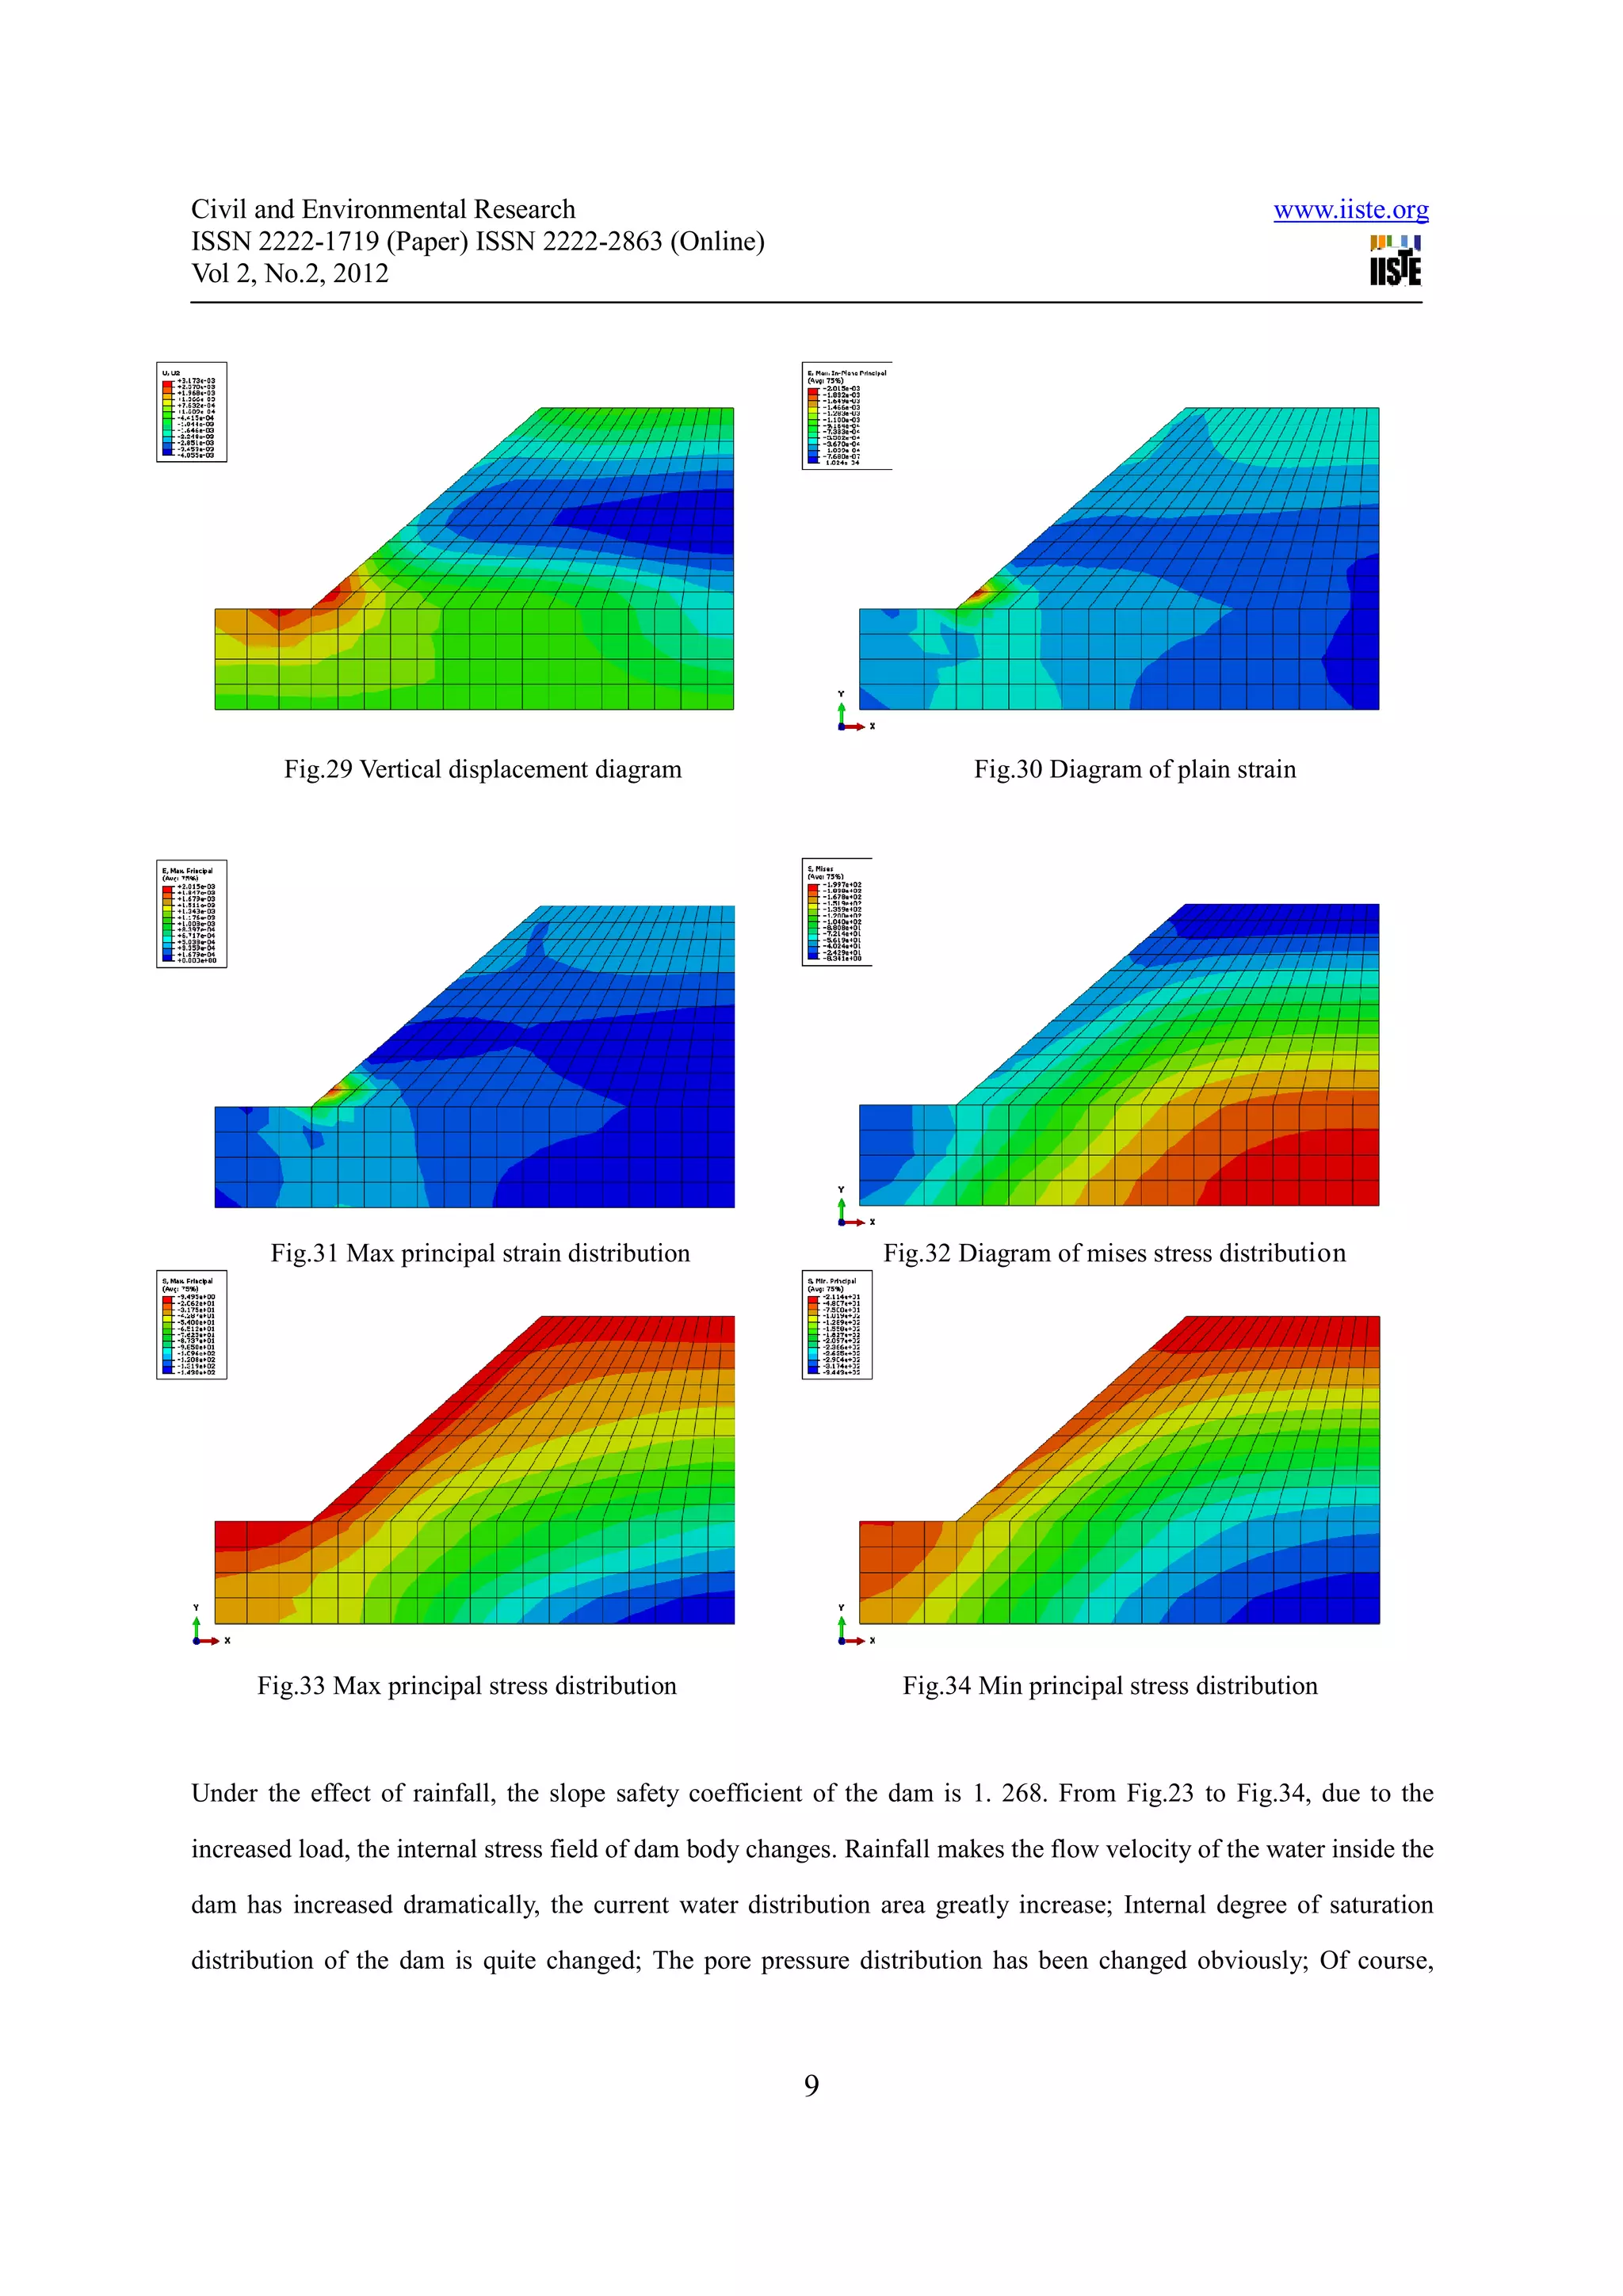
infiltrating the position of the line also have outstanding change. This shows that rainfall makes dam of internal
seepage field generate a large changes. So the conclusion is: the internal stress field of dam body changes on the
seepage field has very big effect.
4. Summary
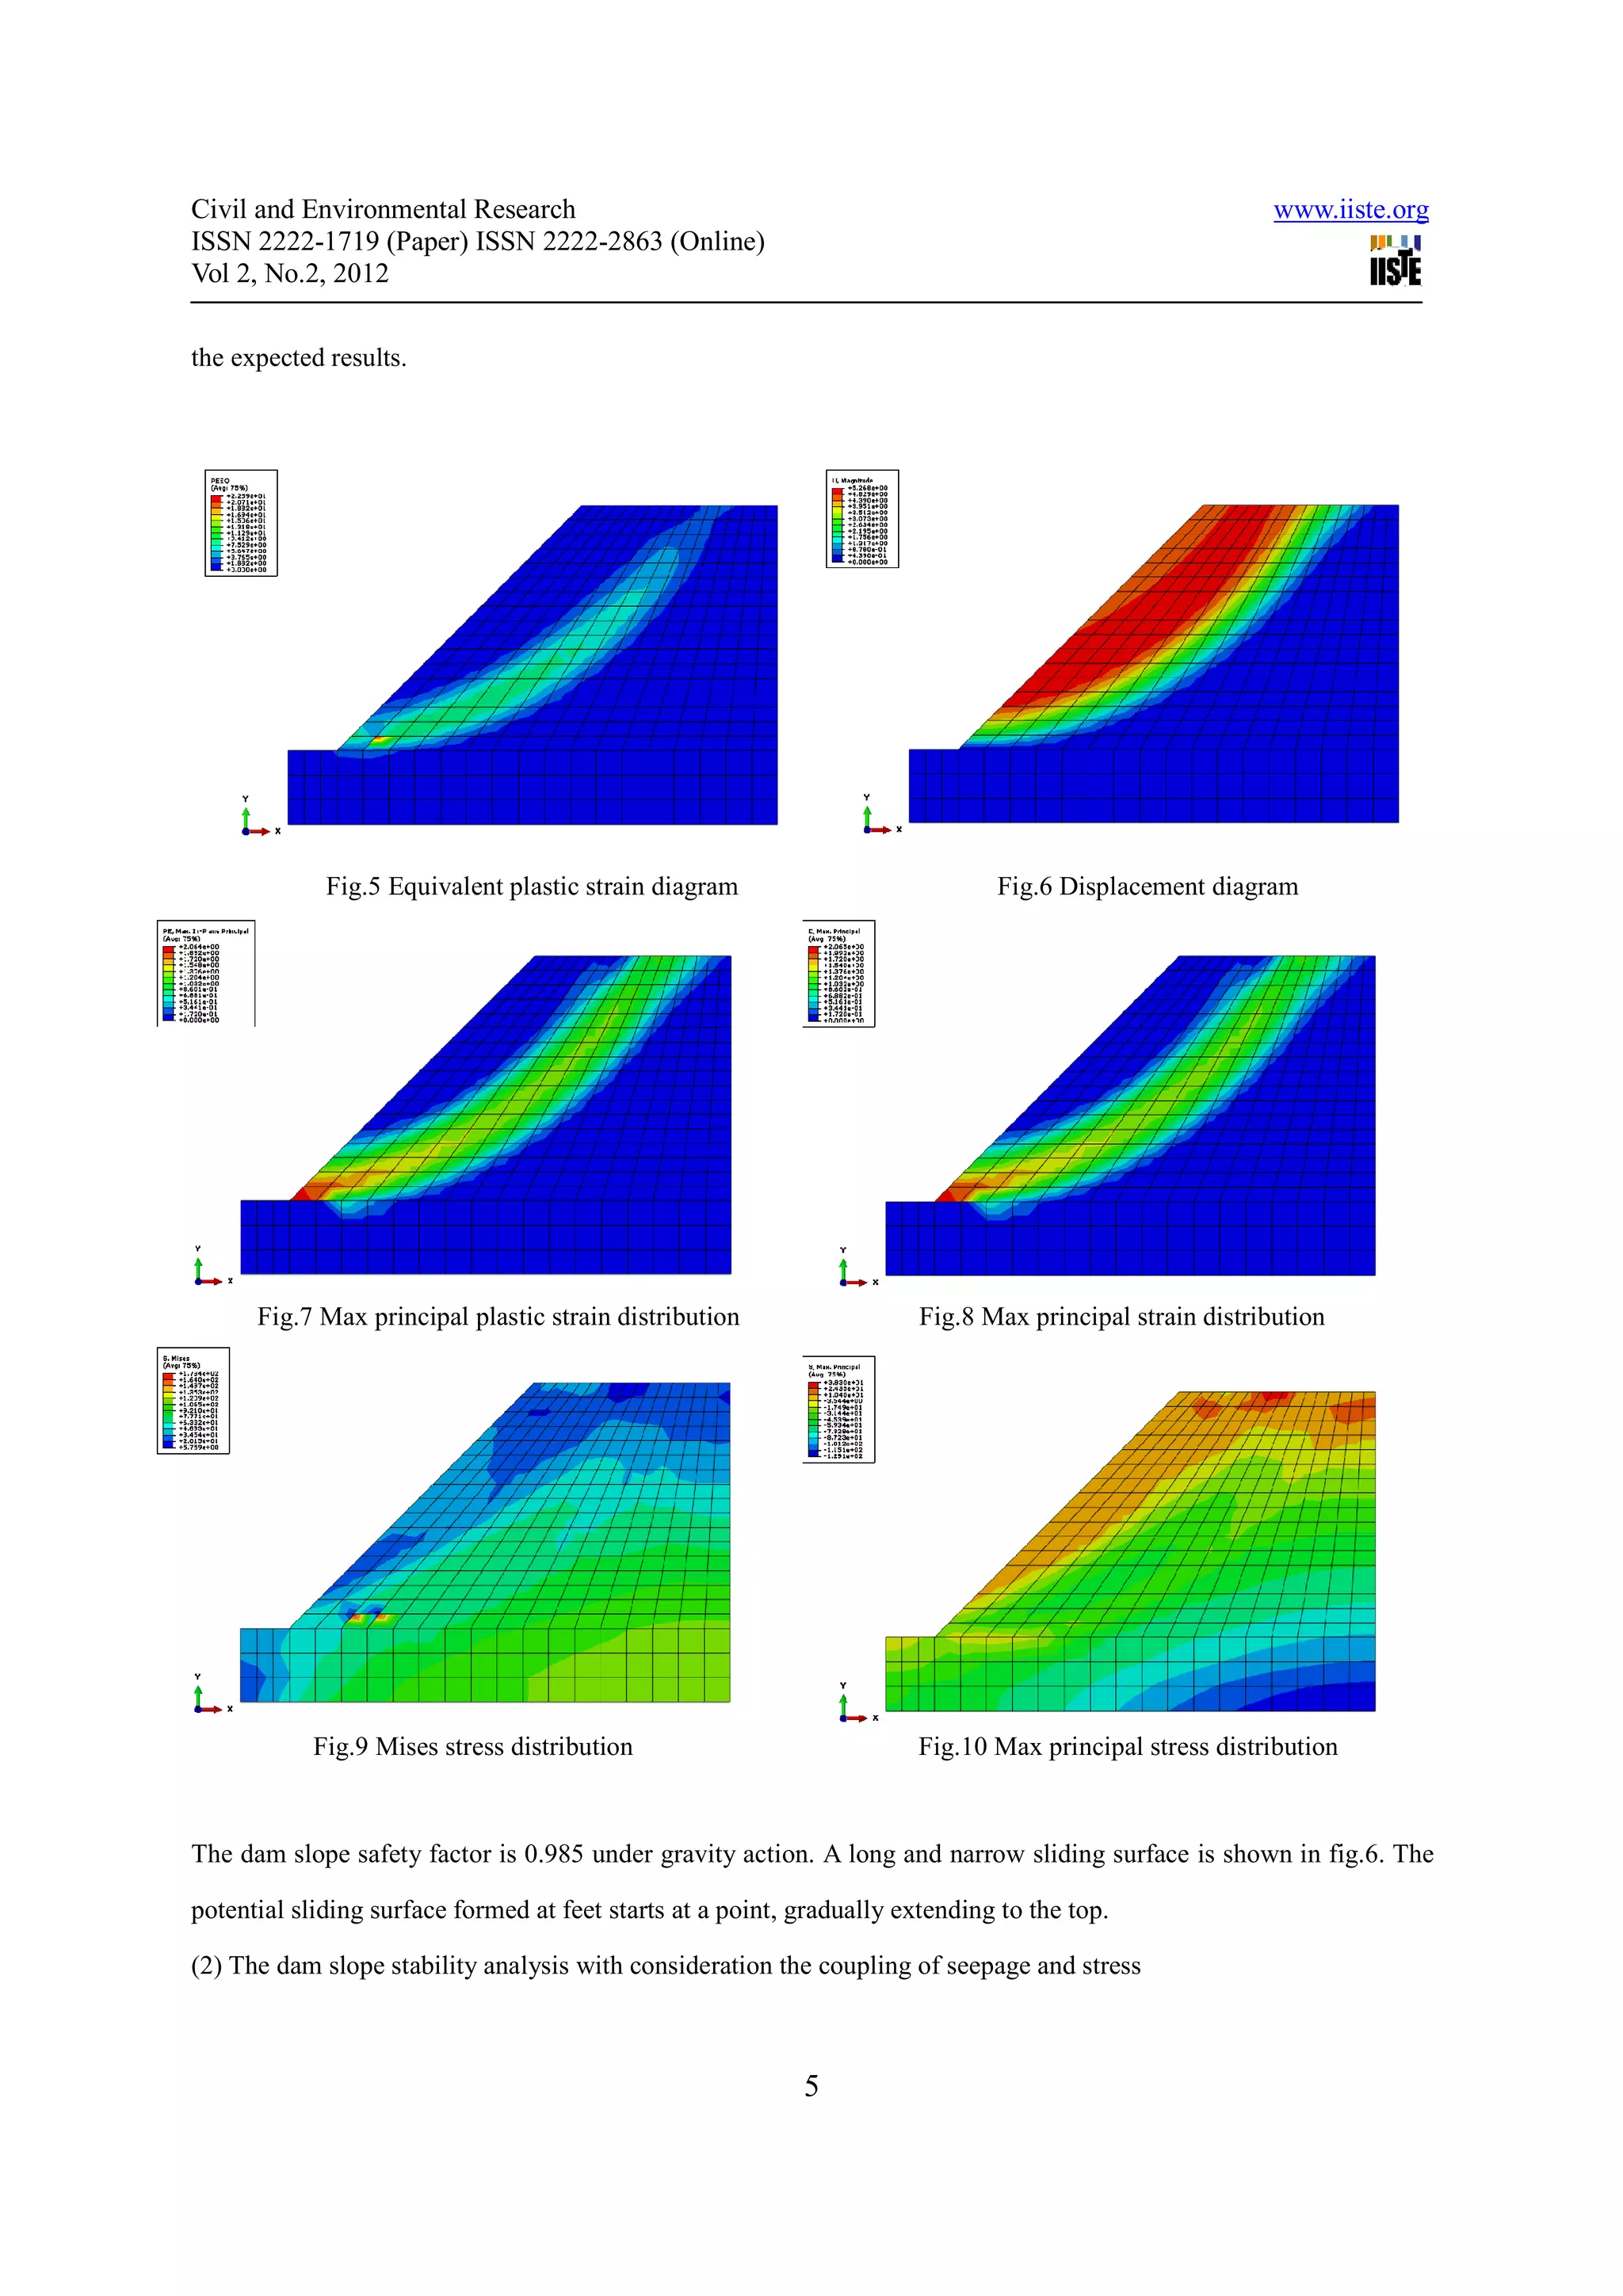
By analyzing the static simulation of the dam , we get the rules shown as follows:
a) The most dangerous part of the dam is the base of slope. General speaking, dam’s slope instability starts with the
base of the slope. With the development of the slope top’s tension crack and the base of slope’s creep slip, the
destruction is produced in the dam gradually. The landslide will happen when the potential sliding surface is run
through. And the more the external loads are, the easier the dam will be instability and failure, and the larger the
failure surface will be;
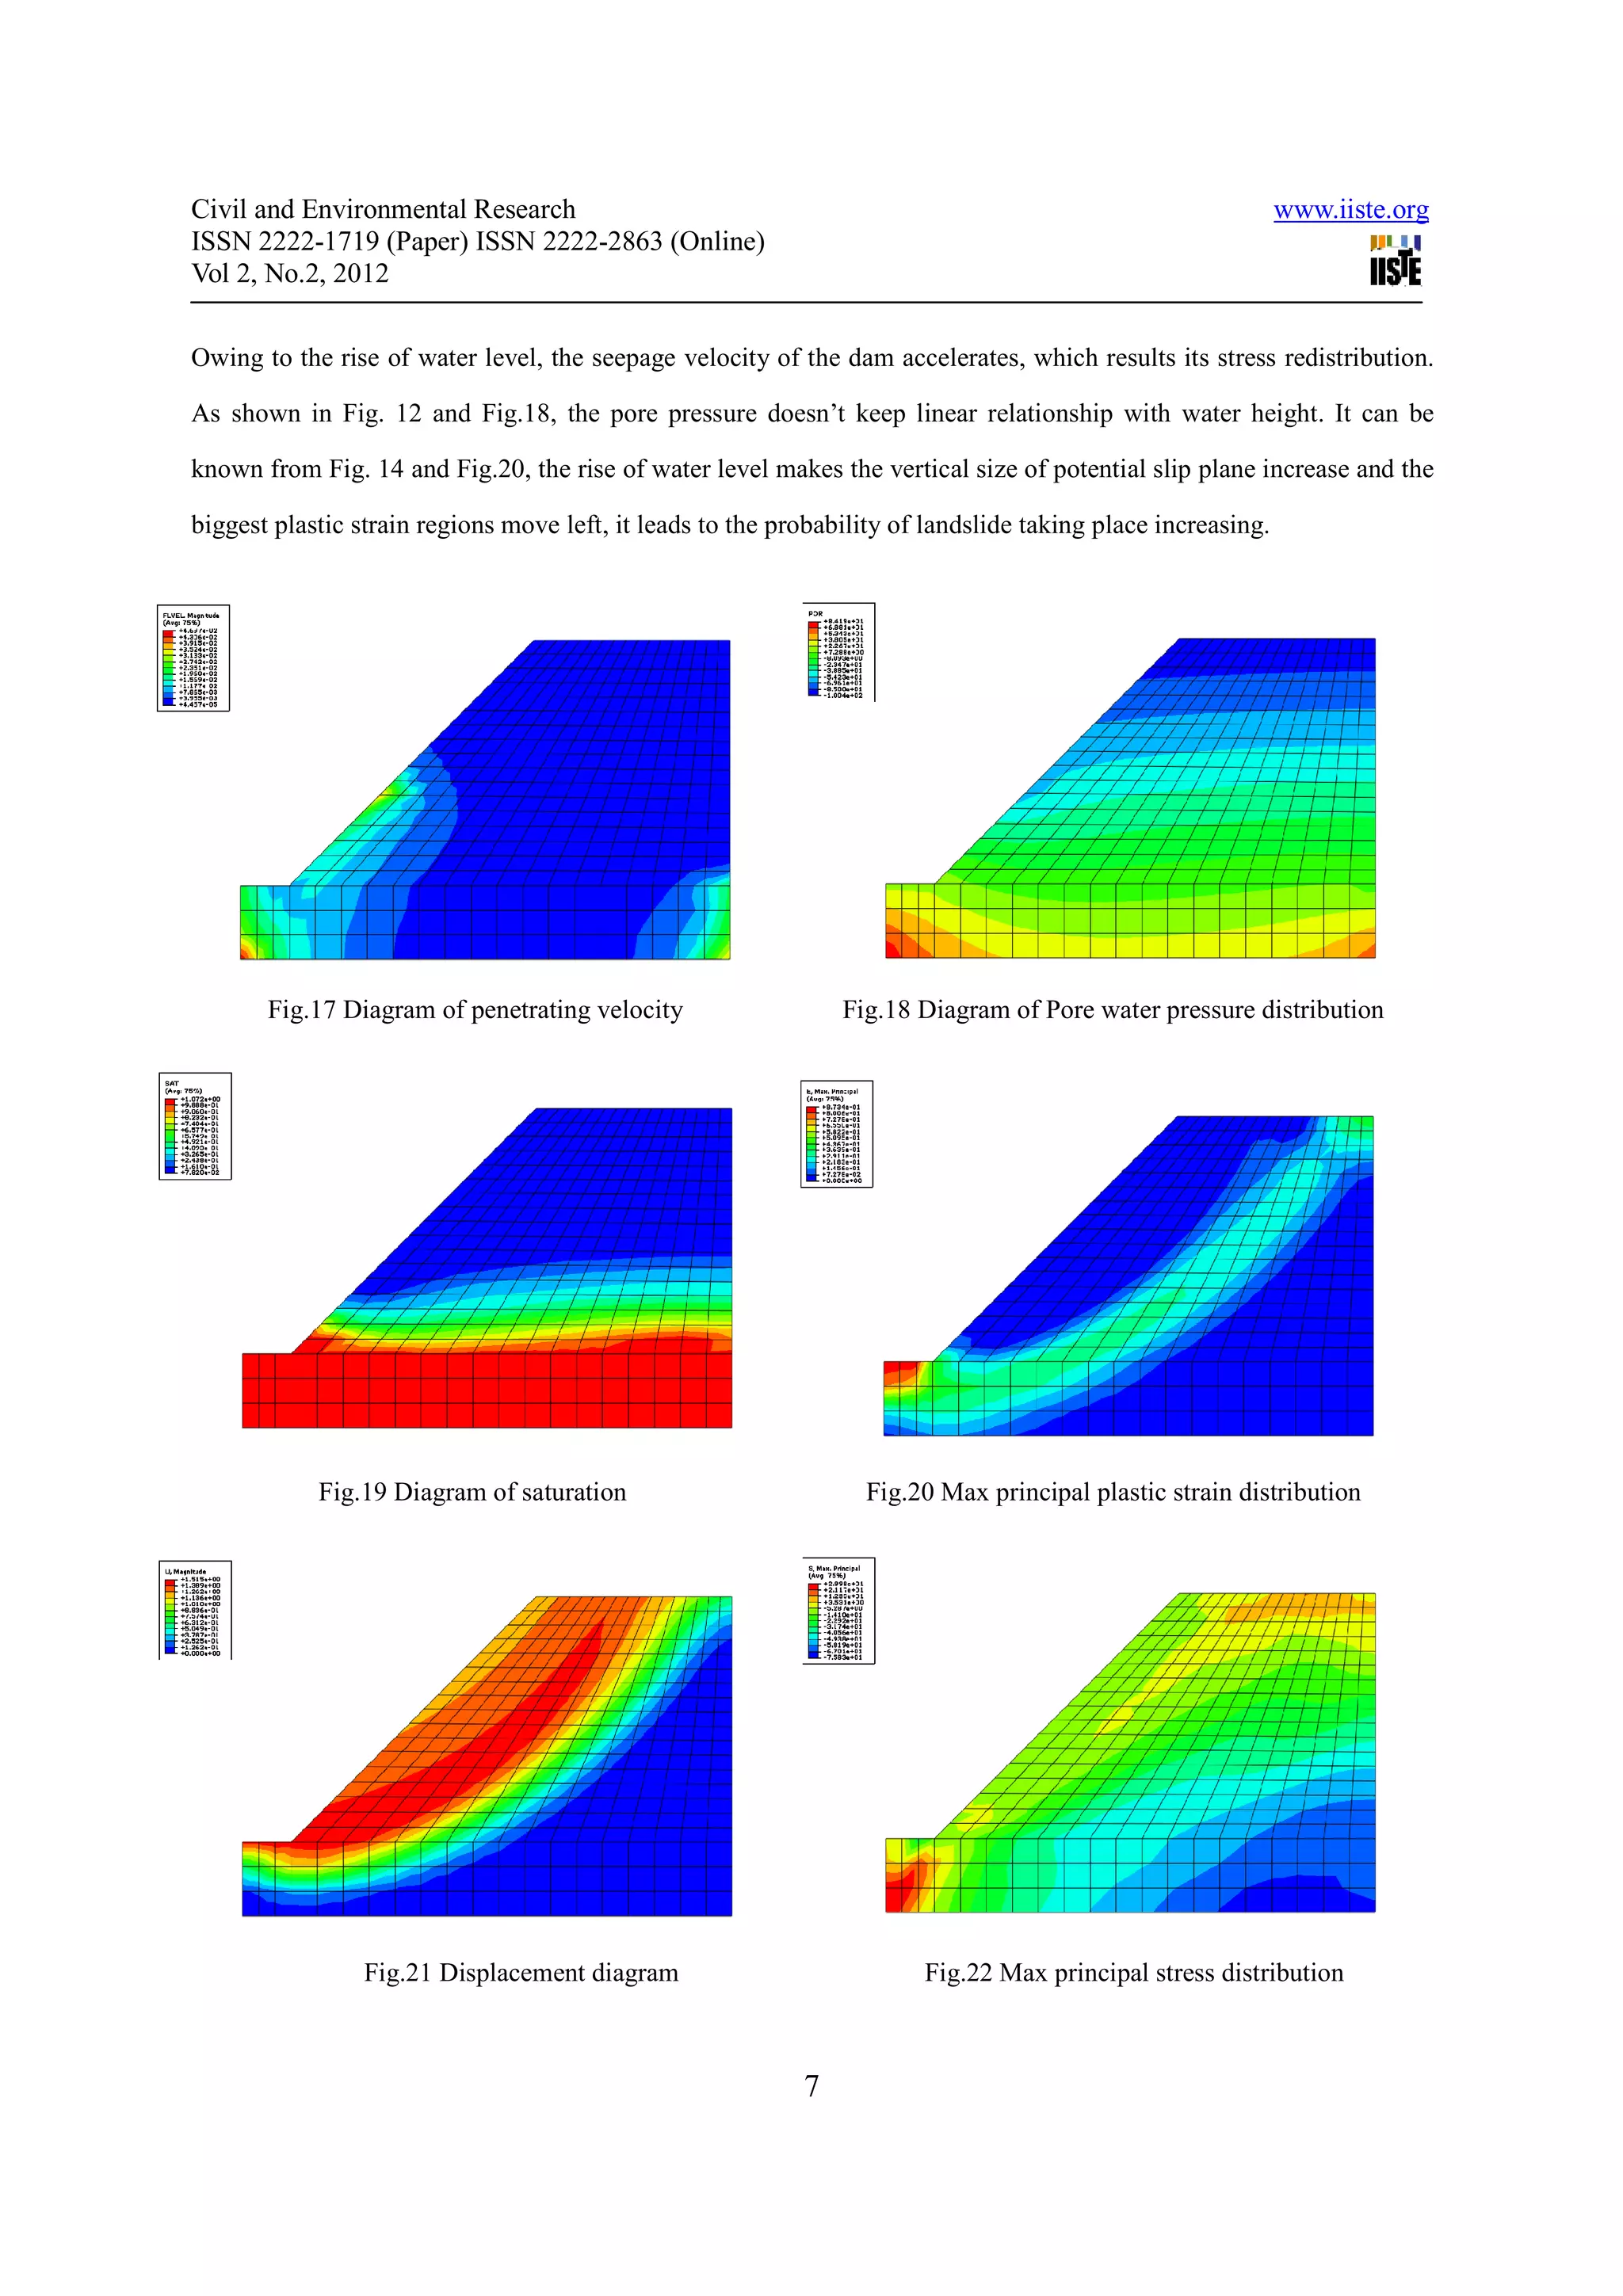
b) The water level has a great influence on the slope stability of the dam. The higher the water level is, the more
strong the seepage effect in the dam, the larger the deformation of the dam skeleton, the stress and the strain in the
dam is. The dam body is easier to be instable. The most dangerous point of the base of slope moves towards the left
with the rising of the water level;
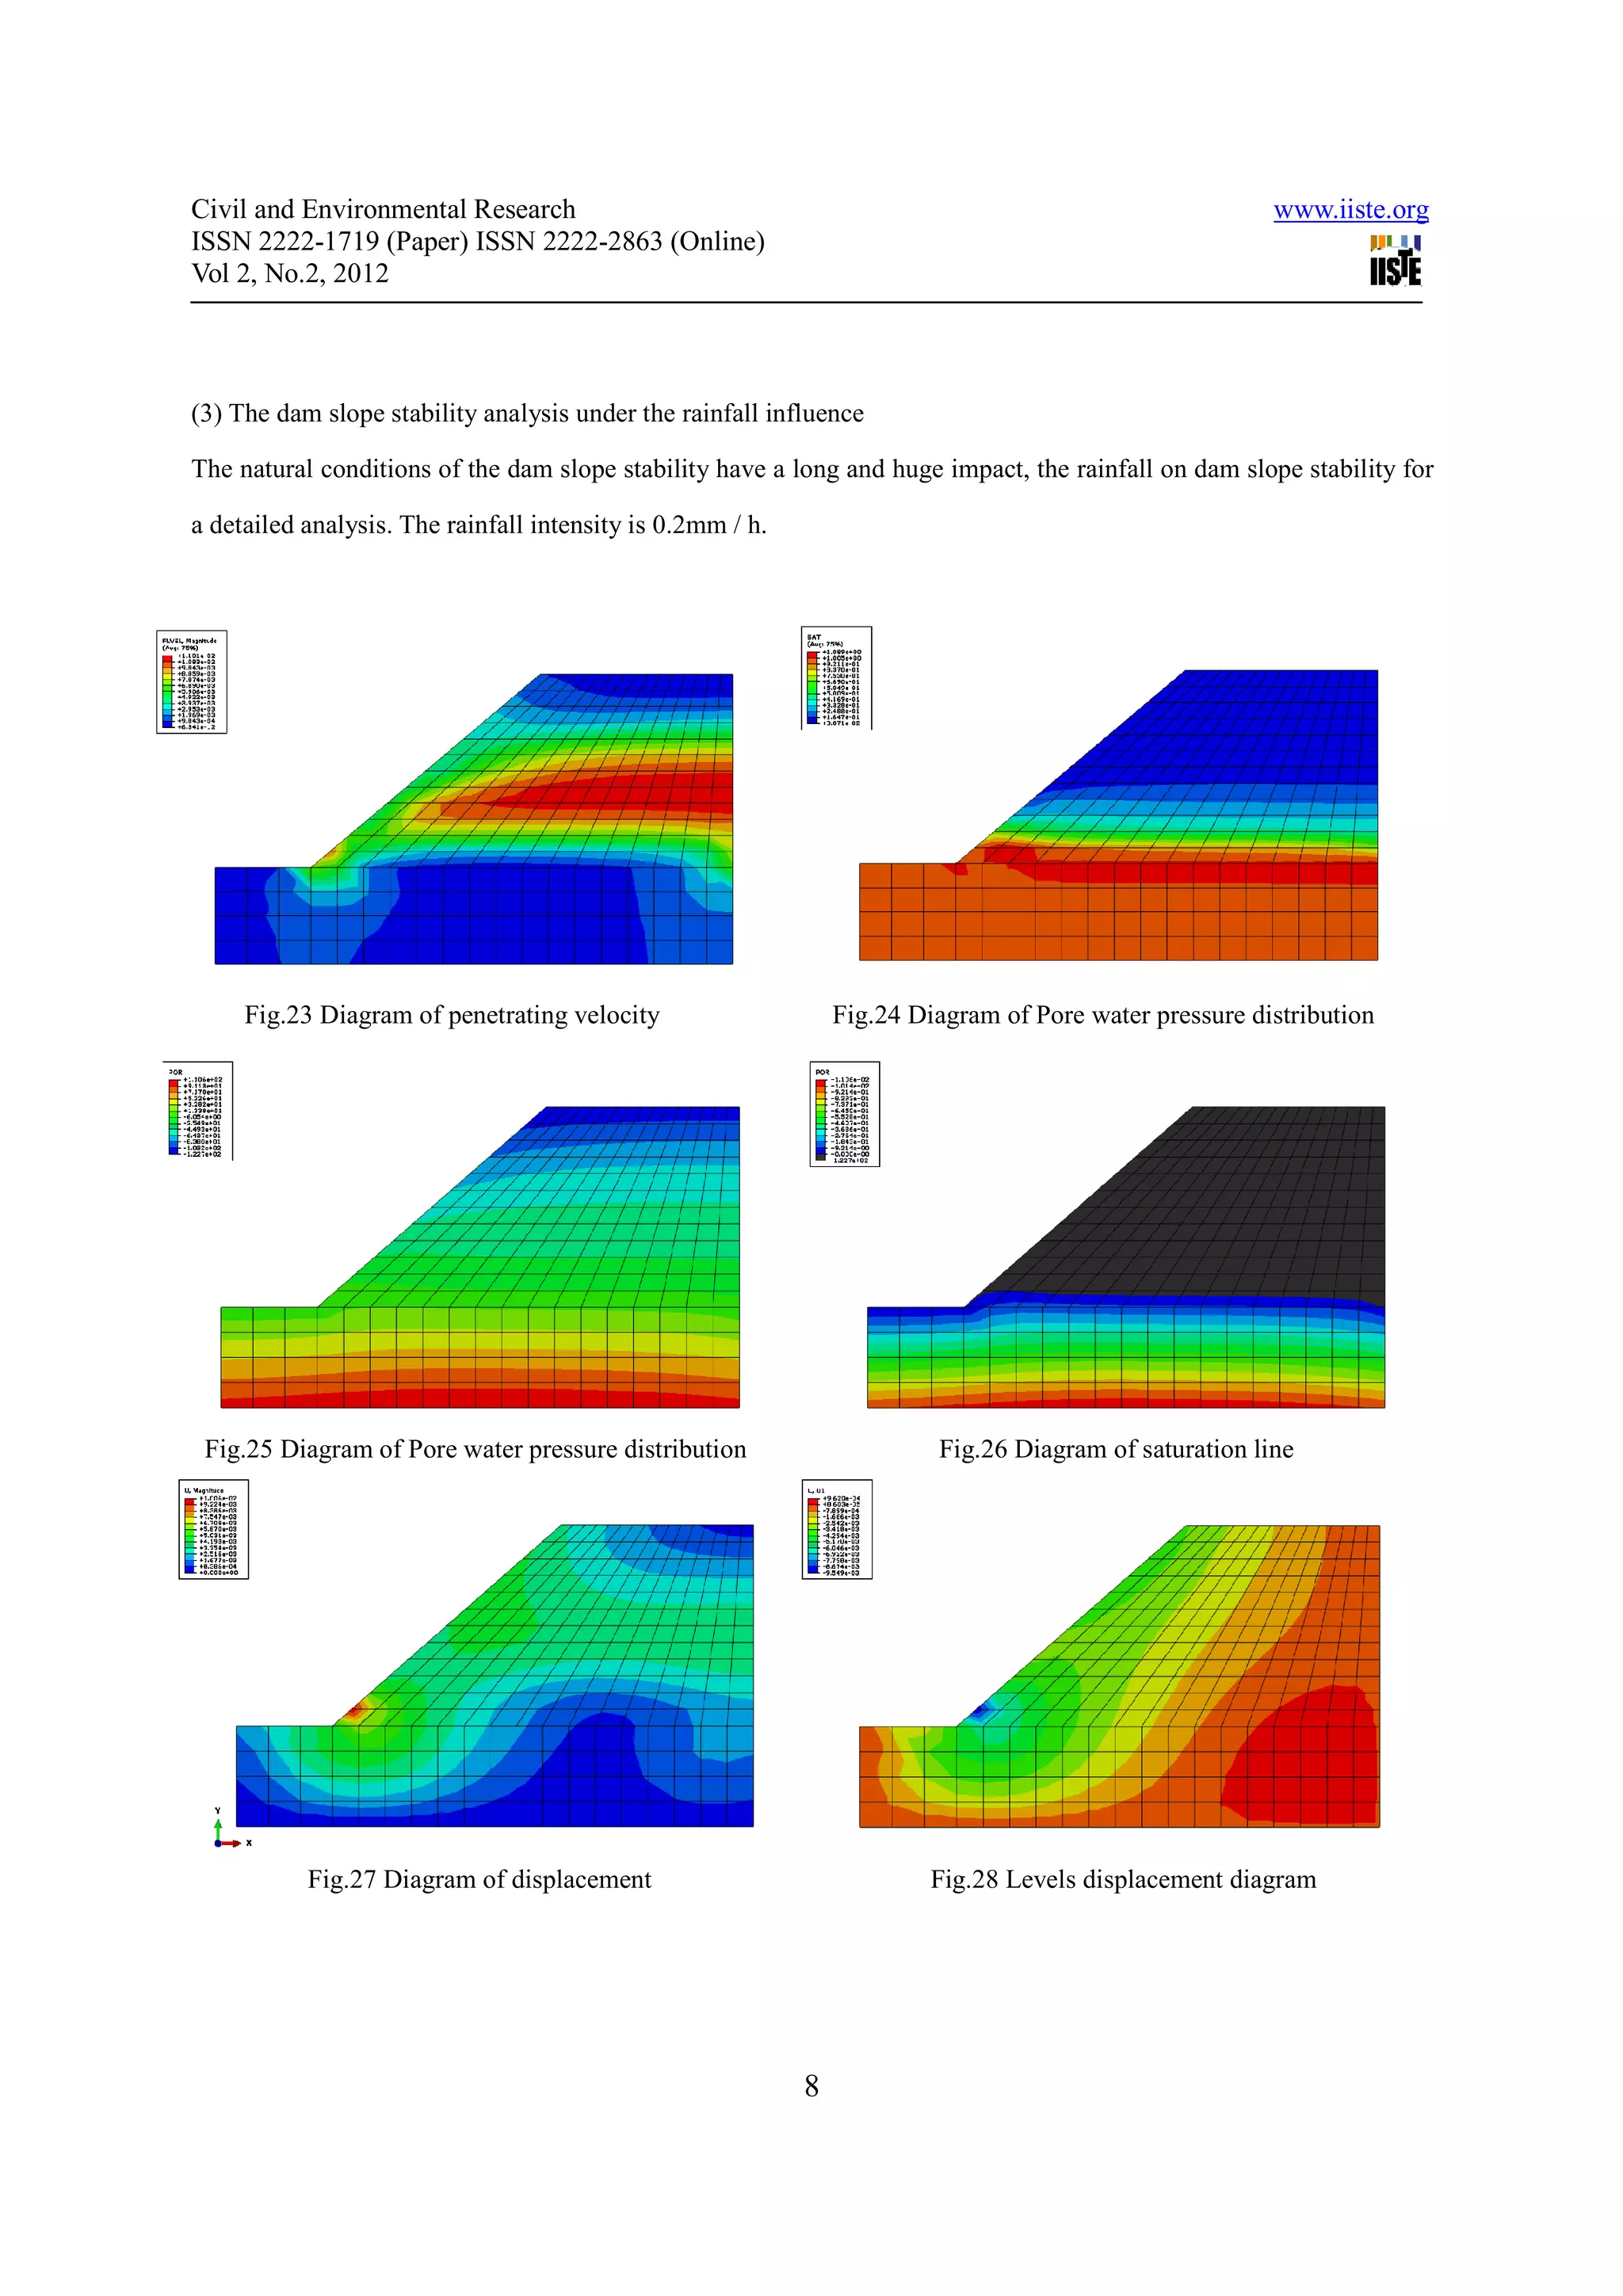
c) The rainfall has a great influence on the slope stability of the dam. The rainfall impact will cause the great change
of the seepage field and the stress field, influences the stress and strain distribution of the dam, and changes the
situation of the dam skeleton’s deformation, causes the instable failure of the dam finally.
References
[1] D.G. Fredlund, A. Xing, M.D. Frudlund, et al. The relationship of the unsaturated soil shear strennth function to
the soil-water characteristic curve[J]. Canadian Geotechnical Journal. 1995
[2] D.G. Fredlund, A. Xing, S. Huang. Predicting the permeability function for unsaturated soils using the soil-water
characteristic curve. Canadian Geotechnical Journal[J]. 1994
[3] Z.Y. Chen. Analysis Methodprinciple on soil slope stability[J]. 2000
[4] H.C. Tan and A.K. Chopra. Dam-foundation rock interaction effects in frequency-response function of arch dams.
Earthquake Engineering and Structural Dynamics[J] . 1995
[5] J.W. Chavez and G.L. Fenves. Earthquake analysis of concrete gravity dams including base sliding. Earthquake
Engineering and Structural Dynamics [J]. 1995
[6] K.L. Fok and A.K.Chopra. Earthquake analysis of arch dams including dam-water interaction, reservoir
boundary absorption and foundation flexibility. Earthquake Engineering and Structural Dynamics [J]. 1986
[7] T. Touhei and T. Ohmachi. A FE-BE method for dynamic analysis of dam-foundation-reservoir system in the
time domain. Earthquake Engineering and Structural Dynamics [J]. 1993
[8] X.L. Du, J.L.Wang and T.K. Hung. Effects of sediment on the dynamic pressure of water and sediment on dams.
Chinese Science[J] . 2001
10](https://image.slidesharecdn.com/researchontheconcretedamdamageandfailureruleundertheactionoffluid-solidcoupling-120610014854-phpapp01/75/Research-on-the-concrete-dam-damage-and-failure-rule-under-the-action-of-fluid-solid-coupling-10-2048.jpg)
![Civil and Environmental Research www.iiste.org
ISSN 2222-1719 (Paper) ISSN 2222-2863 (Online)
Vol 2, No.2, 2012
[9] Q.Yang*, Y.R. Liu, Y,R. Chen and W.Y. Zhou. State Key Laboratory of Hydroscience and Hydraulic Engineering,
Tsinghua University, Beijing, 100084, China. Stability and reinforcement analyses of high arch dams by
considering deformation effects[J]. Journal of Rock Mechanics and Geotechnical Engineering. 2010(04)
Acknowledgement
Firstly, I am Moj Raj Bagale, an Author, grateful with the Chinese government for providing government
scholarship for me and secondly department of engineering mechanics of Liaoning technical university for peaceful
laboratory and sophisticated library with full of resources for research . Thirdly, I like to give thanks to highly
renowned professor sun keming who always dedicated for my thesis and this paper. Lastly, I like to say thanks to my
colleagues for their priceless help for me .
Thanks for the natural science foundation supporting whose codes are 5087405 and 11072103.
11](https://image.slidesharecdn.com/researchontheconcretedamdamageandfailureruleundertheactionoffluid-solidcoupling-120610014854-phpapp01/75/Research-on-the-concrete-dam-damage-and-failure-rule-under-the-action-of-fluid-solid-coupling-11-2048.jpg)


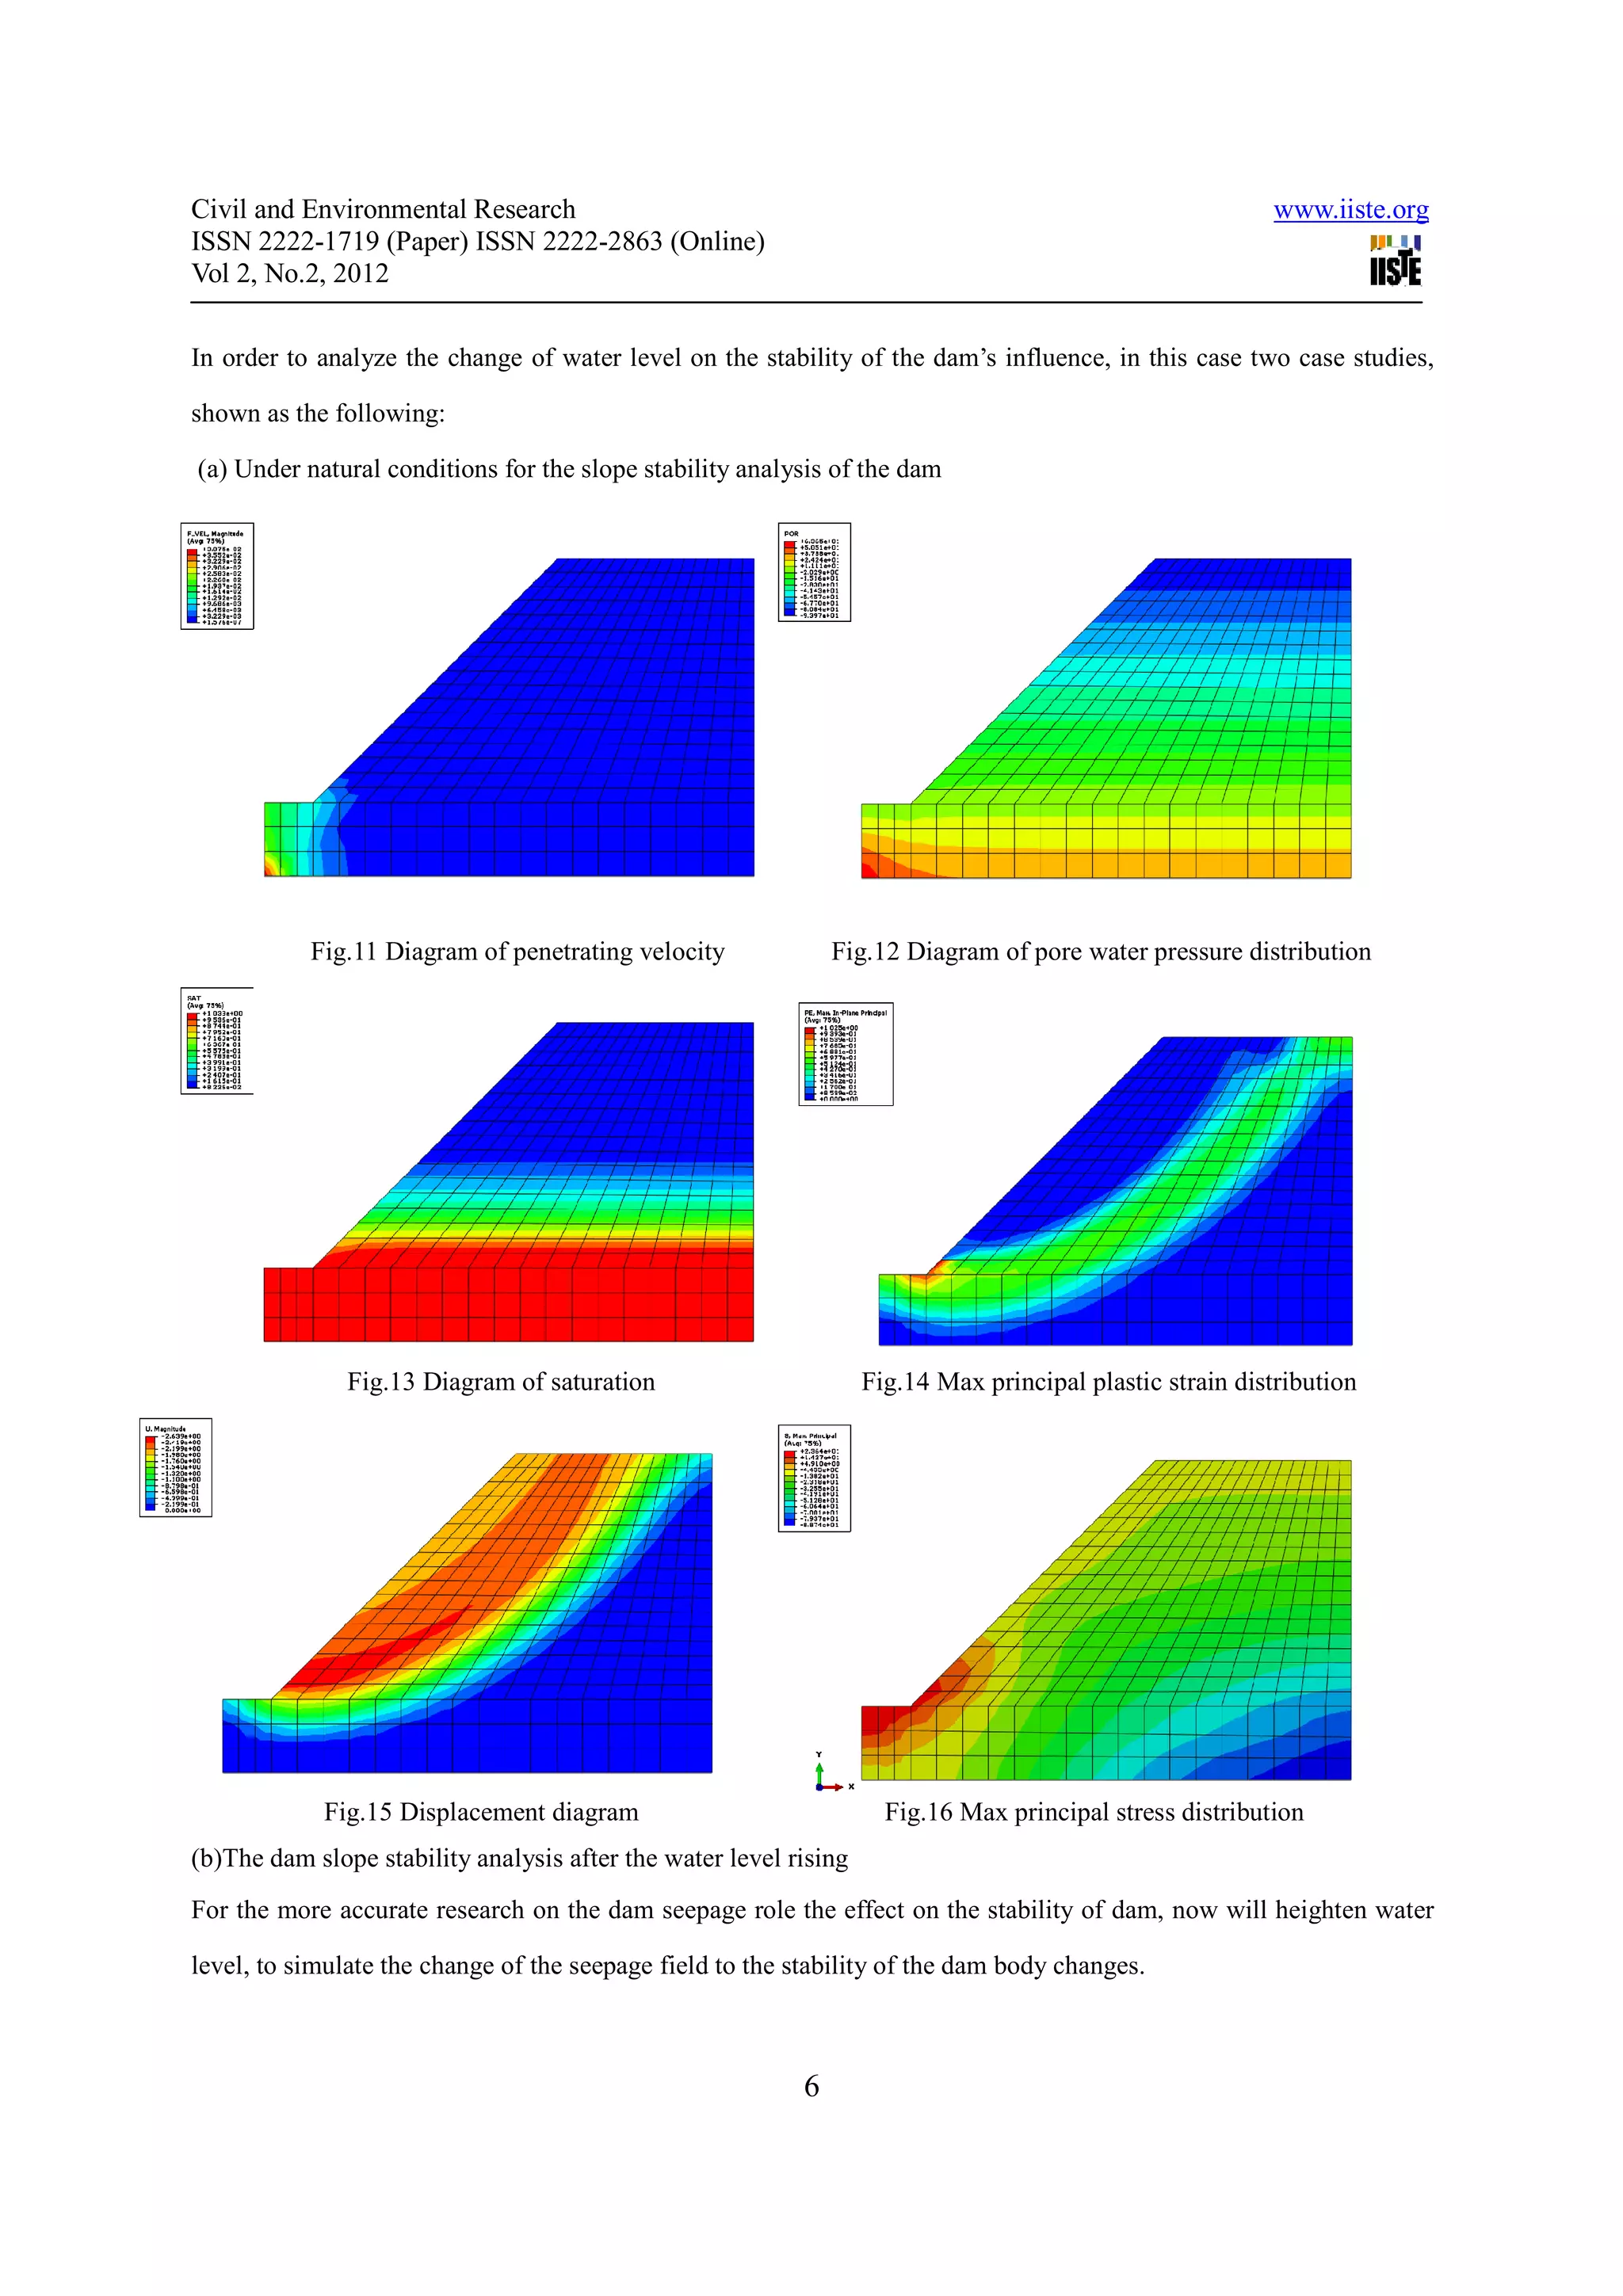
This document discusses research on the damage and failure of concrete dams under fluid-solid coupling. The researchers evaluated dam stability under increasing water levels and rainfall intensity using a strength reduction method. Their conclusions were that dam failure starts from the slope base, with cracks developing on the slope top and creeping slip in the base. This leads to gradual destruction of the dam and formation of slip surfaces. Higher water levels and more intense rainfall decrease the safety factor and cause failure surfaces to move inward.