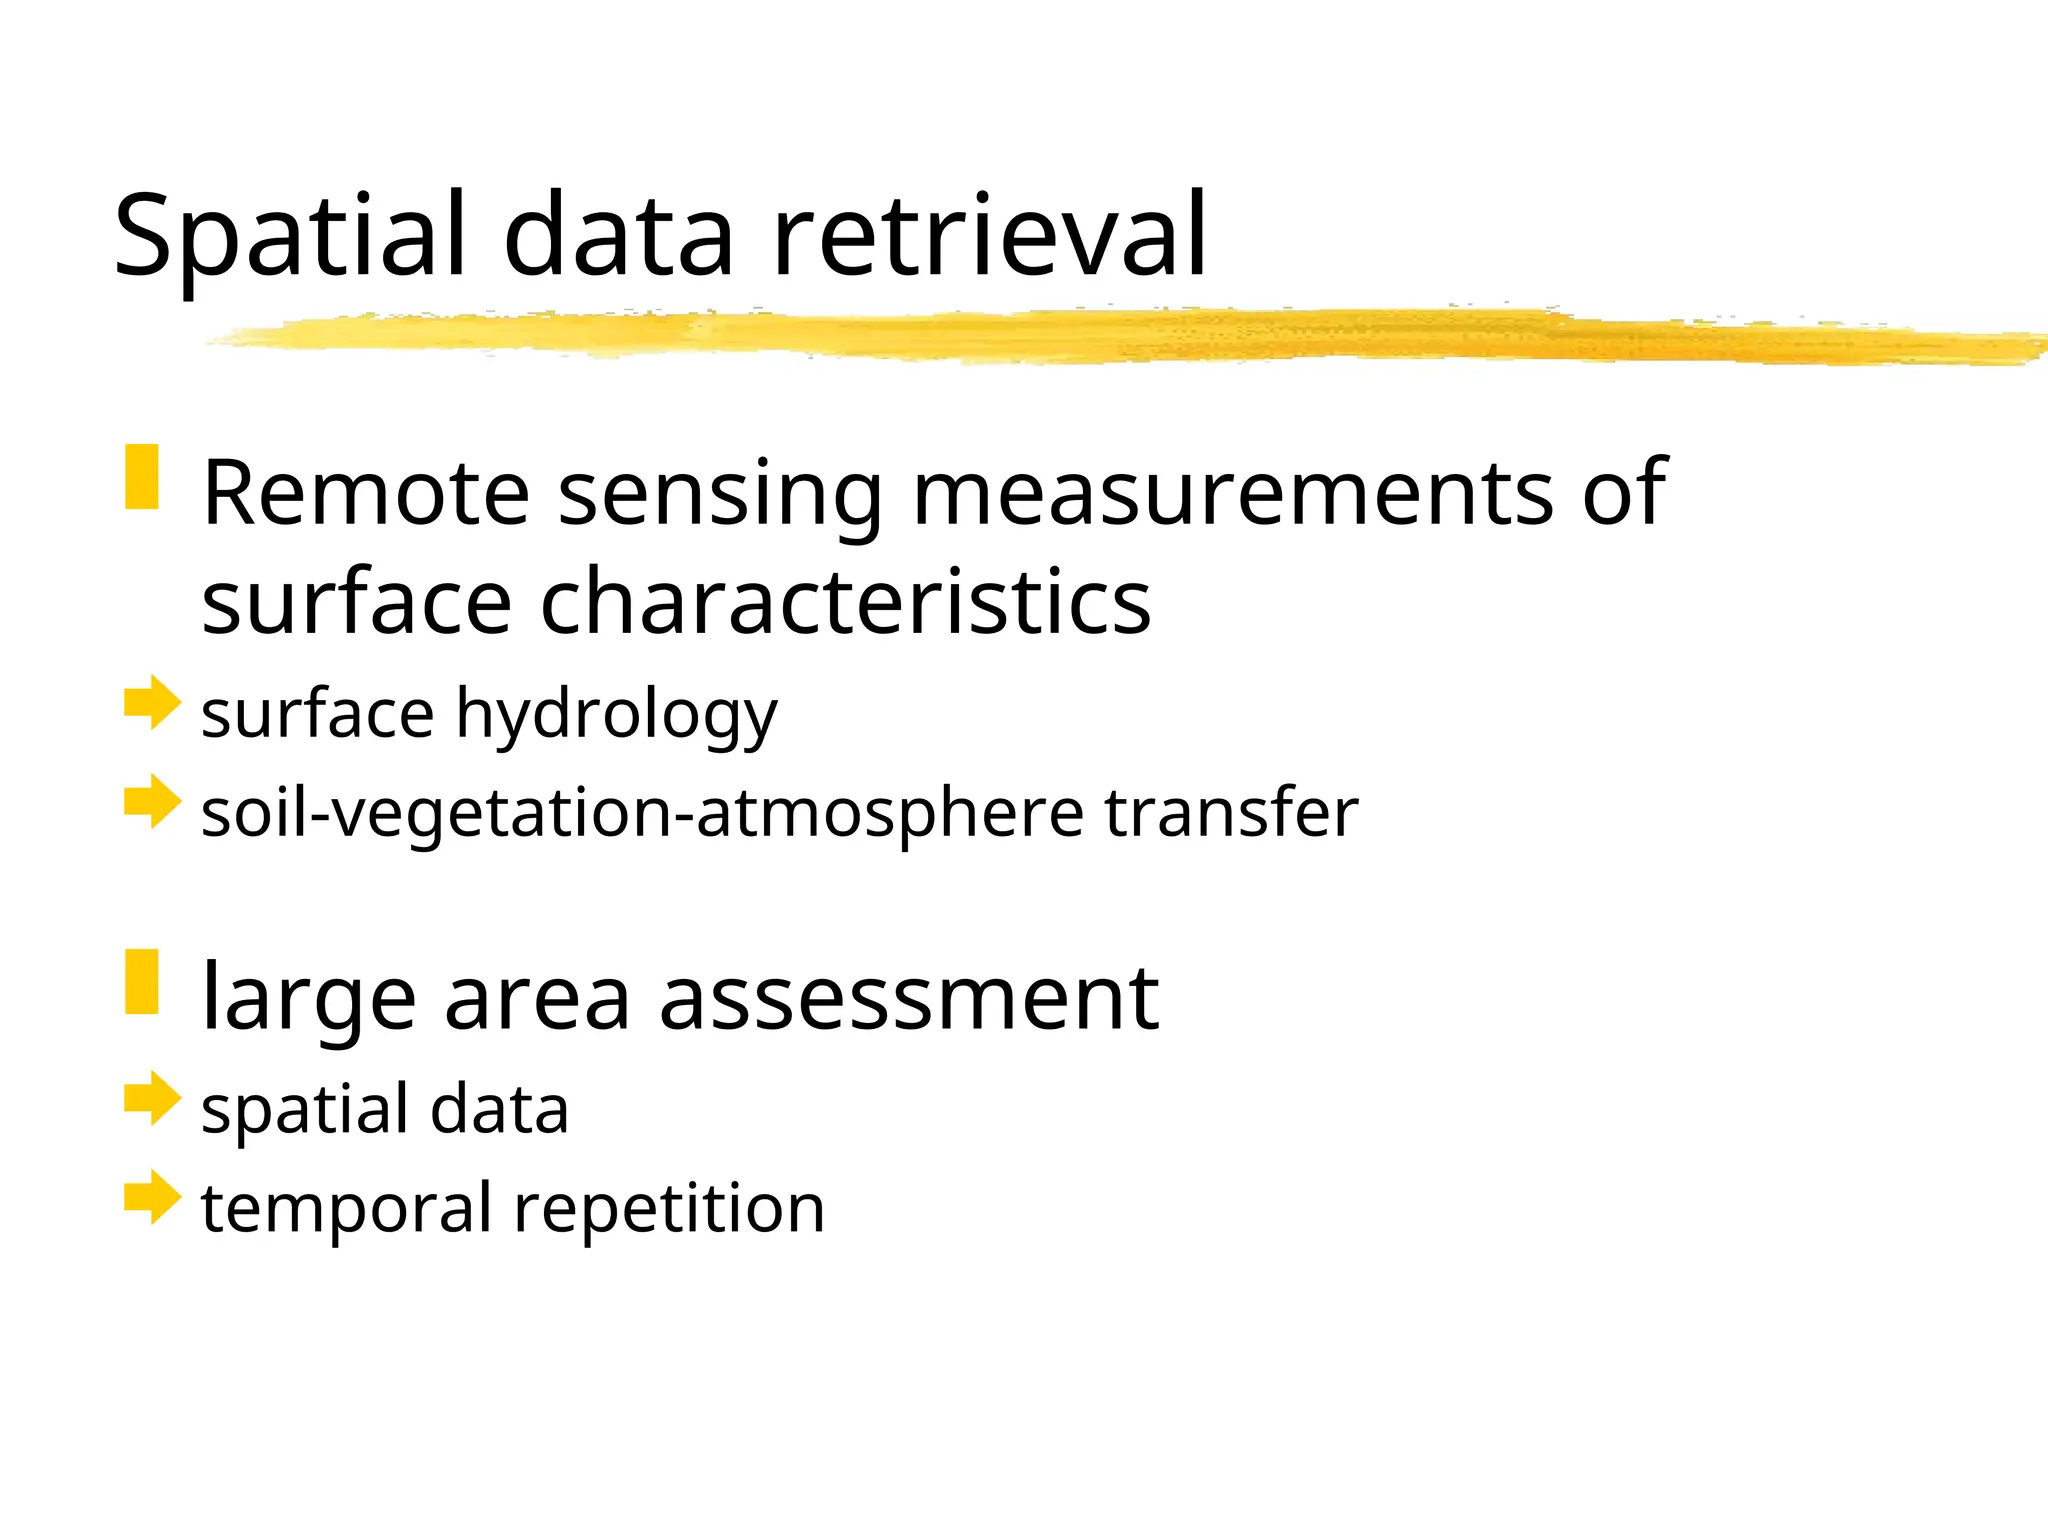
The document discusses remote sensing systems that provide spatial data retrieval for hydrology and various environmental parameters. It outlines the types of remote sensing systems, their spatial resolution, and applications in assessing soil moisture, surface temperature, and land use. The summary emphasizes the need for image processing and model coupling to extract quantitative data for GIS analysis.

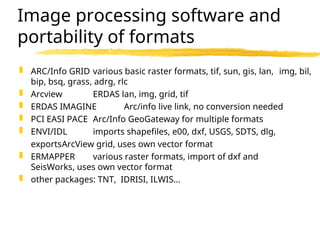
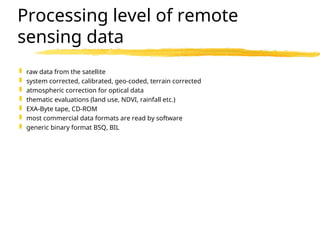
![Available remote sensing systems
I
Optical scanners
spectrometers
and
altimeters
Sensor System Global
Coverage
Spatial
Resolution
Temporal
Resolution
[days]
Frequency/Wavelength Parameter examples
LANDSAT-TM multi-spectral
scanner
y 30m 17 450 – 520 nm
520 – 600 nm
630 – 690 nm
760 – 900 nm
1550 – 1740 nm
10400 – 12500 nm
2080 – 2350 nm
land use
NDVI, LAI, biomass
http://geo.arc.nasa.gov/s
ge/landsat/landsat.html
SPOT HRV XS multispectral and
panchromatic
scanner
y 5m PAN
10m XS
26 500 – 590 nm
610 – 680 nm
790 – 890 nm
DEM from stereoscopic
data
land use
plant parameters
http://www.spot.com
IRC-1C LISS-3
WIFS
y 23m, 70m
188m
24 520 - 590 nm
620 - 680 nm
770 - 860 nm
1550 - 1700 nm
WIFS:
620 – 680 nm
770-860
land use
NDVI, LAI, biomass
http://www.euromap.de/
doc_004.htm
NOAA/AVHRR advanced very high
resolution
radiometer
y 1.1km 12 580 - 680 nm
725 - 1100 nm
3550 - 3930 nm
10300 - 11300 nm
11500 - 12500 nm
NDVI
clouds
http://www.ncdc.noaa.go
v/ol/satellite/satellitereso
urces.html
Earth
Probe/TOMS
total ozone imaging
spectrometer
y 39km x
39km
1 360.0 nm
331.2 nm
322.3 nm
317.5 nm
312.5 nm
308.6 nm
aerosol, ozone, UV
Radiation, atmospheric
chemistry
http://jwocky.gsfc.nasa.go
v/index.html
GOES imaging
spectrometer
y 1 km 2 550 - 750 nm
3800 - 4000 nm
6500 - 7000 nm
10200 - 11200 nm
11500 - 12500 nm
clouds,
rainfall rates
http://www5.ncdc.noaa.g
ov/plwebapps/plsql/goesb
rowser.goesbrowsemain
TOPEX/
Poseidon
2 Altimeters + /- 60 1.6 - 3 km
(ALT)
7 km
(SSALT)
10 ALT: 13.6 GHz
SSALT: 16.6 GHz
sea surface altimetry
river and lake level
altimetry
http://www-
ccar.colorado.edu/researc](https://image.slidesharecdn.com/remotesensingdatatypesforsoilmapping-240917192752-131c1998/85/remote-sensing-data-types-for-soil-mapping-ppt-3-320.jpg)
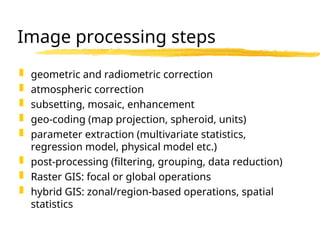
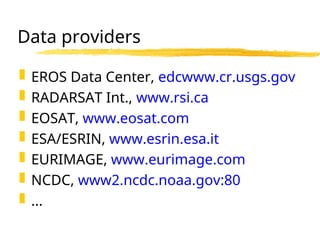
![Available remote sensing systems
II
Sensor System Global
Coverage
Spatial
Resolution
Temporal
Resolution
[days]
Frequency/Wavelength Parameter examples
and web-page
SSM/I Radiometer y 70 x 45
60 x 40
38 x 30
16 x 14
1 19.35 GHz, HV
22.24 GHz, V
37.00 GHz, HV
85.50 GHz, HV
soil moisture
snow cover
sea ice
ocean surface wind speed
http://www.ncdc.noaa.gov
/ol/satellite/ssmi/ssmiprod
ucts.html
ERS-2 ATSR along track
scanning
radiometer:
MW sounder
and
IR Radiometer
y 20 km
1 km
3 MW Sounder:
23.8 GHz
36.5 GHz
IRR:
1600 nm
3700 nm
11000 nm
12000 nm
atmospheric water vapor,
liquid water, sea state, sea
surface temperature
http://www.esa.esrin.it
ERS-2 RA radar altimeter mostly
oceans
16 – 20 km 3 330 MHz Ocean
82.5 MHz Ice
ocean level
ice, sea ice level
http://www.esa.esrin.it
ERS-2
AMI-SAR
Windscatterometer
mode
y 50 km 17 5.3 GHz, VV wind speed, ocean waves,
sea ice
RADARSAT Scan SAR mode y e.g. 50 x
50 m
24 5.3 GHz, VV wind speed, ocean waves,
sea ice
http://radarsat.space.gc.ca](https://image.slidesharecdn.com/remotesensingdatatypesforsoilmapping-240917192752-131c1998/85/remote-sensing-data-types-for-soil-mapping-ppt-4-320.jpg)
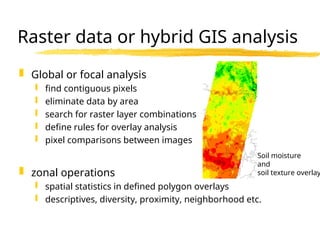
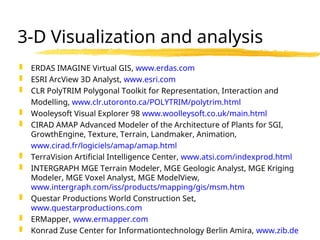
![Future remote sensing systems
Sensor System Global
Coverage
Spatial
Resolution
Temporal
Resolution
[days]
Frequency/Wavelength Parameter examples
SRTM
(1999)
Shuttle Radar
Topography Mission
y 5x 5 a 10 day
period
5.3 GHz DEM,
surface roughness
http://www-
radar.jpl.nasa.gov/srtm/
ENVISAT
A-SAR
(2000)
Advanced Synthetic
Aperture Radar
y 30 – 75m < 17 5.3 GHz, VV surface roughness
snow water equivalent
freeze/thaw cycles
http://envisat.estec.esa.nl/
EOS MODIS
(2000)
Spectrometer y 0.25 km
0.5 km
1 km
1-2 app. 19 optical
channels
land surface temperat.
land/cloud boundaries
land/cloud properties
atmosph. water vapor
http://ltpwww.gsfc.nasa.gov/
MODIS/MODIS.html
http://ltpwww.gsfc.nasa.gov/
MODIS/MAS/index.html
EOS ASTER
(2000)
Advance Space-
borne Thermal
Emission and
Reflection
Radiometer
y 15 m VIS
30 m SWIR
90 m TIR
16 app. 14 optical
channels
evaporation
vegetation stress
soil moisture
http://eos-
am.gsfc.nasa.gov/aster.html
EOS MISR
(2000)
Multi-angle Imaging
Spectro-radiometer
y 0.275 km 9 443 nm
555 nm
670 nm
865 nm
vegetation parameters
vegetation indices
http://eos-
am.gsfc.nasa.gov/misr.html](https://image.slidesharecdn.com/remotesensingdatatypesforsoilmapping-240917192752-131c1998/85/remote-sensing-data-types-for-soil-mapping-ppt-5-320.jpg)
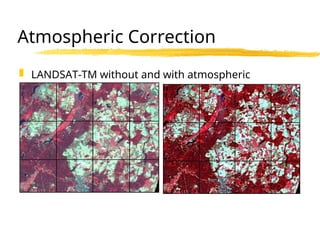
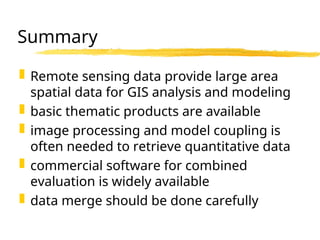
![Soil moisture retrieval from
SAR
Image processing steps
slant range correction
speckle reduction (multi-
looking)
inversion modeling (physical
model) to obtain soil dielectric
constant
conversion of into %Vol with
3rd order polynomial (e.g.
Topp et al. 1991)
grouping into 5% classes
raster-to-vector conversion or
raster use in GIS
In v e rsio n M o d e l D u b o is e t a l. (1 9 9 5 )
h h A k h
c o s
sin
( sin )
.
. ta n .
1 5
5
0 2 8 1 4
1 0
v v k h
c o s
sin
( sin )
. ta n .
3
3
0 4 6 1 1
1 0
0
5
10
15
20
25
30
0.05 0.10 0.15 0.20 0.25 0.30 0.35 0.40
soil water content [cm^3/cm^3]
Realpart
of
Dielectric
Constant
Sand Loam sand Sand loam
Loam organic matter Topp et al.
%Vol](https://image.slidesharecdn.com/remotesensingdatatypesforsoilmapping-240917192752-131c1998/85/remote-sensing-data-types-for-soil-mapping-ppt-12-320.jpg)


![Remote sensing [compatibility mode]](https://cdn.slidesharecdn.com/ss_thumbnails/remotesensingcompatibilitymode-131231034635-phpapp02-thumbnail.jpg?width=640&height=640&fit=bounds)


