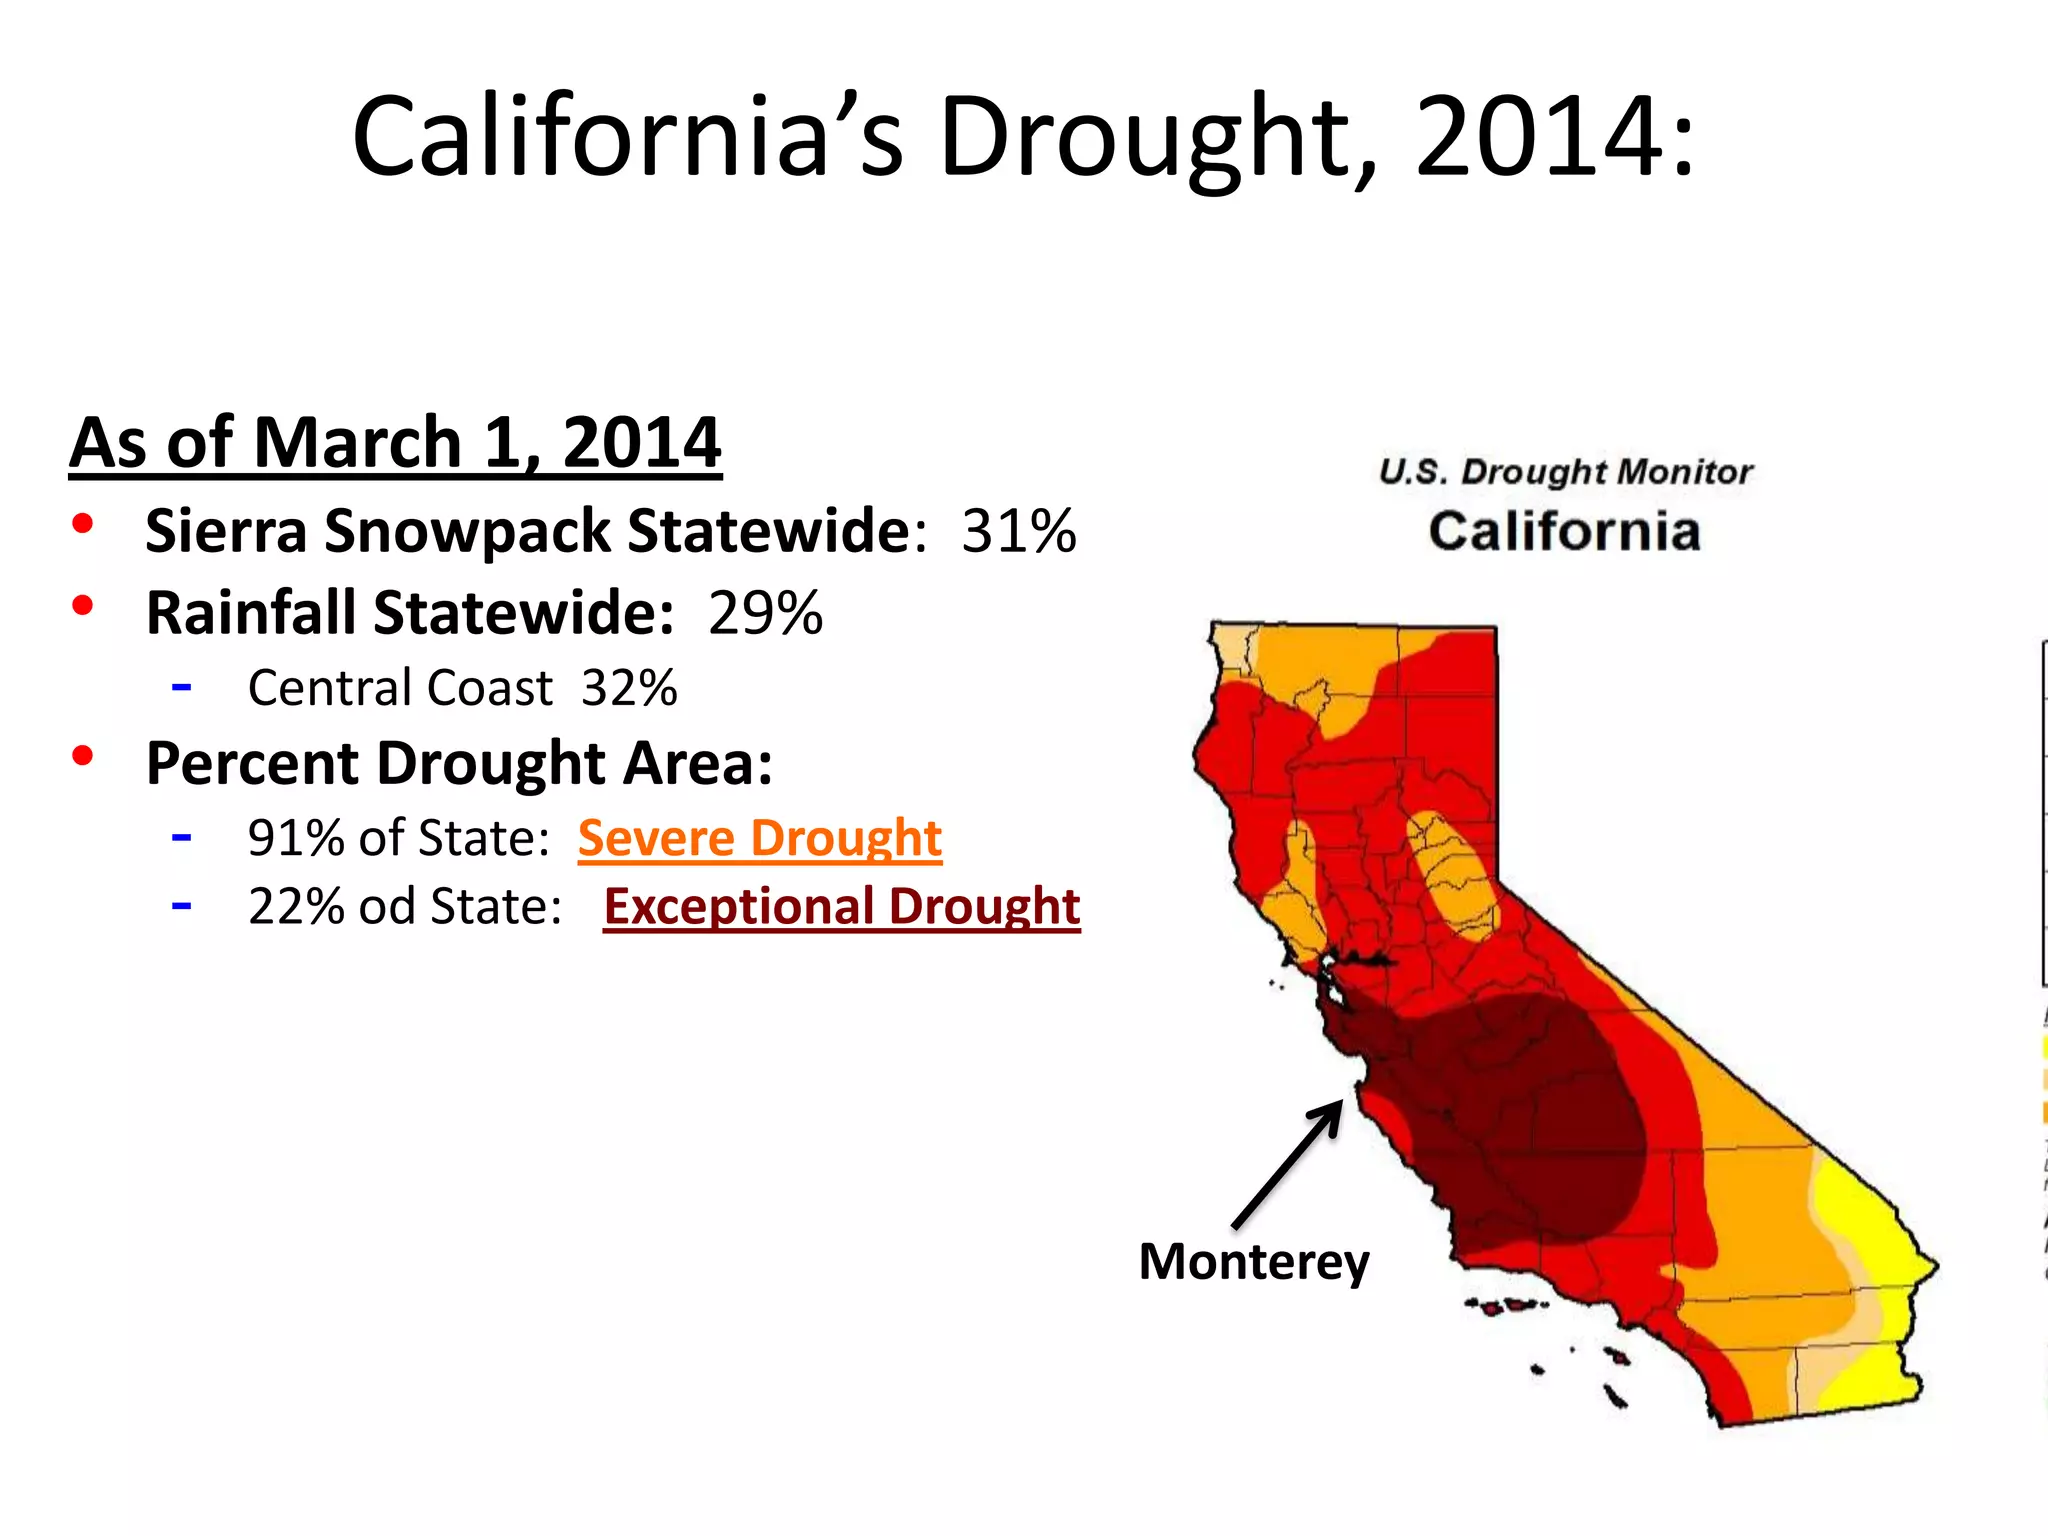
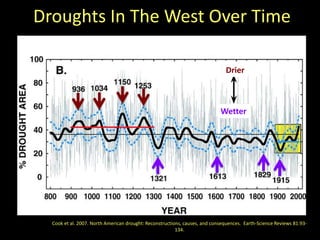
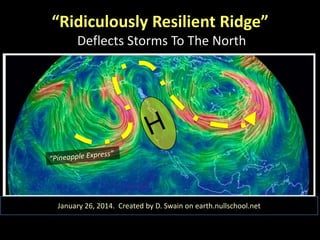
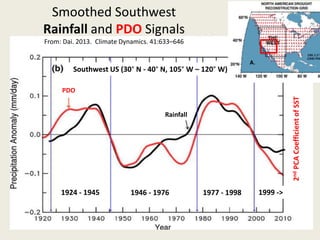
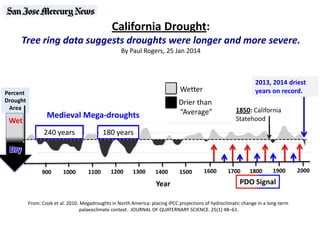
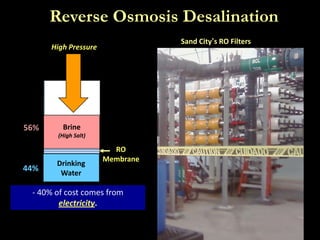
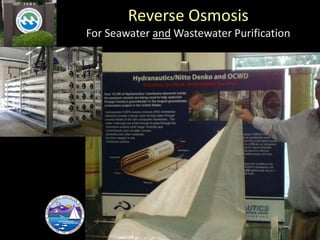
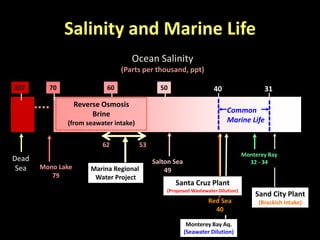
California’s Drought, 2014:
Monterey
As of March 1, 2014
• Sierra Snowpack Statewide: 31%
• Rainfall Statewide: 29%
- Central Coast 32%
• Percent Drought Area:
- 91% of State: Severe Drought
- 22% od State: Exceptional Drought
Droughts In The West Over Time
Cook et al. 2007. North American drought: Reconstructions, causes, and consequences. Earth-Science Reviews 81:93-
134.
Drier
Wetter
“Ridiculously Resilient Ridge”
Deflects Storms To The North
January 26, 2014. Created by D. Swain on earth.nullschool.net
-3
-1
1
3
1920 1930 1940 1950 1960 1970 1980 1990 2000 2010
Pacific Decadal Oscillation and Central Coast Rainfall
(1920 – 2014)
Year
SeaSurfaceAnomaly
Data From: PDO Index, University of Washington; Central Coast Rainfall, Western Regional Climate Center
1977 - 19981946 - 19761924 - 1945 1999 - 2014
CentralCoastRainfall
(Inches)
Warm
Warm
Cool Cool
0
10
20
30
40
50
1920 1930 1940 1950 1960 1970 1980 1990 2000 2010
19981983
El Nino
Severe Drought
(1976 -77)
Dust Bowl
(1924 – 35)
Severe Drought
(1924)
2013
Severe Drought
(2013 - 2014)
PDO
Rainfall
Smoothed Southwest
Rainfall and PDO Signals
From: Dai. 2013. Climate Dynamics. 41:633–646
1977 - 19981946 - 19761924 - 1945 1999 ->
Southwest US (30° N - 40° N, 105° W – 120° W)
2ndPCACoefficientofSST
California Drought:
Tree ring data suggests droughts were longer and more severe.
By Paul Rogers, 25 Jan 2014
Medieval Mega-droughts
240 years 180 years
900
Percent
Drought
Area 1850: California
Statehood
Wetter
Drier than
“Average”
2013, 2014 driest
years on record.
1000 1100 13001200 1400 17001500 1600 1800 1900 2000
From: Cook et al. 2010. Megadroughts in North America: placing IPCC projections of hydroclimatic change in a long-term
palaeoclimate context. JOURNAL OF QUATERNARY SCIENCE. 25(1) 48–61.
Year PDO Signal
20% -
60% -
40% -
Wet
Dry
Reverse Osmosis Desalination
Seawater
(or brackish)
RO
Membrane
Empty
Brine
(High Salt)
High Pressure
Drinking
Water
Sand City’s RO Filters
- 40% of cost comes from
electricity.
56%
44%
Reverse Osmosis
For Seawater and Wastewater Purification
Monterey Bay Aq.
(Seawater Dilution)
Red Sea
40
Salinity and Marine Life
31405070 60
Ocean Salinity
(Parts per thousand, ppt)
Common
Marine Life
Dead
Sea
337
Salton Sea
49Mono Lake
79
Reverse Osmosis
Brine
(from seawater intake)
Marina Regional
Water Project
62 53
Sand City Plant
(Brackish Intake)
Monterey Bay
32 - 34
Santa Cruz Plant
(Proposed Wastewater Dilution)
California Market Squid, Doryteuthis opalescens
Photo: L. Zeidberg
Egg Nursery
Brine Plume Movie
Capacity (MGD)
0 - 1
2 - 10
11 - 25
1
2
3
4
6
5
10
7
8
9
Information From: California SWRCB, 4 June 2013
Existing Facilities
1. Duke Energy
0.5 MGD
2. Sand City
0.3 MGD
3. Monterey Bay Aquarium
0.04 MGD
Proposed Facilities
4. Ocean View Plaza
0.03 MGD
6. Deepwater
25 MGD
5. scwd2
2.5 – 15 MGD
Competing Proposals
7. Regional Desal Project (People’s)
10 MGD
8. Cal Am
6 – 9.3 MGD
9. MPWMD
10 MGD
10. SW Desal Vessel (Poseidon)
10 MGD
Total Capacity: 40 – 50 MGD
Peru’s University of Engineering and Technology:
Billboard produces 830 gallons per month
Source: Yahoo News
Monterey Peninsula Herald
May 27, 1932
Monterey Peninsula Herald
May 27, 1932
Carmel River’s Steelhead Trout
Steelhead Trout Fry
May 4, 2012
Steelhead Redd (nest)
May 2, 2012
Photo: F. Emerson
Ocean-run Adult Steelhead

ReebSlides20mar14pptx

  • 1.
    California’s Drought, 2014: Monterey Asof March 1, 2014 • Sierra Snowpack Statewide: 31% • Rainfall Statewide: 29% - Central Coast 32% • Percent Drought Area: - 91% of State: Severe Drought - 22% od State: Exceptional Drought
  • 2.
    Droughts In TheWest Over Time Cook et al. 2007. North American drought: Reconstructions, causes, and consequences. Earth-Science Reviews 81:93- 134. Drier Wetter
  • 3.
    “Ridiculously Resilient Ridge” DeflectsStorms To The North January 26, 2014. Created by D. Swain on earth.nullschool.net
  • 4.
    -3 -1 1 3 1920 1930 19401950 1960 1970 1980 1990 2000 2010 Pacific Decadal Oscillation and Central Coast Rainfall (1920 – 2014) Year SeaSurfaceAnomaly Data From: PDO Index, University of Washington; Central Coast Rainfall, Western Regional Climate Center 1977 - 19981946 - 19761924 - 1945 1999 - 2014 CentralCoastRainfall (Inches) Warm Warm Cool Cool 0 10 20 30 40 50 1920 1930 1940 1950 1960 1970 1980 1990 2000 2010 19981983 El Nino Severe Drought (1976 -77) Dust Bowl (1924 – 35) Severe Drought (1924) 2013 Severe Drought (2013 - 2014)
  • 5.
    PDO Rainfall Smoothed Southwest Rainfall andPDO Signals From: Dai. 2013. Climate Dynamics. 41:633–646 1977 - 19981946 - 19761924 - 1945 1999 -> Southwest US (30° N - 40° N, 105° W – 120° W) 2ndPCACoefficientofSST
  • 6.
    California Drought: Tree ringdata suggests droughts were longer and more severe. By Paul Rogers, 25 Jan 2014 Medieval Mega-droughts 240 years 180 years 900 Percent Drought Area 1850: California Statehood Wetter Drier than “Average” 2013, 2014 driest years on record. 1000 1100 13001200 1400 17001500 1600 1800 1900 2000 From: Cook et al. 2010. Megadroughts in North America: placing IPCC projections of hydroclimatic change in a long-term palaeoclimate context. JOURNAL OF QUATERNARY SCIENCE. 25(1) 48–61. Year PDO Signal 20% - 60% - 40% - Wet Dry
  • 7.
    Reverse Osmosis Desalination Seawater (orbrackish) RO Membrane Empty Brine (High Salt) High Pressure Drinking Water Sand City’s RO Filters - 40% of cost comes from electricity. 56% 44%
  • 8.
    Reverse Osmosis For Seawaterand Wastewater Purification
  • 9.
    Monterey Bay Aq. (SeawaterDilution) Red Sea 40 Salinity and Marine Life 31405070 60 Ocean Salinity (Parts per thousand, ppt) Common Marine Life Dead Sea 337 Salton Sea 49Mono Lake 79 Reverse Osmosis Brine (from seawater intake) Marina Regional Water Project 62 53 Sand City Plant (Brackish Intake) Monterey Bay 32 - 34 Santa Cruz Plant (Proposed Wastewater Dilution)
  • 10.
    California Market Squid,Doryteuthis opalescens Photo: L. Zeidberg Egg Nursery
  • 11.
  • 12.
    Capacity (MGD) 0 -1 2 - 10 11 - 25 1 2 3 4 6 5 10 7 8 9 Information From: California SWRCB, 4 June 2013 Existing Facilities 1. Duke Energy 0.5 MGD 2. Sand City 0.3 MGD 3. Monterey Bay Aquarium 0.04 MGD Proposed Facilities 4. Ocean View Plaza 0.03 MGD 6. Deepwater 25 MGD 5. scwd2 2.5 – 15 MGD Competing Proposals 7. Regional Desal Project (People’s) 10 MGD 8. Cal Am 6 – 9.3 MGD 9. MPWMD 10 MGD 10. SW Desal Vessel (Poseidon) 10 MGD Total Capacity: 40 – 50 MGD
  • 13.
    Peru’s University ofEngineering and Technology: Billboard produces 830 gallons per month Source: Yahoo News
  • 14.
    Monterey Peninsula Herald May27, 1932 Monterey Peninsula Herald May 27, 1932
  • 15.
    Carmel River’s SteelheadTrout Steelhead Trout Fry May 4, 2012 Steelhead Redd (nest) May 2, 2012 Photo: F. Emerson Ocean-run Adult Steelhead