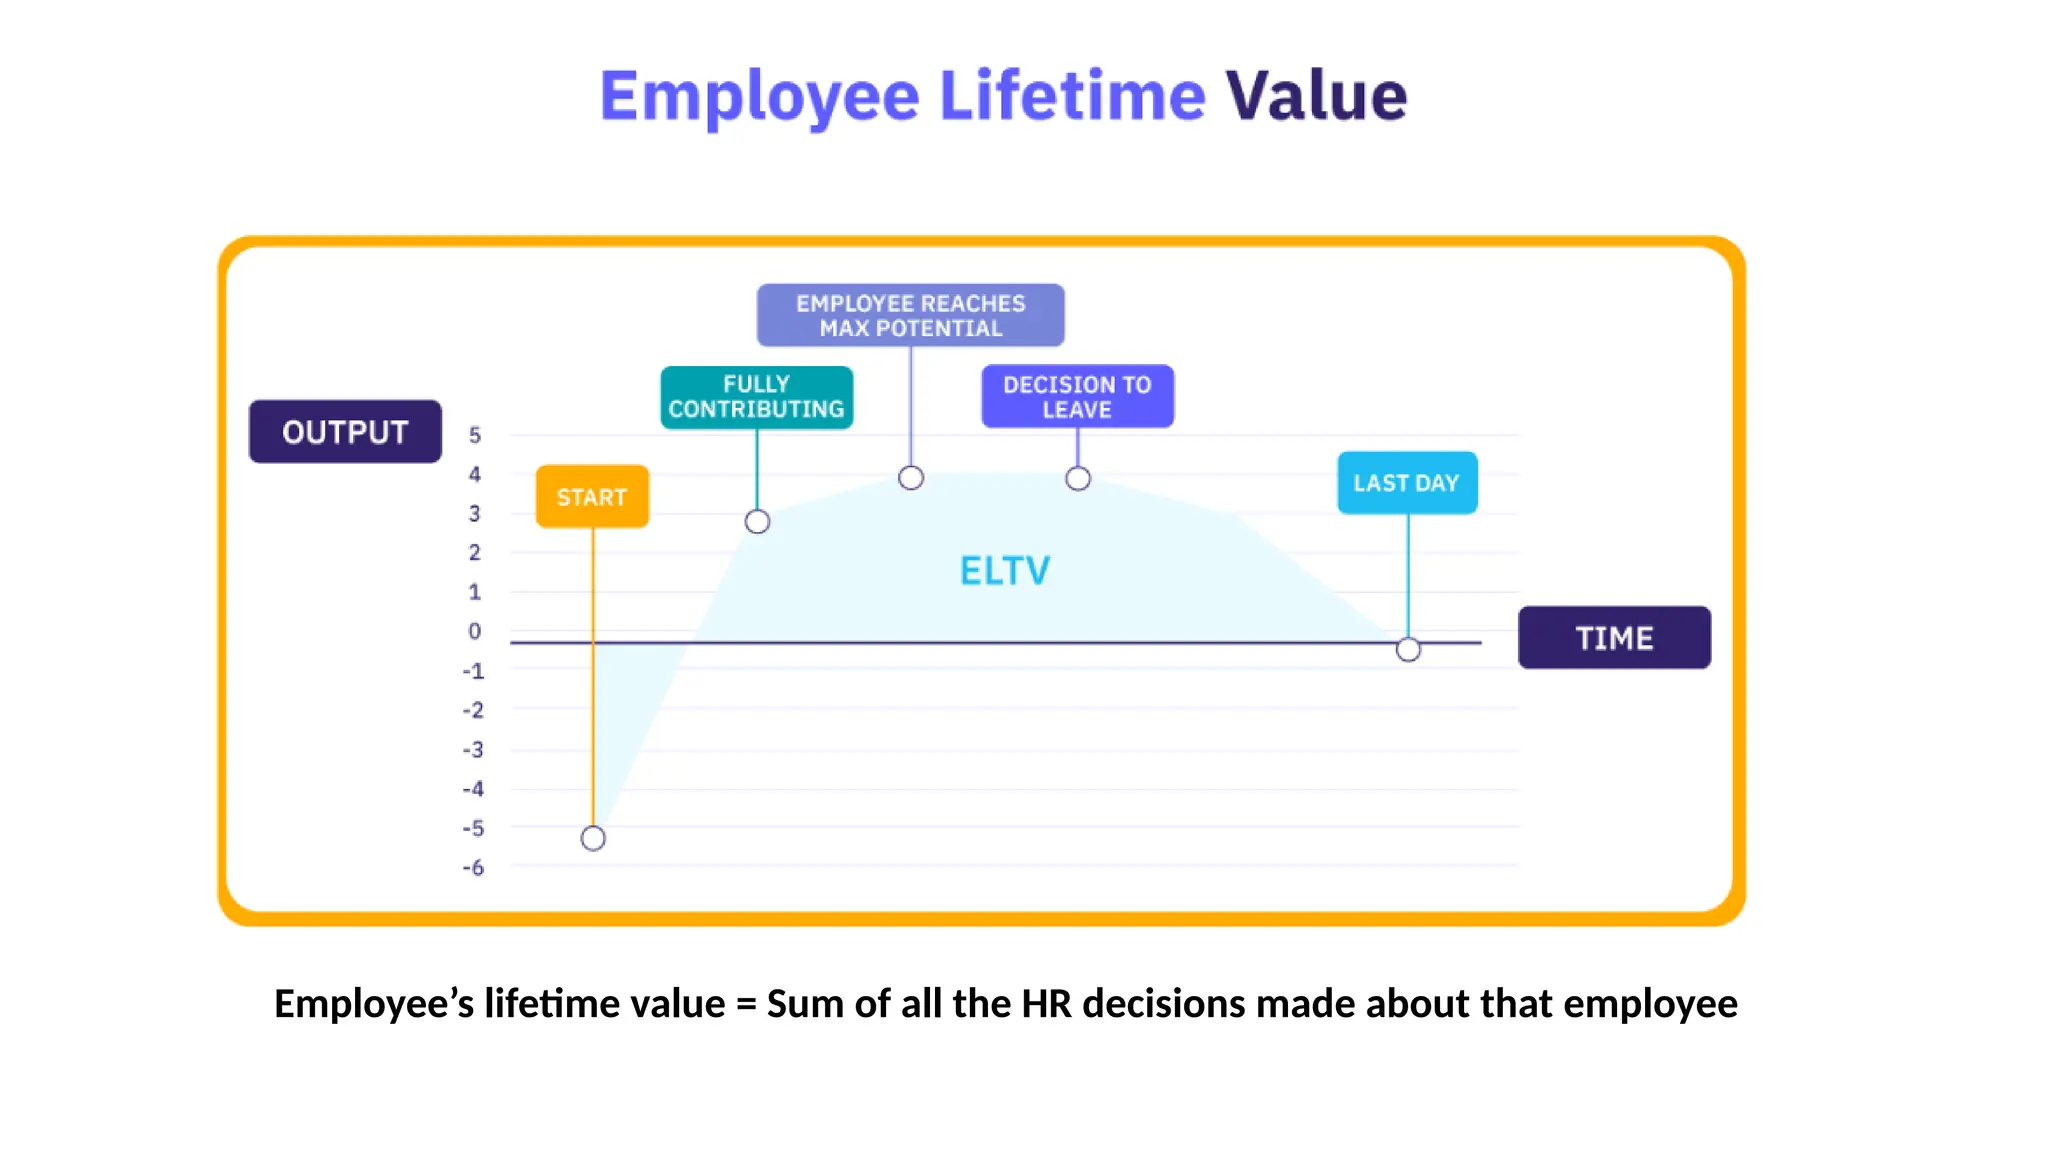
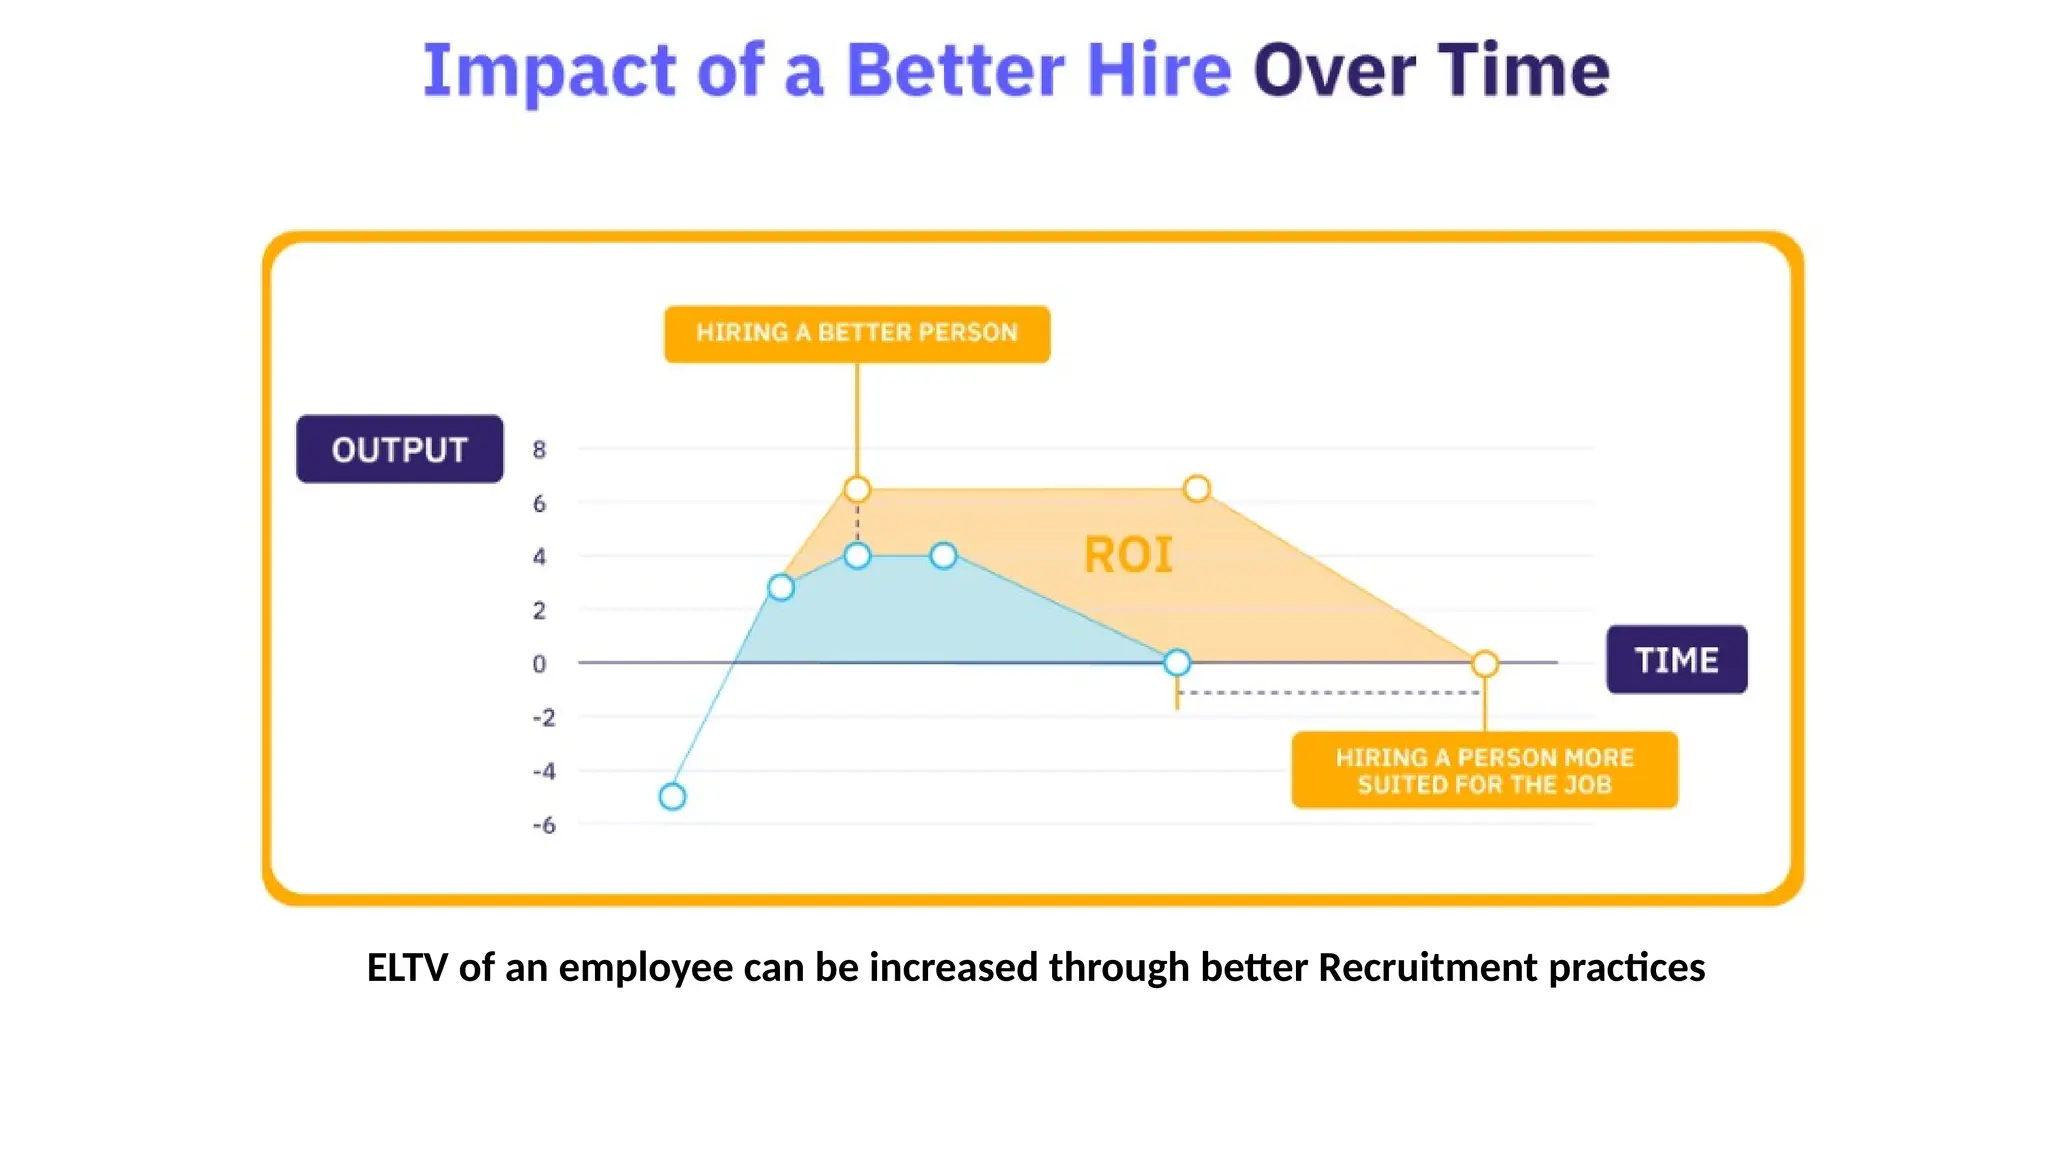
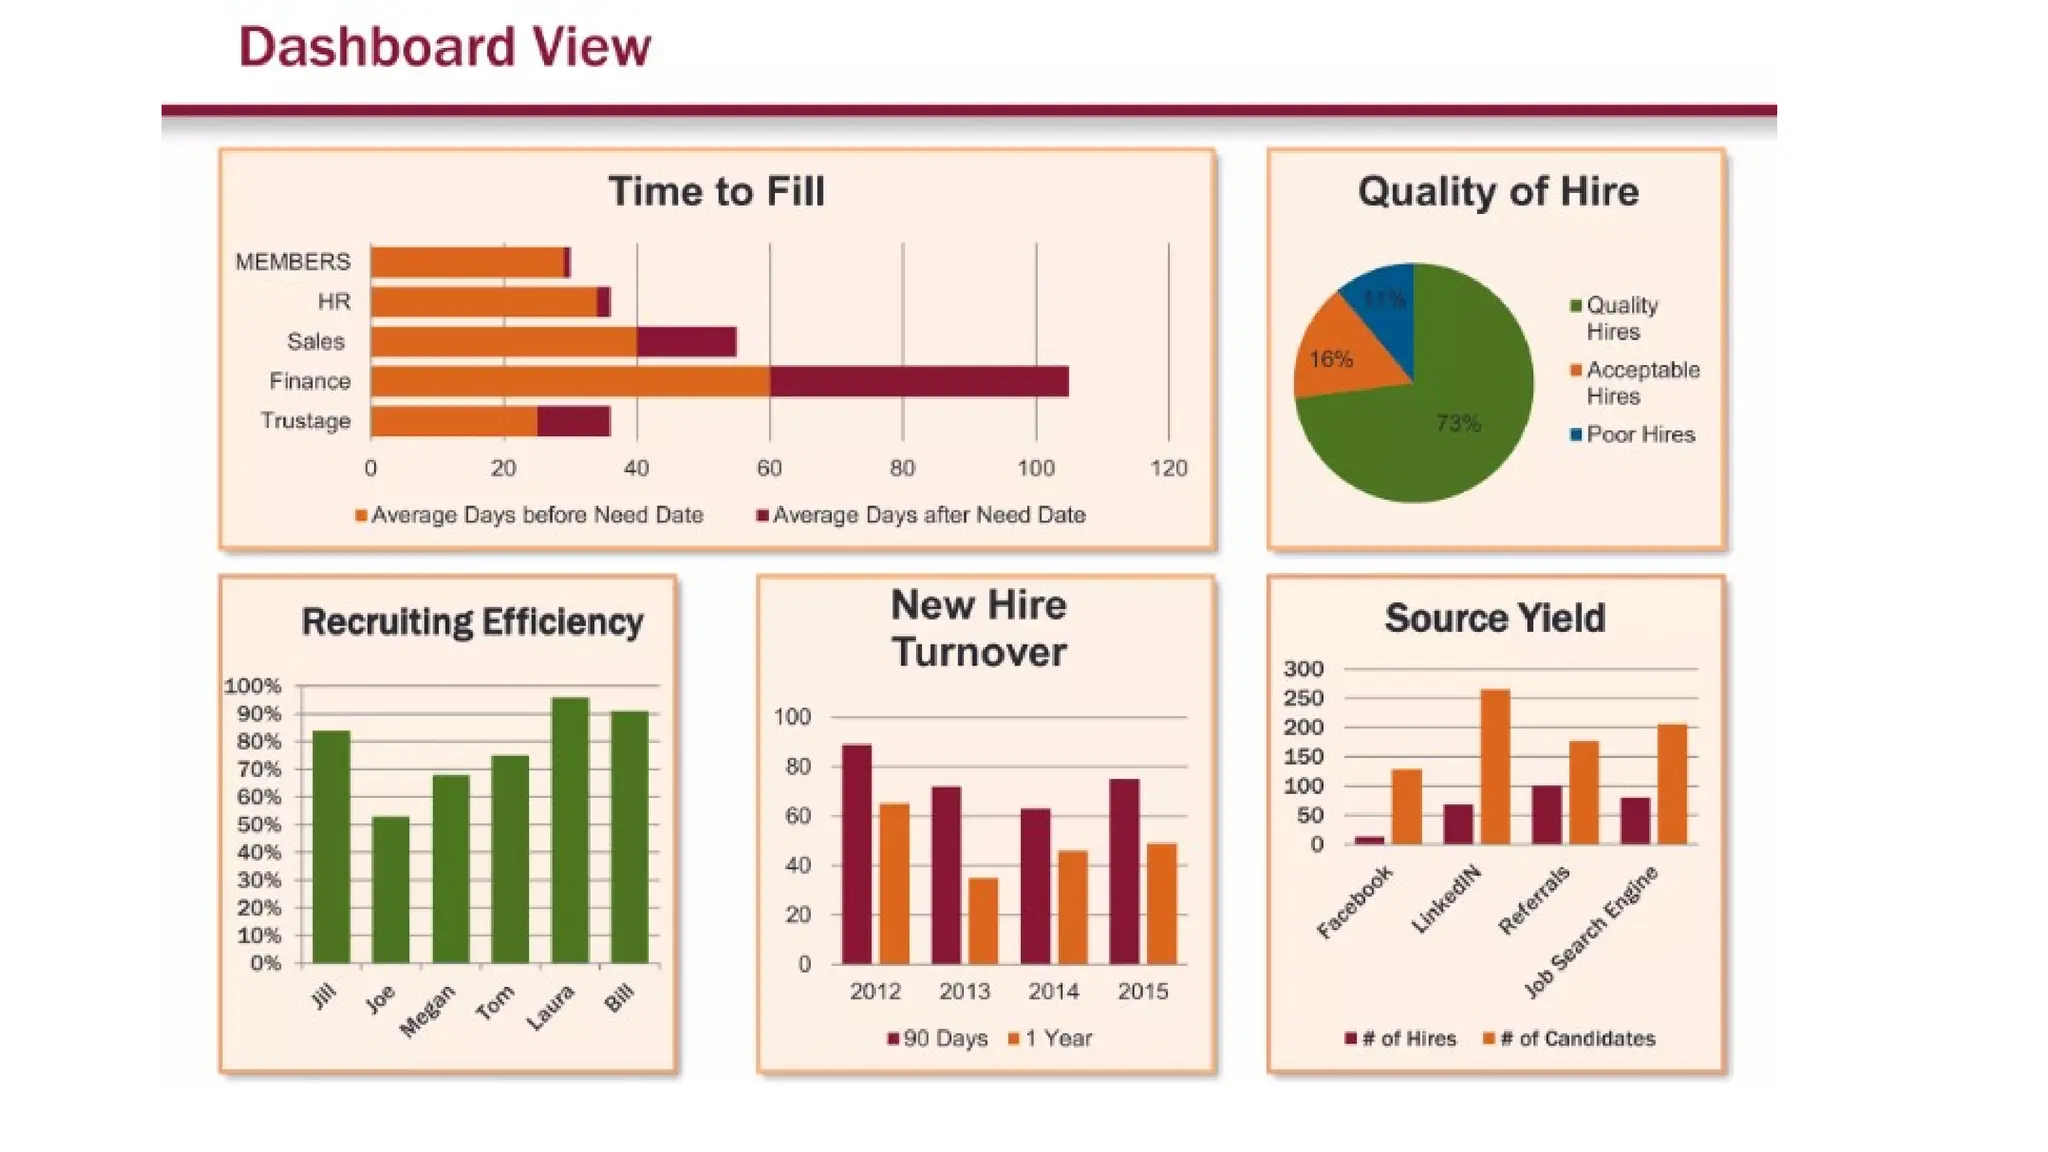
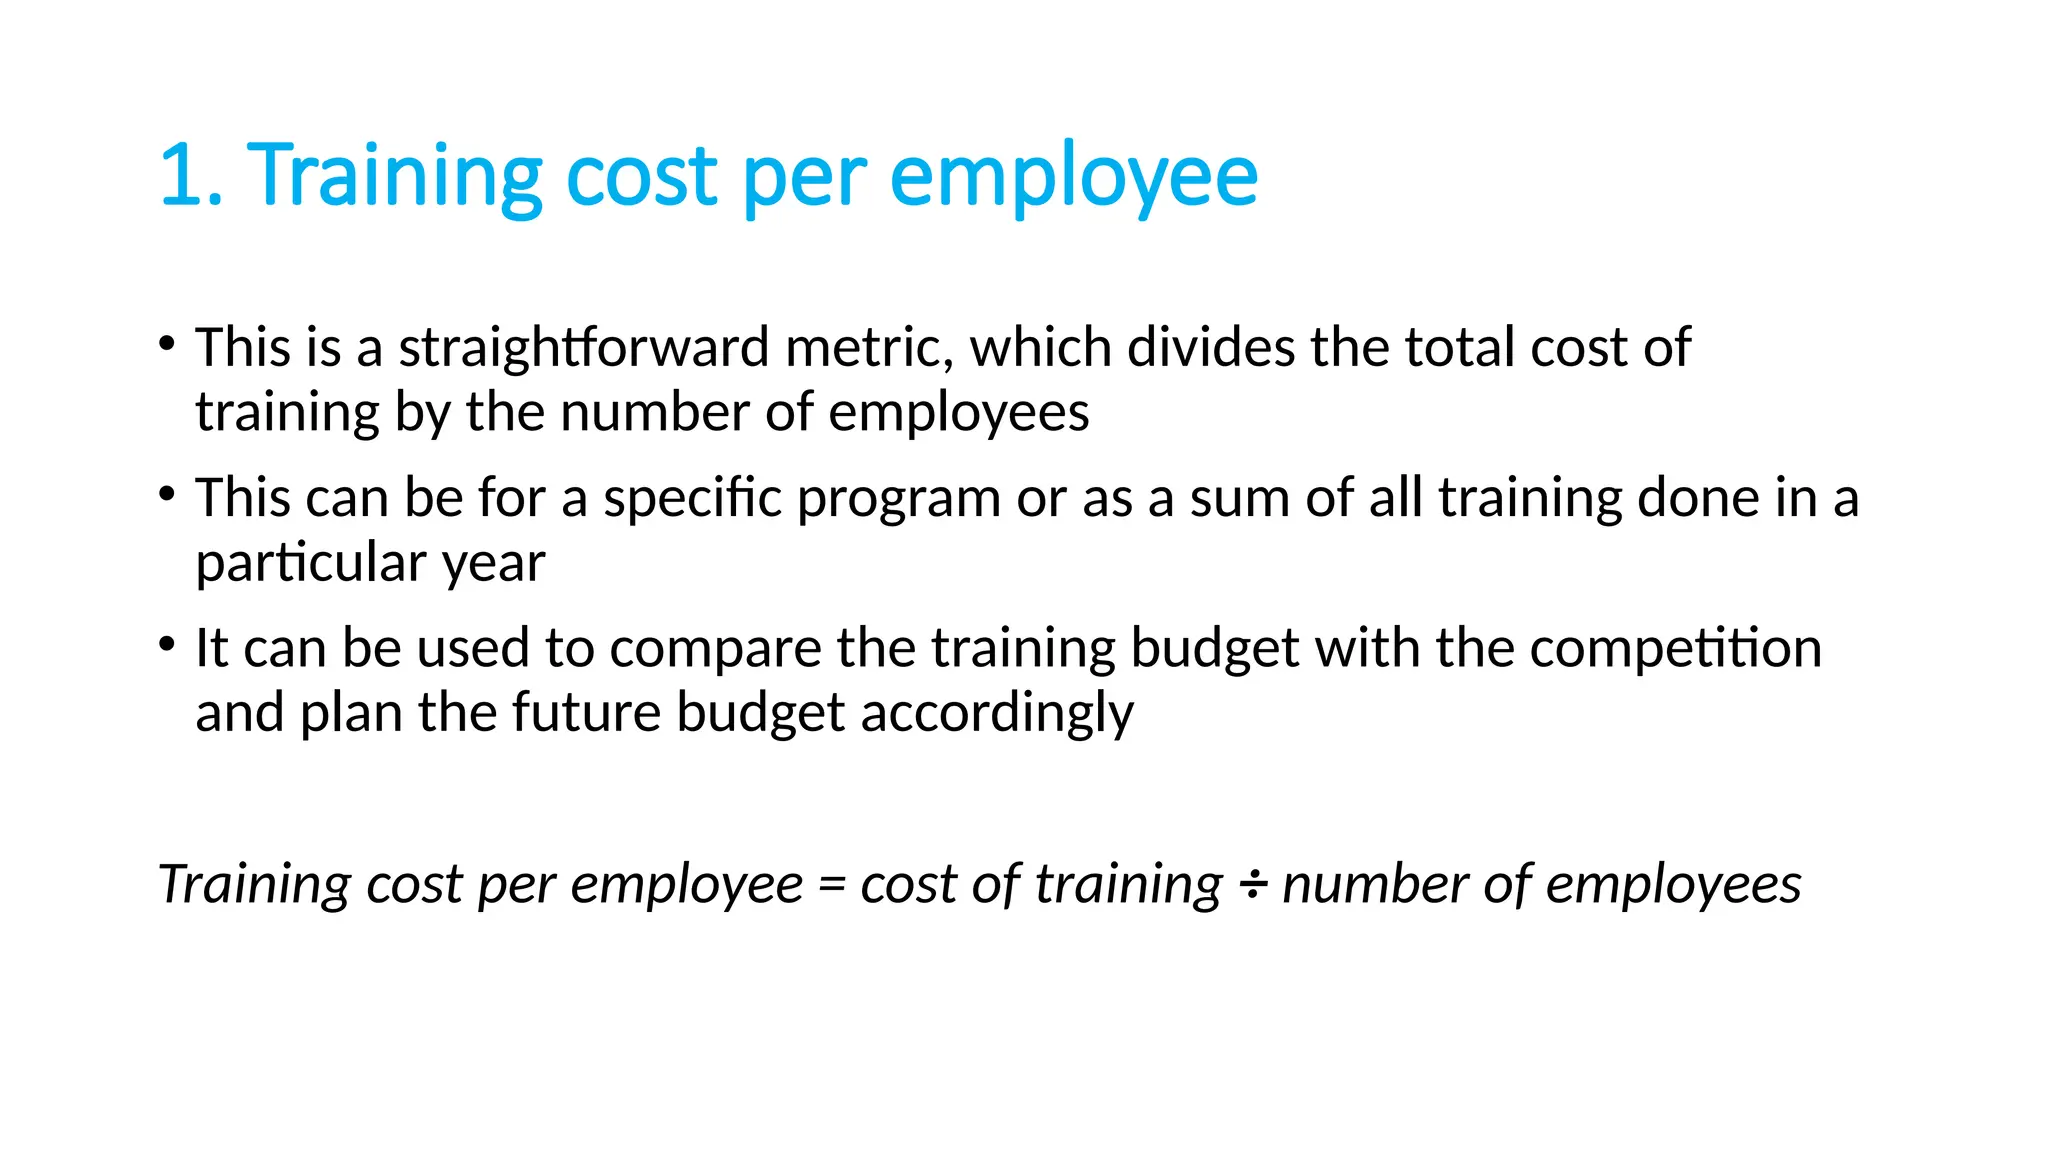
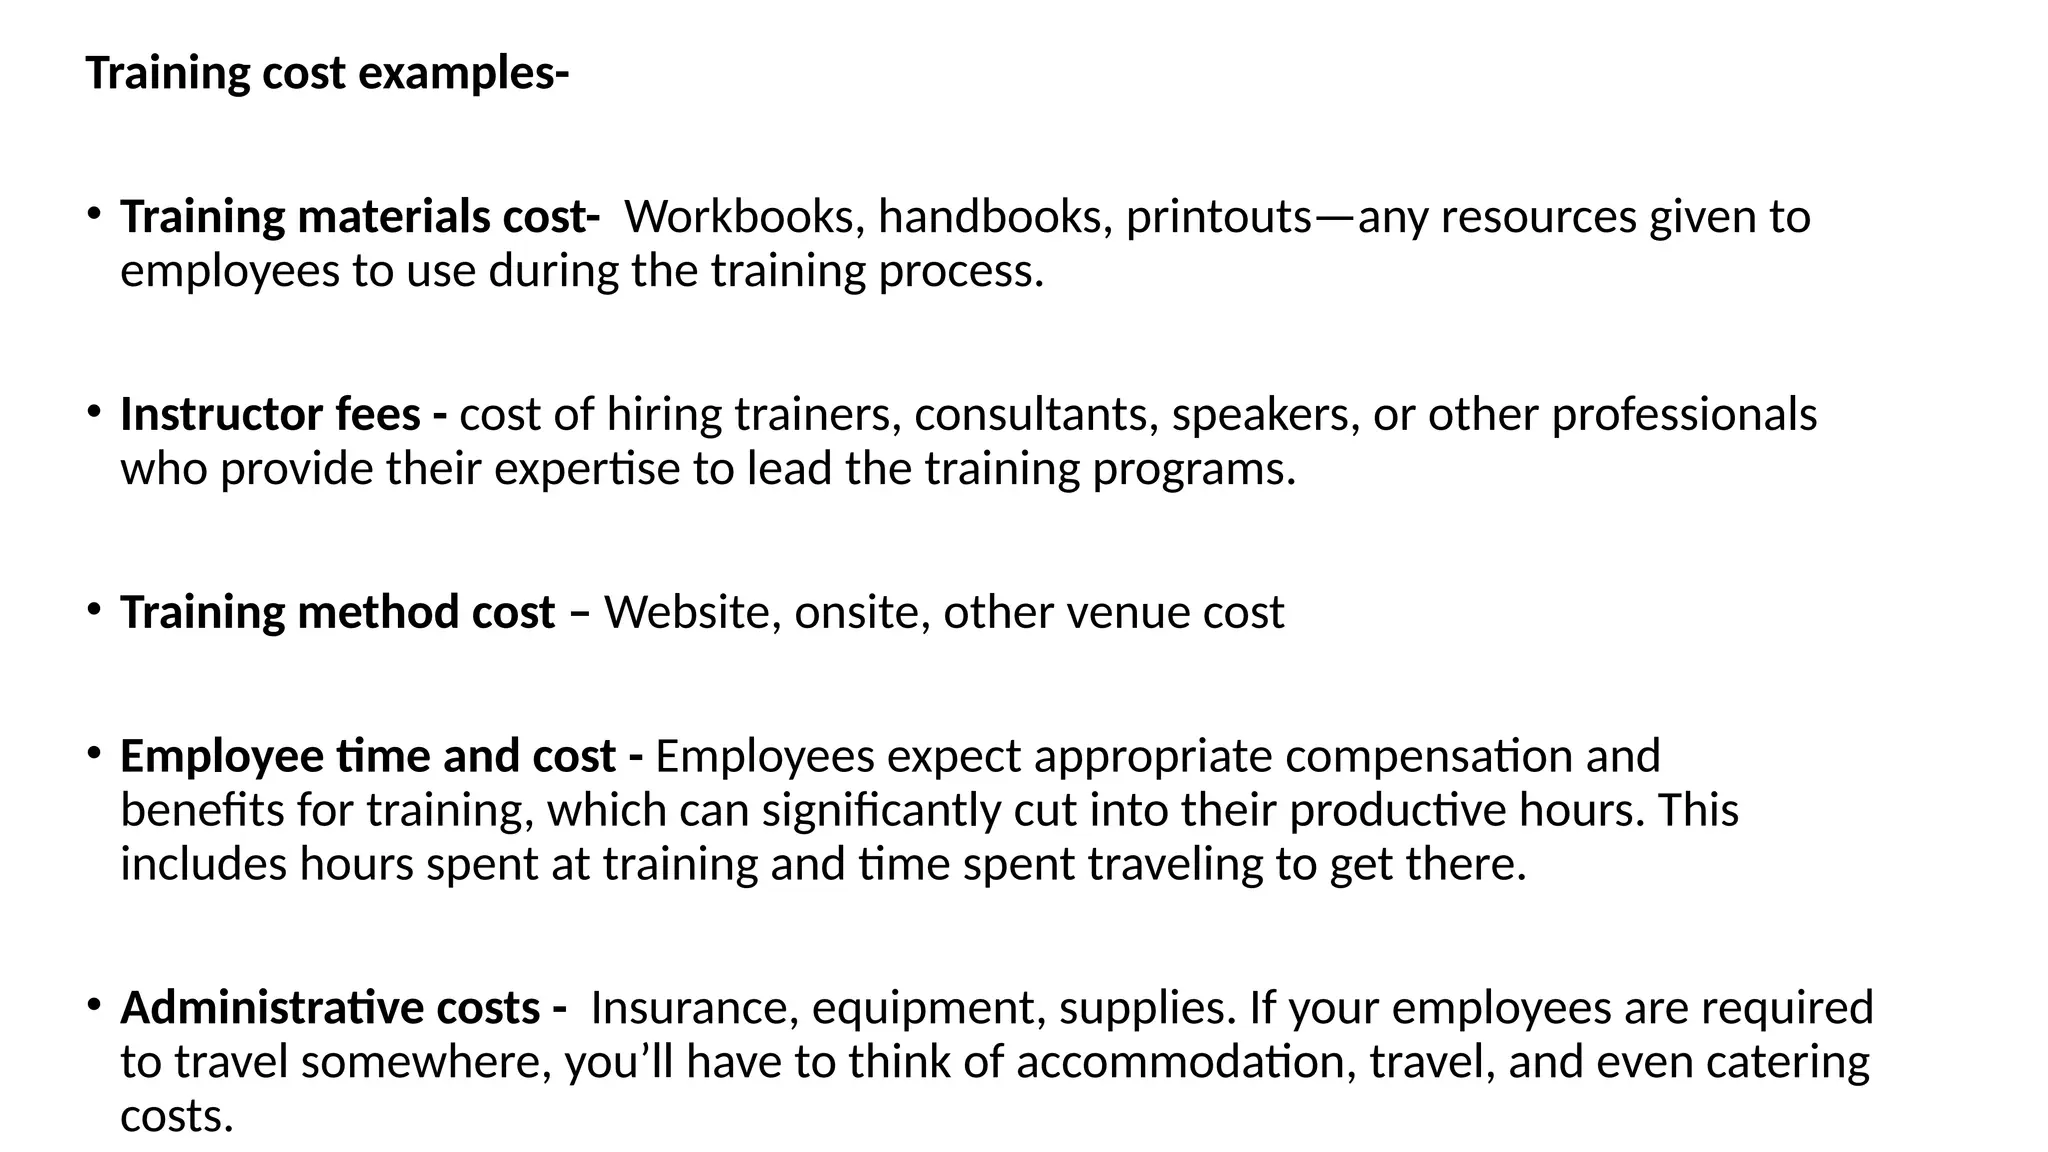
HR Metrics
HR Analytics
Session 9-10
I. Recruitment Metrics
Employee’s lifetime value = Sum of all the HR decisions made about that employee
ELTV of an employee can be increased through better Recruitment practices
1. Percentage of open positions
• It can be applied to specific departments or even to the entire organization
• A high percentage of open positions in a specific department can mean
those positions are in high demand
• It can also mean that there’s currently a low supply of workers in the
market for those positions
• This metric can offer insights into the current trends and changes
happening in the labor market, which can be valuable when building the
talent acquisition strategy
% of open positions = Total number of open positions / Total number of
positions in the department or organization
2. Sourcing channel effectiveness
• By comparing the percentage of applications with the percentage of impressions
of the job postings
• Google Analytics services can track the sourcing channel of the people viewing
the job opening on the company’s website. For example, maybe the people
coming from LinkedIn don’t apply, but the people coming from Facebook do.
• Having a clear understanding of which channel works and which doesn’t, it will be
possible to double down on the channels that are bringing you the most ROI and
decrease spending on those that aren’t
3. Sourcing channel cost
• Cost efficiency of different sourcing channels by including the amount of
money spent on advertisements on those platforms
Sourcing channel cost = Ad spend per platform / Number of successful
applicants per platform
4. Applicants per opening
• It gauges the job’s popularity.
• A large number of applicants could indicate a high demand for jobs in that
particular area or a job description that’s too broad.
• The number of applicants per opening is not necessarily an indicator of the
number of qualified candidates.
• By narrowing the job description and including a number of ‘hard’ criteria, the
number of applicants can be reduced without reducing the number of suitable
candidates
5. Qualified candidates per hire
• It is a metric that measures the average number of qualified candidates found in
the hiring process for a specific job category or location
• A number that's significantly lower than average could mean that you're not
attracting enough talent.
• A number that's much higher than average could mean that your hiring process is
taking too long. This could cause you to lose top candidates to competitors.
Candidates per hire = Total Interviews ÷ Total Hires or Offers Made
6. Interviews to offer and interviews to hire
In general, these two metrics are useful because they show you the average number of hours
spent on interviewing in the hiring process.
a) Interviews to offer
• The number of interviews your hiring team conducts with candidates to extend one offer.
Interviews to offer ratio = (total number of sent offers ÷ total number of conducted
interviews) X 100%
b) Interviews per hire
• The number of interviews your hiring team conducts with candidates before a hire is made.
• It doesn’t take into account rejected job offers. If the offer acceptance rate is high, then the
two metrics will be roughly the same
Interviews per hire ratio = (total number of interviews ÷ total number of hires) X 100%
7. Quality of hire
• An indicator of the first-year performance of a candidate.
• Candidates who receive high performance ratings are indicative of hiring success, while the opposite holds for
candidates with low performance ratings
a) Pre-hire measures
i) Source Yield
• It enables you to measure each source’s value to focus spending on those applicant sources with the best return
on your recruiting investment.
Source Yield Ratio = Number of leads from source ÷ Number of candidates invited to interview
ii) Application completion rate
• It shows the number of candidates who started a job application and finished it.
• It can be also termed as the Applicant drop-off rate”, ie. the share of candidates who did not finish the
application.
• Many large corporate firms require candidates to manually input their entire CV in their systems before they
can apply for a job. The drop-off in this process is indicative of problems, e.g. web browser incompatibility
with the application system or a non-user-friendly interface.
iii) Time to Fill
• It is an internal recruiting efficiency measure usually the number of days between the
approval of a job requisition and the date the candidate accepts an offer.
• It is one of the measures cited in ISO 30414 guidelines.
• It measures the entire process from the recruiting perspective.
Time to Fill = net workdays(offer acceptance – requisition date)
iv) Time to Hire
• It is the number of days a candidate is in the pipeline, from application to acceptance.
• While time to fill focuses on recruiting efficiency, time to hire assesses the candidate
experience.
• Both measures have a critical dependency—the number of candidates suitable for the job.
Time to Hire = Date offer accepted – Application date
v) Hiring Velocity
• It measures the percentage of jobs filled on time.
• The time it takes to recruit for different positions varies, so you should plan what “on time”
means for each role.
Hiring Velocity = (Number of on-time hires ÷ Total hires) × 100%
vi) Cost per Hire
• It doesn’t take into account that cost and time can vary by role.
• One should also consider that some positions are critical to the business, so their cost can fall
outside normal parameters
Cost per Hire = Sum of recruiting costs (internal + external) ÷ Number of hires
• Some examples of how you can quantify the costs:
a. Time spent by recruiter = Average wages x Hours spent
b. Time spent by manager = Average wages x Hours spent
c. New hire onboarding time = Average wages x Hours spent
vii) Hiring Budget
• It benchmarks recruiting costs to the variable costs of different types of roles.
Hiring Budget = Total recruiting costs ÷ New hire payroll
viii) Candidate Assessment Scores
• It can predict a candidate’s suitability for a job by implementing a job-specific
assessment.
ix) Interview Scores
It can be obtained by using a scoring sheet or scorecard for hiring managers and
interviewers to grade candidates. The process requires a consistent rating system with
validated criteria and questions.
Interview Score = Total of scores for each criterion ÷ Number of scores
x) Offer Acceptance Rate
• It can help to identify compensation issues or a problem with communicating salary expectations.
• An early discussion with candidates regarding salary expectations can prevent those issues.
Offer acceptance rate = Number of offers accepted ÷ Number of offers made
xi) Selection ratio
• The selection ratio is very similar to the number of applicants per opening. When there’s
a high number of candidates, the ratio approaches 0
Selection ratio = Number of hired candidates ÷ Total number of candidates
xii) Recruiting Experience Survey
• A survey can be designed to measure the candidate’s experience during the recruiting process to
spot trouble spots at any point.
• It can help to identify communication lags, failure to respond, and failure to provide accessible
information, among other factors.
b) Post-hire measures
i) Time to Productivity
• It is a measure of the number of days from the hire date until the new employee reaches full
productivity
• Problems with time to productivity can uncover issues in the onboarding process, including training
and management support.
Time to Productivity = net workdays(Date of full productivity – Hire date)
ii) Cost of getting to Optimum Productivity Level (OPL)
• It is the total cost involved in getting someone up to speed. This includes things like onboarding cost,
training cost, the cost of supervisors and co-workers involved in on-the-job training, and more. Usually,
a percentage of the employee’s salary is also included in this calculation until they hit 100% OPL.
iii) Probation Review
• A review at the end of the probation period can help assess how well candidates adapted to the new
job or reflect the quality of the onboarding process.
iv) On-boarding Survey
• Asking new employees about the onboarding process, periodically and up to the end of probation, can
help to identify whether the new employees are experiencing challenges in adapting and how well
they are supported during the ramp-up process.
v) Job Fit
• It can be used as a pulse metric to evaluate if the recruitment team are recruiting the right people for
the respective jobs.
• It is a three-step process:
a. Ask the hiring manager: On a scale of 0-10, how much of a fit is this new hire for the job?
b. Ask the new hire: On a scale of 0-10, how much of a fit is this new job for you?
c. Subtract the percentage of great fits (answered 9 or 10) from the percentage of poor fits (0-6)
and multiply by 100.
• If the score is <0, you are hiring more poor fits. If >0, you are hiring more great fits. Zero indicates a
neutral impact on the organization.
vi) Hiring Manager Satisfaction
• A satisfaction survey of hiring managers can identify whether a new hire is a great fit and help you
identify areas for improvement
• It can be subject to hidden bias
vii) Team Performance
• A 360-degree feedback can help you identify new hire performance and team success
viii) Culture Fit Survey
• A culture fit survey can help you determine how well the new employee meshes with your
company’s culture
ix) Promotions
• Many companies rely on an assessment of how quickly new employees are promoted.
• In companies where career progression is the expected norm, how quickly an employee moves up
can indicate job fit
• A generalized formula can be developed in which the organization agrees
on indicators and weights to develop a scorecard.
Quality of Hire = (Indicator 1 % + Indicator 2 % + Indicator 3 %…) ÷ Number
of Indicators
Recruitment funnel effectiveness
• The recruitment process can be seen as a funnel that begins with sourcing and ends
with a signed contract. By measuring the effectiveness of all the different steps in the
funnel, you can specify a yield ratio per step.
Yield ratio = Number of applicants who successfully completed the stage / Total number
of applicants who entered this stage
8. First-year attrition
• There are two types of first-year attrition: managed and unmanaged
• This metric can also be turned around as ‘candidate retention rate’.
i) Managed attrition
• It means that the contract is terminated by the employer.
• It is often an indicator of poor first-year performance or a bad fit with the team
i) Unmanaged attrition
• It means that they leave on their own accord (voluntary turnover)
• It is often an indicator of unrealistic expectations, which cause the candidate to quit
• This could be due to a mismatch between the job description and the actual job, or the job
and/or company has been oversold by the recruiter
9. Recruiter performance metrics
i) E-mail open rate
• It is the percentage of sent emails that candidates open.
E-mail open rate = Number of opened emails / Number of emails delivered
ii) E-mail Response rate
• It measures the percentage of emails that candidates reply to.
Response rate = Number of replies / Number of emails delivered
iii) Interview conversion rate
• It is the percentage of emails that lead to interviews.
Interview conversion rate = Number of candidates interviewed / Number of cold
emails delivered
iv) Fill rate
• It helps the recruitment team determine how many jobs have been filled over a
specific period compared to how many jobs are currently open and work to
minimize the number of open vacancies at any given time.
• The higher your fill rate is, the more it suggests that the recruitment team is
effectively filling vacancies at pace. However, if you also have a low new hire
retention rate, this may suggest that not enough time or care is being spent during
the interview process
• A low fill rate suggests issues in your recruitment strategy and a potential
inefficiency or lack of effectiveness in the recruitment channels being used.
Fill rate = Total number of jobs filled / Total number of job openings
10. Recruitment ROI
• It helps measure the overall effectiveness and financial return of your
recruitment strategies.
• A positive ROI suggests that your recruitment efforts create more
value than they cost. In contrast, a negative ROI indicates that you
spend more on recruitment than the value those activities create.
II. Training Metrics
Advantages of using Training Metrics
1. Financial performance to be measured – Ability to link training metrics to
financial performance metrics (e.g., ROI, liquidity, profitability measures)
2. To track performance over time – Using the same metrics and KPIs allows one
to observe any noticeable improvement as a direct result of their training
efforts
3. Benchmark training to competitors – Using consistent metrics allows one to
compare their training program to competitors and measure whether they are
underspending or overspending
4. Communicate transparently to employees – One can show employees the
value of training and the value of the investment made in them
1. Training cost per employee
• This is a straightforward metric, which divides the total cost of
training by the number of employees
• This can be for a specific program or as a sum of all training done in a
particular year
• It can be used to compare the training budget with the competition
and plan the future budget accordingly
Training cost per employee = cost of training ÷ number of employees
Training cost examples-
• Training materials cost- Workbooks, handbooks, printouts—any resources given to
employees to use during the training process.
• Instructor fees - cost of hiring trainers, consultants, speakers, or other professionals
who provide their expertise to lead the training programs.
• Training method cost – Website, onsite, other venue cost
• Employee time and cost - Employees expect appropriate compensation and
benefits for training, which can significantly cut into their productive hours. This
includes hours spent at training and time spent traveling to get there.
• Administrative costs - Insurance, equipment, supplies. If your employees are required
to travel somewhere, you’ll have to think of accommodation, travel, and even catering
costs.
2. Learner engagement
• Learner engagement measures the amount of time and effort learners invest into the learning
process.
• This may include time spent on modules or courses
• The more time a learner spends on the learning platform and interacting with its various features,
the more engaged they are.
• However, this may not always be true, as in some cases, learners are just ‘clicking’ through the
modules without learning.
• That’s why, to measure engagement, it should be combined with other metrics such as course
completion, satisfaction rating, and employee performance.
3. Training Return on Investment
• Return on investment (ROI) of training measures the efficiency or profitability
of the money you put into the training.
Training Return on Investment = (Return of Benefit – Investment Cost) ÷
Investment Cost x 100
4. Training experience satisfaction
• This is one of the most popular training metrics to measure and can
usually be found in a post-training survey.
• It is used to gauge how satisfied learners are with the training they
received.
• One can use the Score (1 to 10) with the question, “How likely is it
that you would recommend this training session to a friend or peer”
to gather feedback and measure training experience satisfaction.
5. Operational efficiency
• Training should increase operational efficiency if it is done effectively and
addresses the specific skill gaps needed to optimize processes in the
workplace.
• For example, a employee might currently be missing 40% of their deadlines.
If an employee training program is deployed to address this specific issue,
there should be a noticeable improvement (e.g., a decrease to 20% or 5%
over time).
• Operational metrics such as ‘time to repair’, ‘time to recover,’ ‘time to
failure,’ ‘cost-per-click’ can be measured before and after training to note
any efficiency improvement.
6. Course enrolment data
• This is simply to measure how many students enroll in the course.
• One can communicate the training program to employees using
different messages to measure the effectiveness of different images
and email subject headers used when presenting the course.
• It also specifies if the training deployed is appropriate for employees.
One can do small things to improve course enrollment (such as
encouraging managers to promote the course to their teams) and see
how it improves over time.
7. Course completion rate
• The course completion rate gives you an indication of how much of
the course a student completed.
• There are creative ways to encourage course completion, such as
gamification and producing bite-sized content.
8. Learner drop off rate
• This is again an indication of how many learners either started a
course and did not complete it or decided to leave the course.
• It’s a measure of the quality of the content of the training materials,
or it may even indicate browser compatibility issues in online learning
platforms.
• Ideally, identification should be done for the stages where the
learners dropped off. It will help in understanding if there are
problems with a particular piece of the training.
9. Assessment pass rate and Assessment scores
• The assessment pass rate measures how many learners passed or
failed a course taken.
• It could indicate that the course assessment was difficult, or it may
have been purposely done in this way to filter out the best students.
• Sometimes, passing an assessment is compulsory, and students need
to retake it until they pass the course.
10. Employee performance post-training
• Employee performance post-training looks at the improvement of
employee performance overtime related to the training.
• The impact of training may be immediately noticeable or only after a
more extended period of time, dependent on the complexity of the
skill being trained on.

HR Metrices and formulas with yeah dashboad

  • 1.
  • 2.
  • 4.
    Employee’s lifetime value= Sum of all the HR decisions made about that employee
  • 5.
    ELTV of anemployee can be increased through better Recruitment practices
  • 6.
    1. Percentage ofopen positions • It can be applied to specific departments or even to the entire organization • A high percentage of open positions in a specific department can mean those positions are in high demand • It can also mean that there’s currently a low supply of workers in the market for those positions • This metric can offer insights into the current trends and changes happening in the labor market, which can be valuable when building the talent acquisition strategy % of open positions = Total number of open positions / Total number of positions in the department or organization
  • 7.
    2. Sourcing channeleffectiveness • By comparing the percentage of applications with the percentage of impressions of the job postings • Google Analytics services can track the sourcing channel of the people viewing the job opening on the company’s website. For example, maybe the people coming from LinkedIn don’t apply, but the people coming from Facebook do. • Having a clear understanding of which channel works and which doesn’t, it will be possible to double down on the channels that are bringing you the most ROI and decrease spending on those that aren’t
  • 8.
    3. Sourcing channelcost • Cost efficiency of different sourcing channels by including the amount of money spent on advertisements on those platforms Sourcing channel cost = Ad spend per platform / Number of successful applicants per platform
  • 9.
    4. Applicants peropening • It gauges the job’s popularity. • A large number of applicants could indicate a high demand for jobs in that particular area or a job description that’s too broad. • The number of applicants per opening is not necessarily an indicator of the number of qualified candidates. • By narrowing the job description and including a number of ‘hard’ criteria, the number of applicants can be reduced without reducing the number of suitable candidates
  • 10.
    5. Qualified candidatesper hire • It is a metric that measures the average number of qualified candidates found in the hiring process for a specific job category or location • A number that's significantly lower than average could mean that you're not attracting enough talent. • A number that's much higher than average could mean that your hiring process is taking too long. This could cause you to lose top candidates to competitors. Candidates per hire = Total Interviews ÷ Total Hires or Offers Made
  • 11.
    6. Interviews tooffer and interviews to hire In general, these two metrics are useful because they show you the average number of hours spent on interviewing in the hiring process. a) Interviews to offer • The number of interviews your hiring team conducts with candidates to extend one offer. Interviews to offer ratio = (total number of sent offers ÷ total number of conducted interviews) X 100% b) Interviews per hire • The number of interviews your hiring team conducts with candidates before a hire is made. • It doesn’t take into account rejected job offers. If the offer acceptance rate is high, then the two metrics will be roughly the same Interviews per hire ratio = (total number of interviews ÷ total number of hires) X 100%
  • 12.
    7. Quality ofhire • An indicator of the first-year performance of a candidate. • Candidates who receive high performance ratings are indicative of hiring success, while the opposite holds for candidates with low performance ratings a) Pre-hire measures i) Source Yield • It enables you to measure each source’s value to focus spending on those applicant sources with the best return on your recruiting investment. Source Yield Ratio = Number of leads from source ÷ Number of candidates invited to interview ii) Application completion rate • It shows the number of candidates who started a job application and finished it. • It can be also termed as the Applicant drop-off rate”, ie. the share of candidates who did not finish the application. • Many large corporate firms require candidates to manually input their entire CV in their systems before they can apply for a job. The drop-off in this process is indicative of problems, e.g. web browser incompatibility with the application system or a non-user-friendly interface.
  • 13.
    iii) Time toFill • It is an internal recruiting efficiency measure usually the number of days between the approval of a job requisition and the date the candidate accepts an offer. • It is one of the measures cited in ISO 30414 guidelines. • It measures the entire process from the recruiting perspective. Time to Fill = net workdays(offer acceptance – requisition date) iv) Time to Hire • It is the number of days a candidate is in the pipeline, from application to acceptance. • While time to fill focuses on recruiting efficiency, time to hire assesses the candidate experience. • Both measures have a critical dependency—the number of candidates suitable for the job. Time to Hire = Date offer accepted – Application date
  • 14.
    v) Hiring Velocity •It measures the percentage of jobs filled on time. • The time it takes to recruit for different positions varies, so you should plan what “on time” means for each role. Hiring Velocity = (Number of on-time hires ÷ Total hires) × 100% vi) Cost per Hire • It doesn’t take into account that cost and time can vary by role. • One should also consider that some positions are critical to the business, so their cost can fall outside normal parameters Cost per Hire = Sum of recruiting costs (internal + external) ÷ Number of hires • Some examples of how you can quantify the costs: a. Time spent by recruiter = Average wages x Hours spent b. Time spent by manager = Average wages x Hours spent c. New hire onboarding time = Average wages x Hours spent
  • 15.
    vii) Hiring Budget •It benchmarks recruiting costs to the variable costs of different types of roles. Hiring Budget = Total recruiting costs ÷ New hire payroll viii) Candidate Assessment Scores • It can predict a candidate’s suitability for a job by implementing a job-specific assessment. ix) Interview Scores It can be obtained by using a scoring sheet or scorecard for hiring managers and interviewers to grade candidates. The process requires a consistent rating system with validated criteria and questions. Interview Score = Total of scores for each criterion ÷ Number of scores
  • 16.
    x) Offer AcceptanceRate • It can help to identify compensation issues or a problem with communicating salary expectations. • An early discussion with candidates regarding salary expectations can prevent those issues. Offer acceptance rate = Number of offers accepted ÷ Number of offers made xi) Selection ratio • The selection ratio is very similar to the number of applicants per opening. When there’s a high number of candidates, the ratio approaches 0 Selection ratio = Number of hired candidates ÷ Total number of candidates xii) Recruiting Experience Survey • A survey can be designed to measure the candidate’s experience during the recruiting process to spot trouble spots at any point. • It can help to identify communication lags, failure to respond, and failure to provide accessible information, among other factors.
  • 17.
    b) Post-hire measures i)Time to Productivity • It is a measure of the number of days from the hire date until the new employee reaches full productivity • Problems with time to productivity can uncover issues in the onboarding process, including training and management support. Time to Productivity = net workdays(Date of full productivity – Hire date) ii) Cost of getting to Optimum Productivity Level (OPL) • It is the total cost involved in getting someone up to speed. This includes things like onboarding cost, training cost, the cost of supervisors and co-workers involved in on-the-job training, and more. Usually, a percentage of the employee’s salary is also included in this calculation until they hit 100% OPL. iii) Probation Review • A review at the end of the probation period can help assess how well candidates adapted to the new job or reflect the quality of the onboarding process.
  • 18.
    iv) On-boarding Survey •Asking new employees about the onboarding process, periodically and up to the end of probation, can help to identify whether the new employees are experiencing challenges in adapting and how well they are supported during the ramp-up process. v) Job Fit • It can be used as a pulse metric to evaluate if the recruitment team are recruiting the right people for the respective jobs. • It is a three-step process: a. Ask the hiring manager: On a scale of 0-10, how much of a fit is this new hire for the job? b. Ask the new hire: On a scale of 0-10, how much of a fit is this new job for you? c. Subtract the percentage of great fits (answered 9 or 10) from the percentage of poor fits (0-6) and multiply by 100. • If the score is <0, you are hiring more poor fits. If >0, you are hiring more great fits. Zero indicates a neutral impact on the organization.
  • 19.
    vi) Hiring ManagerSatisfaction • A satisfaction survey of hiring managers can identify whether a new hire is a great fit and help you identify areas for improvement • It can be subject to hidden bias vii) Team Performance • A 360-degree feedback can help you identify new hire performance and team success viii) Culture Fit Survey • A culture fit survey can help you determine how well the new employee meshes with your company’s culture ix) Promotions • Many companies rely on an assessment of how quickly new employees are promoted. • In companies where career progression is the expected norm, how quickly an employee moves up can indicate job fit
  • 20.
    • A generalizedformula can be developed in which the organization agrees on indicators and weights to develop a scorecard. Quality of Hire = (Indicator 1 % + Indicator 2 % + Indicator 3 %…) ÷ Number of Indicators Recruitment funnel effectiveness • The recruitment process can be seen as a funnel that begins with sourcing and ends with a signed contract. By measuring the effectiveness of all the different steps in the funnel, you can specify a yield ratio per step. Yield ratio = Number of applicants who successfully completed the stage / Total number of applicants who entered this stage
  • 21.
    8. First-year attrition •There are two types of first-year attrition: managed and unmanaged • This metric can also be turned around as ‘candidate retention rate’. i) Managed attrition • It means that the contract is terminated by the employer. • It is often an indicator of poor first-year performance or a bad fit with the team i) Unmanaged attrition • It means that they leave on their own accord (voluntary turnover) • It is often an indicator of unrealistic expectations, which cause the candidate to quit • This could be due to a mismatch between the job description and the actual job, or the job and/or company has been oversold by the recruiter
  • 22.
    9. Recruiter performancemetrics i) E-mail open rate • It is the percentage of sent emails that candidates open. E-mail open rate = Number of opened emails / Number of emails delivered ii) E-mail Response rate • It measures the percentage of emails that candidates reply to. Response rate = Number of replies / Number of emails delivered iii) Interview conversion rate • It is the percentage of emails that lead to interviews. Interview conversion rate = Number of candidates interviewed / Number of cold emails delivered
  • 23.
    iv) Fill rate •It helps the recruitment team determine how many jobs have been filled over a specific period compared to how many jobs are currently open and work to minimize the number of open vacancies at any given time. • The higher your fill rate is, the more it suggests that the recruitment team is effectively filling vacancies at pace. However, if you also have a low new hire retention rate, this may suggest that not enough time or care is being spent during the interview process • A low fill rate suggests issues in your recruitment strategy and a potential inefficiency or lack of effectiveness in the recruitment channels being used. Fill rate = Total number of jobs filled / Total number of job openings
  • 24.
    10. Recruitment ROI •It helps measure the overall effectiveness and financial return of your recruitment strategies. • A positive ROI suggests that your recruitment efforts create more value than they cost. In contrast, a negative ROI indicates that you spend more on recruitment than the value those activities create.
  • 26.
  • 27.
    Advantages of usingTraining Metrics 1. Financial performance to be measured – Ability to link training metrics to financial performance metrics (e.g., ROI, liquidity, profitability measures) 2. To track performance over time – Using the same metrics and KPIs allows one to observe any noticeable improvement as a direct result of their training efforts 3. Benchmark training to competitors – Using consistent metrics allows one to compare their training program to competitors and measure whether they are underspending or overspending 4. Communicate transparently to employees – One can show employees the value of training and the value of the investment made in them
  • 28.
    1. Training costper employee • This is a straightforward metric, which divides the total cost of training by the number of employees • This can be for a specific program or as a sum of all training done in a particular year • It can be used to compare the training budget with the competition and plan the future budget accordingly Training cost per employee = cost of training ÷ number of employees
  • 29.
    Training cost examples- •Training materials cost- Workbooks, handbooks, printouts—any resources given to employees to use during the training process. • Instructor fees - cost of hiring trainers, consultants, speakers, or other professionals who provide their expertise to lead the training programs. • Training method cost – Website, onsite, other venue cost • Employee time and cost - Employees expect appropriate compensation and benefits for training, which can significantly cut into their productive hours. This includes hours spent at training and time spent traveling to get there. • Administrative costs - Insurance, equipment, supplies. If your employees are required to travel somewhere, you’ll have to think of accommodation, travel, and even catering costs.
  • 30.
    2. Learner engagement •Learner engagement measures the amount of time and effort learners invest into the learning process. • This may include time spent on modules or courses • The more time a learner spends on the learning platform and interacting with its various features, the more engaged they are. • However, this may not always be true, as in some cases, learners are just ‘clicking’ through the modules without learning. • That’s why, to measure engagement, it should be combined with other metrics such as course completion, satisfaction rating, and employee performance.
  • 31.
    3. Training Returnon Investment • Return on investment (ROI) of training measures the efficiency or profitability of the money you put into the training. Training Return on Investment = (Return of Benefit – Investment Cost) ÷ Investment Cost x 100
  • 32.
    4. Training experiencesatisfaction • This is one of the most popular training metrics to measure and can usually be found in a post-training survey. • It is used to gauge how satisfied learners are with the training they received. • One can use the Score (1 to 10) with the question, “How likely is it that you would recommend this training session to a friend or peer” to gather feedback and measure training experience satisfaction.
  • 33.
    5. Operational efficiency •Training should increase operational efficiency if it is done effectively and addresses the specific skill gaps needed to optimize processes in the workplace. • For example, a employee might currently be missing 40% of their deadlines. If an employee training program is deployed to address this specific issue, there should be a noticeable improvement (e.g., a decrease to 20% or 5% over time). • Operational metrics such as ‘time to repair’, ‘time to recover,’ ‘time to failure,’ ‘cost-per-click’ can be measured before and after training to note any efficiency improvement.
  • 34.
    6. Course enrolmentdata • This is simply to measure how many students enroll in the course. • One can communicate the training program to employees using different messages to measure the effectiveness of different images and email subject headers used when presenting the course. • It also specifies if the training deployed is appropriate for employees. One can do small things to improve course enrollment (such as encouraging managers to promote the course to their teams) and see how it improves over time.
  • 35.
    7. Course completionrate • The course completion rate gives you an indication of how much of the course a student completed. • There are creative ways to encourage course completion, such as gamification and producing bite-sized content.
  • 36.
    8. Learner dropoff rate • This is again an indication of how many learners either started a course and did not complete it or decided to leave the course. • It’s a measure of the quality of the content of the training materials, or it may even indicate browser compatibility issues in online learning platforms. • Ideally, identification should be done for the stages where the learners dropped off. It will help in understanding if there are problems with a particular piece of the training.
  • 37.
    9. Assessment passrate and Assessment scores • The assessment pass rate measures how many learners passed or failed a course taken. • It could indicate that the course assessment was difficult, or it may have been purposely done in this way to filter out the best students. • Sometimes, passing an assessment is compulsory, and students need to retake it until they pass the course.
  • 38.
    10. Employee performancepost-training • Employee performance post-training looks at the improvement of employee performance overtime related to the training. • The impact of training may be immediately noticeable or only after a more extended period of time, dependent on the complexity of the skill being trained on.