
Recommended
Recommended
More Related Content
Similar to REBGV-Stats-Pkg-Apr-2023.pdf
Similar to REBGV-Stats-Pkg-Apr-2023.pdf (20)
More from VickyAulakh1
More from VickyAulakh1 (20)
Recently uploaded
Recently uploaded (20)
REBGV-Stats-Pkg-Apr-2023.pdf
- 1. News Release FOR IMMEDIATE RELEASE: Prices continue rising across Metro Vancouver as home buyer confidence returns VANCOUVER, BC – May 2, 2023 – With listing activity remaining below historical norms, home sales in Metro Vancouver1 have mounted a surprising comeback, rising near levels seen last spring, before eight consecutive interest rate hikes eroded borrowing power and brought home sales activity down along with it. The Real Estate Board of Greater Vancouver (REBGV) reports that residential home sales in the region totalled 2,7412 in April 2023, a 16.5 per cent decrease from the 3,281 sales recorded in April 2022, and 15.6 per cent below the 10-year seasonal average (3,249). “The fact we are seeing prices rising and sales rebounding this spring tells us home buyers are returning with confidence after a challenging year for our market, with mortgage rates roughly doubling,” Lis said. “The latest MLS HPI® data show home prices have increased about five per cent year-to-date, which already outpaces our forecast of one to two per cent by year-end. The year is far from over, however, and it remains to be seen if these price increases will be sustained into 2024.” There were 4,307 detached, attached and apartment properties newly listed for sale on the Multiple Listing Service® (MLS®) in Metro Vancouver in April 2023. This represents a 29.7 per cent decrease compared to the 6,128 homes listed in April 2022, and was 22 per cent below the 10-year seasonal average (5,525). The total number of homes currently listed for sale on the MLS® system in Metro Vancouver is 8,790, a 4.2 per cent decrease compared to April 2022 (9,176), and 20.9 per cent below the 10- year seasonal average (11,117). Across all detached, attached and apartment property types, the sales-to-active listings ratio for April 2023 is 32.7 per cent. By property type, the ratio is 24.4 per cent for detached homes, 40.1 per cent for townhomes, and 37.4 per cent for apartments. Analysis of the historical data suggests downward pressure on home prices occurs when the ratio dips below 12 per cent for a sustained period, while home prices often experience upward pressure when it surpasses 20 per cent over several months. “When we released our market forecast in January, we were one of the only organizations taking the contrarian view that prices were likely to appreciate in 2023,” Lis said. “And what we’re seeing unfold so far this year is consistent with our prediction that near record-low inventory levels would create competitive conditions where almost any resurgence in demand would translate to price escalation, despite the elevated borrowing cost environment. At the crux of it, the issue remains a matter of far too little resale supply available relative to the pool of active buyers in our market.”
- 2. The MLS® Home Price Index composite benchmark price for all residential properties in Metro Vancouver is currently $1,170,700. This represents a 7.4 per cent decrease over April 2022 and a 2.4 per cent increase compared to March 2023. Sales of detached homes in April 2023 reached 808, a 16.3 per cent decrease from the 965 detached sales recorded in April 2022. The benchmark price for detached properties is $1,915,800. This represents an 8.8 per cent decrease from April 2022 and a 2.9 per cent increase compared to March 2023. Sales of apartment homes reached 1,413 in April 2023, a 16.5 per cent decrease compared to the 1,693 sales in April 2022. The benchmark price of an apartment property is $752,300. This represents a 3.1 per cent decrease from April 2022 and a two per cent increase compared to March 2023. Attached home sales in April 2023 totalled 500, a 13.5 per cent decrease compared to the 578 sales in April 2022. The benchmark price of an attached unit is $1,078,400. This represents a 6.1 per cent decrease from April 2022 and a 2.1 per cent increase compared to March 2023. -30- 1. Editor’s Note: Areas covered by the Real Estate Board of Greater Vancouver include: Bowen Island, Burnaby, Coquitlam, Maple Ridge, New Westminster, North Vancouver, Pitt Meadows, Port Coquitlam, Port Moody, Richmond, South Delta, Squamish, Sunshine Coast, Vancouver, West Vancouver, and Whistler. 2. REBGV is now including multifamily and land sales and listings in this monthly report. Previously, we only included detached, attached, and apartment sales, and these additional categories, which typically account for roughly one to two per cent of total MLS® activity per month, are being included for completeness in our reporting. The Real Estate Board of Greater Vancouver is an association representing more than 15,000 REALTORS® and their companies. The Board provides a variety of member services, including the Multiple Listing Service®. For more information on real estate, statistics, and buying or selling a home, contact a local REALTOR® or visit www.rebgv.org. For more information please contact: Craig Munn V.P., Communication and Events Real Estate Board of Greater Vancouver 604.730.3146 cmunn@rebgv.org
- 3. Property Type Area Benchmark Price Price Index 1 Month Change % 3 Month Change % 6 Month Change % 1 Year Change % 3 Year Change % 5 Year Change % 10 Year Change % Residential / Composite Lower Mainland $1,105,800 335.1 2.5% 5.3% 1.2% -10.7% 30.3% 16.8% 88.7% Greater Vancouver $1,170,700 330.7 2.4% 5.3% 1.9% -7.4% 25.5% 12.1% 79.3% Bowen Island $1,456,700 307.1 8.3% 3.6% 3.2% -13.0% 57.9% 46.4% 152.1% Burnaby East $1,114,900 348.8 0.4% 3.3% -1.0% -8.6% 20.3% 10.7% 99.2% Burnaby North $1,002,900 333.3 2.5% 5.1% 0.8% -6.8% 21.2% 12.4% 94.9% Burnaby South $1,100,200 344.1 2.3% 4.5% 3.4% -7.3% 21.5% 13.8% 96.2% Coquitlam $1,077,900 335.5 1.1% 3.4% 0.4% -11.2% 28.2% 18.0% 108.3% Ladner $1,112,200 322.4 3.7% 5.1% 0.2% -9.8% 36.8% 26.9% 109.5% Maple Ridge $955,700 329.8 3.2% 5.0% 1.5% -16.0% 39.5% 31.7% 145.0% New Westminster $814,100 366.2 0.4% 4.1% 0.5% -6.0% 27.2% 18.6% 111.6% North Vancouver $1,369,900 315.6 2.2% 7.1% 2.9% -7.5% 26.2% 14.1% 91.0% Pitt Meadows $881,200 344.6 4.1% 6.1% 0.9% -14.7% 34.5% 29.5% 141.8% Port Coquitlam $927,100 357.0 1.2% 3.6% 1.8% -10.5% 39.9% 30.0% 142.0% Port Moody $1,100,400 346.8 -0.5% 1.6% -1.5% -10.0% 34.1% 24.3% 135.4% Richmond $1,179,200 385.5 2.0% 6.3% 5.2% -1.7% 32.7% 15.6% 95.2% Squamish $1,077,700 354.3 2.0% 8.5% 0.1% -8.3% 37.6% 36.2% 162.6% Sunshine Coast $839,000 309.0 4.6% 4.4% 0.4% -10.6% 50.9% 43.6% 154.5% Tsawwassen $1,185,900 309.0 4.3% 2.7% -2.7% -11.8% 28.8% 12.8% 96.6% Vancouver East $1,165,700 362.4 2.7% 5.4% 3.4% -6.9% 21.5% 11.3% 92.3% Vancouver West $1,312,400 307.9 3.0% 6.7% 2.8% -5.1% 12.7% -2.5% 48.0% West Vancouver $2,559,300 276.4 2.7% 0.8% -6.3% -9.9% 17.5% -4.5% 49.8% Whistler $1,393,000 306.8 1.4% 6.6% -1.9% -9.0% 38.5% 45.1% 162.9% Single Family Detached Lower Mainland $1,702,200 372.7 3.2% 6.3% 1.0% -12.4% 33.4% 23.8% 101.5% Greater Vancouver $1,915,800 356.7 2.9% 6.4% 1.2% -8.8% 28.1% 15.9% 83.5% Bowen Island $1,456,300 306.9 8.3% 3.6% 3.1% -12.9% 57.9% 46.4% 152.2% Burnaby East $1,749,700 372.1 1.3% 4.6% -4.2% -11.5% 20.9% 18.3% 113.0% Burnaby North $1,933,700 369.4 3.0% 5.8% -0.7% -9.1% 23.7% 17.0% 107.1% Burnaby South $2,145,800 398.6 3.6% 7.9% 3.8% -8.2% 25.8% 18.6% 110.1% Coquitlam $1,747,900 399.9 0.7% 3.4% -0.1% -10.9% 37.4% 30.5% 143.5% Ladner $1,341,900 324.1 7.1% 5.9% -0.9% -13.3% 37.0% 30.3% 109.1% Maple Ridge $1,219,600 356.6 3.4% 4.6% 1.7% -17.0% 41.6% 38.4% 163.0% New Westminster $1,433,100 358.2 0.2% 3.5% -4.3% -11.5% 25.6% 21.3% 110.5% North Vancouver $2,192,900 342.1 2.4% 7.9% 3.2% -8.3% 29.8% 19.5% 111.0% Pitt Meadows $1,220,900 360.7 4.2% 7.6% 2.6% -17.1% 35.3% 34.0% 146.7% Port Coquitlam $1,339,000 378.5 2.2% 4.7% 2.0% -13.0% 42.4% 34.8% 158.9% Port Moody $1,981,400 375.2 -1.8% 0.3% -2.4% -10.7% 36.5% 30.4% 148.8% Richmond $2,137,600 436.3 1.4% 8.7% 4.1% -2.7% 31.7% 18.3% 108.5% Squamish $1,635,700 405.6 6.0% 11.2% -3.0% -7.5% 41.7% 48.5% 224.5% Sunshine Coast $917,400 319.9 6.6% 4.5% 0.1% -10.7% 56.1% 49.6% 162.9% Tsawwassen $1,473,200 326.3 7.2% 2.7% -4.1% -14.8% 30.9% 19.1% 110.0% Vancouver East $1,757,200 393.2 2.6% 5.6% 2.2% -9.5% 22.6% 15.8% 110.4% Vancouver West $3,313,200 345.7 2.9% 9.7% 3.9% -6.2% 11.1% 0.9% 57.6% West Vancouver $3,111,600 289.4 3.1% 1.2% -6.2% -8.2% 18.7% -1.4% 56.4% Whistler $2,519,200 340.2 5.8% 9.1% -4.5% -8.4% 42.1% 53.5% 174.1% HOW TO READ THE TABLE: • Benchmark Price: Estimated sale price of a benchmark property. Benchmarks represent a typical property within each market. • Price Index: Index numbers estimate the percentage change in price on typical and constant quality properties over time. All figures are based on past sales. • x Month/Year Change %: Percentage change of index over a period of x month(s)/year(s) * In January 2005, the indexes are set to 100. Townhome properties are similar to Attached properties, a category that was used in the previous MLSLink HPI, but do not included duplexes. The above info is deemed reliable, but is not guaranteed. All dollar amounts in CDN. April 2023 * * MLS®, Multiple Listing Service®, and all related graphics are trademarks of The Canadian Real Estate Association 1 of 19
- 4. Property Type Area Benchmark Price Price Index 1 Month Change % 3 Month Change % 6 Month Change % 1 Year Change % 3 Year Change % 5 Year Change % 10 Year Change % April 2023 * Townhouse Lower Mainland $944,400 357.3 1.9% 5.2% 1.8% -9.3% 37.6% 30.4% 131.4% Greater Vancouver $1,078,400 371.5 2.1% 5.7% 3.3% -6.0% 35.0% 27.2% 130.6% Burnaby East $876,000 368.8 0.7% 0.7% 4.2% -1.3% 27.9% 23.1% 120.2% Burnaby North $903,700 366.9 2.4% 3.7% 2.7% -5.1% 29.7% 26.2% 126.1% Burnaby South $997,800 370.8 4.4% 5.2% 5.9% -5.1% 28.1% 21.1% 124.9% Coquitlam $1,037,600 401.9 2.1% 6.4% 2.3% -9.7% 37.8% 30.4% 166.2% Ladner $991,700 380.8 -0.7% 7.0% 5.4% -3.3% 33.0% 28.7% 143.3% Maple Ridge $747,000 371.1 2.1% 6.9% 2.0% -15.4% 38.6% 30.1% 164.9% New Westminster $928,800 395.4 -0.6% 4.1% 1.2% -2.4% 40.5% 33.4% 134.5% North Vancouver $1,314,400 357.0 0.8% 6.4% 6.8% -5.2% 36.9% 31.6% 130.6% Pitt Meadows $800,700 387.9 4.7% 4.4% -2.2% -13.1% 34.1% 29.1% 159.1% Port Coquitlam $901,600 361.1 0.4% 2.6% 1.1% -12.6% 36.8% 31.4% 156.5% Port Moody $1,022,300 388.1 1.5% 2.5% 0.1% -10.1% 38.0% 33.5% 158.6% Richmond $1,116,400 400.4 1.2% 4.8% 5.4% -1.0% 39.2% 31.6% 129.7% Squamish $1,006,100 362.7 -0.1% 4.6% 1.4% -8.0% 46.1% 36.5% 193.9% Sunshine Coast $734,500 333.1 0.6% 6.3% 2.2% -6.9% 49.1% 43.6% 170.2% Tsawwassen $990,100 310.7 -1.0% 5.7% 3.9% -4.6% 19.5% 6.4% 91.2% Vancouver East $1,110,700 363.7 2.9% 8.6% 8.0% -3.7% 25.2% 13.2% 109.1% Vancouver West $1,481,900 331.4 6.5% 7.4% 0.3% -4.3% 22.8% 10.2% 100.5% Whistler $1,449,500 369.5 0.4% 6.0% 2.3% -7.4% 52.2% 50.4% 218.3% Apartment Lower Mainland $697,800 345.8 1.9% 4.5% 2.8% -4.5% 22.5% 14.0% 110.1% Greater Vancouver $752,300 343.7 2.0% 4.4% 3.5% -3.1% 19.3% 12.4% 108.2% Burnaby East $797,600 335.0 0.4% 4.9% 3.4% -5.4% 18.3% 9.9% 114.9% Burnaby North $734,600 370.8 2.9% 5.5% 3.2% -1.4% 26.2% 22.9% 125.1% Burnaby South $790,800 376.4 2.1% 4.2% 5.2% -2.1% 20.9% 16.1% 122.9% Coquitlam $675,300 383.0 1.5% 2.9% 1.5% -6.6% 19.0% 16.4% 144.6% Ladner $698,900 355.5 -2.1% 1.1% -2.5% -4.4% 44.7% 35.5% 140.9% Maple Ridge $525,800 363.1 4.3% 4.4% 0.1% -8.3% 32.9% 28.9% 155.2% New Westminster $652,100 390.9 0.6% 4.7% 3.1% -3.1% 24.1% 17.3% 132.3% North Vancouver $802,600 320.5 2.5% 7.2% 2.8% -3.3% 21.6% 12.9% 112.7% Pitt Meadows $596,000 401.9 4.8% 4.8% 0.2% -8.7% 29.4% 22.7% 160.6% Port Coquitlam $625,300 425.1 1.6% 3.3% 2.5% -5.2% 34.1% 27.1% 171.8% Port Moody $706,800 376.8 1.0% 4.4% 1.1% -6.4% 19.5% 16.5% 139.2% Richmond $751,200 405.8 3.4% 4.2% 7.4% 2.6% 27.4% 21.5% 133.8% Squamish $574,900 341.0 -5.4% 6.7% 7.9% -9.0% 26.9% 25.4% 172.4% Sunshine Coast $528,300 302.8 -8.4% 3.3% 4.4% -13.0% 15.0% 6.4% 107.5% Tsawwassen $724,900 338.4 -2.1% 1.6% -2.2% -3.8% 31.0% 18.6% 132.4% Vancouver East $701,100 401.5 1.8% 3.6% 3.3% -3.8% 11.6% 7.7% 115.6% Vancouver West $848,000 320.1 2.5% 4.1% 2.4% -3.6% 11.6% 4.2% 93.8% West Vancouver $1,239,800 242.1 2.2% 3.6% 3.9% -6.3% 20.4% -2.9% 67.8% Whistler $646,600 278.7 -5.8% 5.8% 7.1% -8.0% 30.5% 34.1% 161.4% HOW TO READ THE TABLE: • Benchmark Price: Estimated sale price of a benchmark property. Benchmarks represent a typical property within each market. • Price Index: Index numbers estimate the percentage change in price on typical and constant quality properties over time. All figures are based on past sales. • x Month/Year Change %: Percentage change of index over a period of x month(s)/year(s) In January 2005, the indexes are set to 100. * Townhome properties are similar to attached properties, a category that was used in the previous MLSLink HPI, but do not included duplexes. Lower Mainland includes areas serviced by both Real Estate Board of Greater Vancouver & Fraser Valley Real Estate Board. The above info is deemed reliable, but is not guaranteed. All dollar amounts in CDN. * MLS®, Multiple Listing Service®, and all related graphics are trademarks of The Canadian Real Estate Association 2 of 19
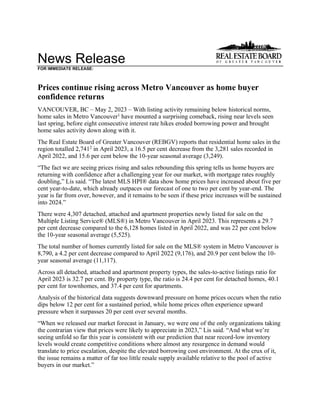
- 5. C:DATAMonthEndHpiexporthi_resgv-hpi2.tif Greater Vancouver 5 Year Trend 60 110 160 210 260 310 360 410 460 Apr 2018 Jun 2018 Aug 2018 Oct 2018 Dec 2018 Feb 2019 Apr 2019 Jun 2019 Aug 2019 Oct 2019 Dec 2019 Feb 2020 Apr 2020 Jun 2020 Aug 2020 Oct 2020 Dec 2020 Feb 2021 Apr 2021 Jun 2021 Aug 2021 Oct 2021 Dec 2021 Feb 2022 Apr 2022 Jun 2022 Aug 2022 Oct 2022 Dec 2022 Feb 2023 Apr 2023 Price Index Residential Detached Townhouse Apartment Jan 2005 HPI = 100
- 8. Listing & Sales Activity Summary Listings Sales 1 2 3 Col. 2 & 3 5 6 7 Col. 6 & 7 9 10 Col. 9 & 10 Apr Mar Apr Percentage Apr Mar Apr Percentage Feb 2022 - Feb 2023 - Percentage 2022 2023 2023 Variance 2022 2023 2023 Variance Apr 2022 Apr 2023 Variance BURNABY % % % DETACHED 147 101 109 7.9 85 53 74 39.6 278 174 -37.4 ATTACHED 116 81 86 6.2 61 46 65 41.3 208 156 -25.0 APARTMENTS 491 334 377 12.9 242 219 284 29.7 886 683 -22.9 COQUITLAM DETACHED 176 110 109 -0.9 88 59 67 13.6 287 160 -44.3 ATTACHED 85 51 77 51.0 42 31 43 38.7 149 114 -23.5 APARTMENTS 222 142 147 3.5 149 104 99 -4.8 503 287 -42.9 DELTA DETACHED 82 78 81 3.8 36 31 51 64.5 170 104 -38.8 ATTACHED 30 25 25 0.0 13 18 23 27.8 44 57 29.5 APARTMENTS 23 45 23 -48.9 31 23 23 0.0 90 60 -33.3 MAPLE RIDGE/PITT MEADOWS DETACHED 274 165 159 -3.6 103 87 91 4.6 382 254 -33.5 ATTACHED 146 62 75 21.0 63 49 52 6.1 208 142 -31.7 APARTMENTS 81 81 70 -13.6 44 36 44 22.2 191 106 -44.5 NORTH VANCOUVER DETACHED 193 133 125 -6.0 96 64 78 21.9 293 190 -35.2 ATTACHED 61 53 53 0.0 54 38 28 -26.3 164 90 -45.1 APARTMENTS 214 172 151 -12.2 125 111 111 0.0 421 298 -29.2 NEW WESTMINSTER DETACHED 56 27 45 66.7 24 16 19 18.8 85 46 -45.9 ATTACHED 14 13 15 15.4 7 5 20 300.0 50 28 -44.0 APARTMENTS 132 98 101 3.1 102 75 72 -4.0 354 199 -43.8 PORT MOODY/BELCARRA DETACHED 29 22 24 9.1 16 15 22 46.7 75 48 -36.0 ATTACHED 33 30 13 -56.7 23 21 24 14.3 70 60 -14.3 APARTMENTS 48 57 54 -5.3 26 44 45 2.3 110 109 -0.9 PORT COQUITLAM DETACHED 85 38 26 -31.6 36 28 20 -28.6 129 59 -54.3 ATTACHED 41 27 11 -59.3 33 12 15 25.0 83 41 -50.6 APARTMENTS 62 61 40 -34.4 48 29 41 41.4 154 85 -44.8 RICHMOND DETACHED 245 128 156 21.9 96 95 92 -3.2 345 247 -28.4 ATTACHED 173 117 94 -19.7 96 73 73 0.0 284 192 -32.4 APARTMENTS 332 227 249 9.7 233 180 173 -3.9 749 471 -37.1 SUNSHINE COAST DETACHED 107 98 115 17.3 72 24 43 79.2 192 91 -52.6 ATTACHED 12 13 14 7.7 10 8 6 -25.0 34 21 -38.2 APARTMENTS 10 13 11 -15.4 3 6 7 16.7 24 15 -37.5 SQUAMISH DETACHED 40 26 37 42.3 24 17 15 -11.8 71 44 -38.0 ATTACHED 35 32 25 -21.9 19 19 14 -26.3 70 41 -41.4 APARTMENTS 22 18 13 -27.8 9 12 11 -8.3 62 31 -50.0 VANCOUVER EAST DETACHED 249 139 166 19.4 110 92 75 -18.5 401 224 -44.1 ATTACHED 140 116 97 -16.4 65 83 79 -4.8 205 202 -1.5 APARTMENTS 280 202 221 9.4 178 111 113 1.8 607 325 -46.5 VANCOUVER WEST DETACHED 284 177 158 -10.7 93 94 95 1.1 319 255 -20.1 ATTACHED 148 94 104 10.6 60 43 33 -23.3 208 120 -42.3 APARTMENTS 839 649 579 -10.8 465 312 339 8.7 1553 857 -44.8 WHISTLER/PEMBERTON DETACHED 23 24 20 -16.7 19 15 8 -46.7 41 30 -26.8 ATTACHED 30 19 22 15.8 28 16 22 37.5 79 55 -30.4 APARTMENTS 52 38 21 -44.7 24 26 30 15.4 110 72 -34.5 WEST VANCOUVER/HOWE SOUND DETACHED 184 97 132 36.1 54 38 46 21.1 174 111 -36.2 ATTACHED 9 14 13 -7.1 4 4 3 -25.0 23 13 -43.5 APARTMENTS 40 46 37 -19.6 13 22 19 -13.6 40 51 27.5 GRAND TOTALS DETACHED 2174 1363 1462 7.3 952 728 796 9.3 3242 2037 -37.2 ATTACHED 1073 747 724 -3.1 578 466 500 7.3 1879 1332 -29.1 APARTMENTS 2848 2183 2094 -4.1 1692 1310 1411 7.7 5854 3649 -37.7