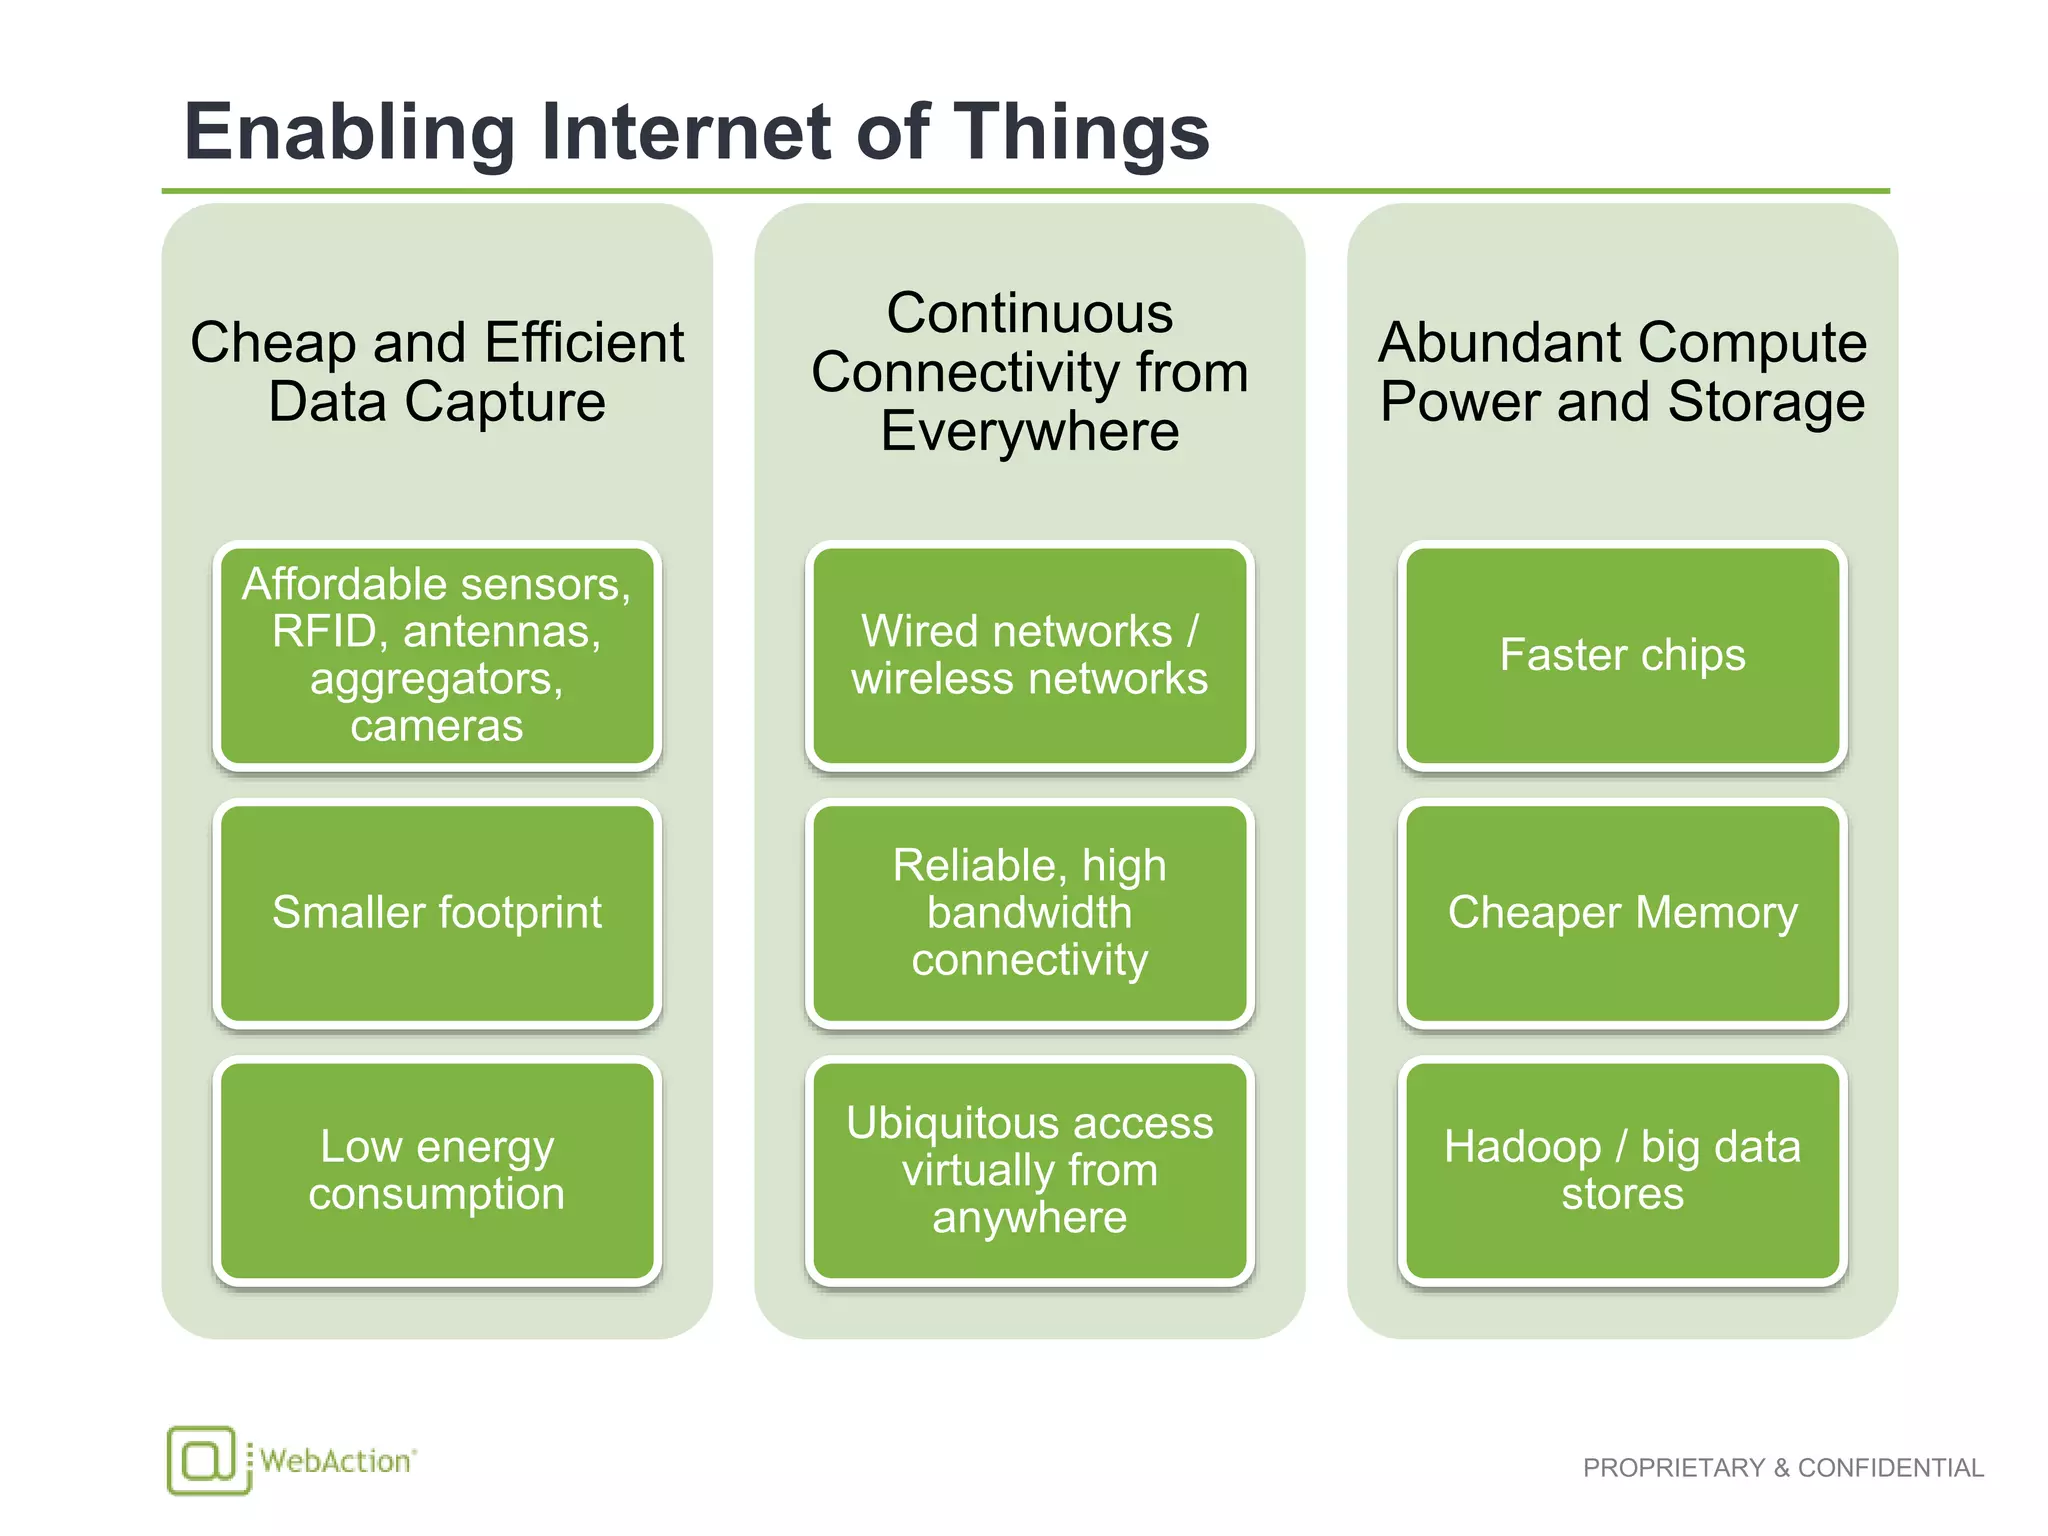
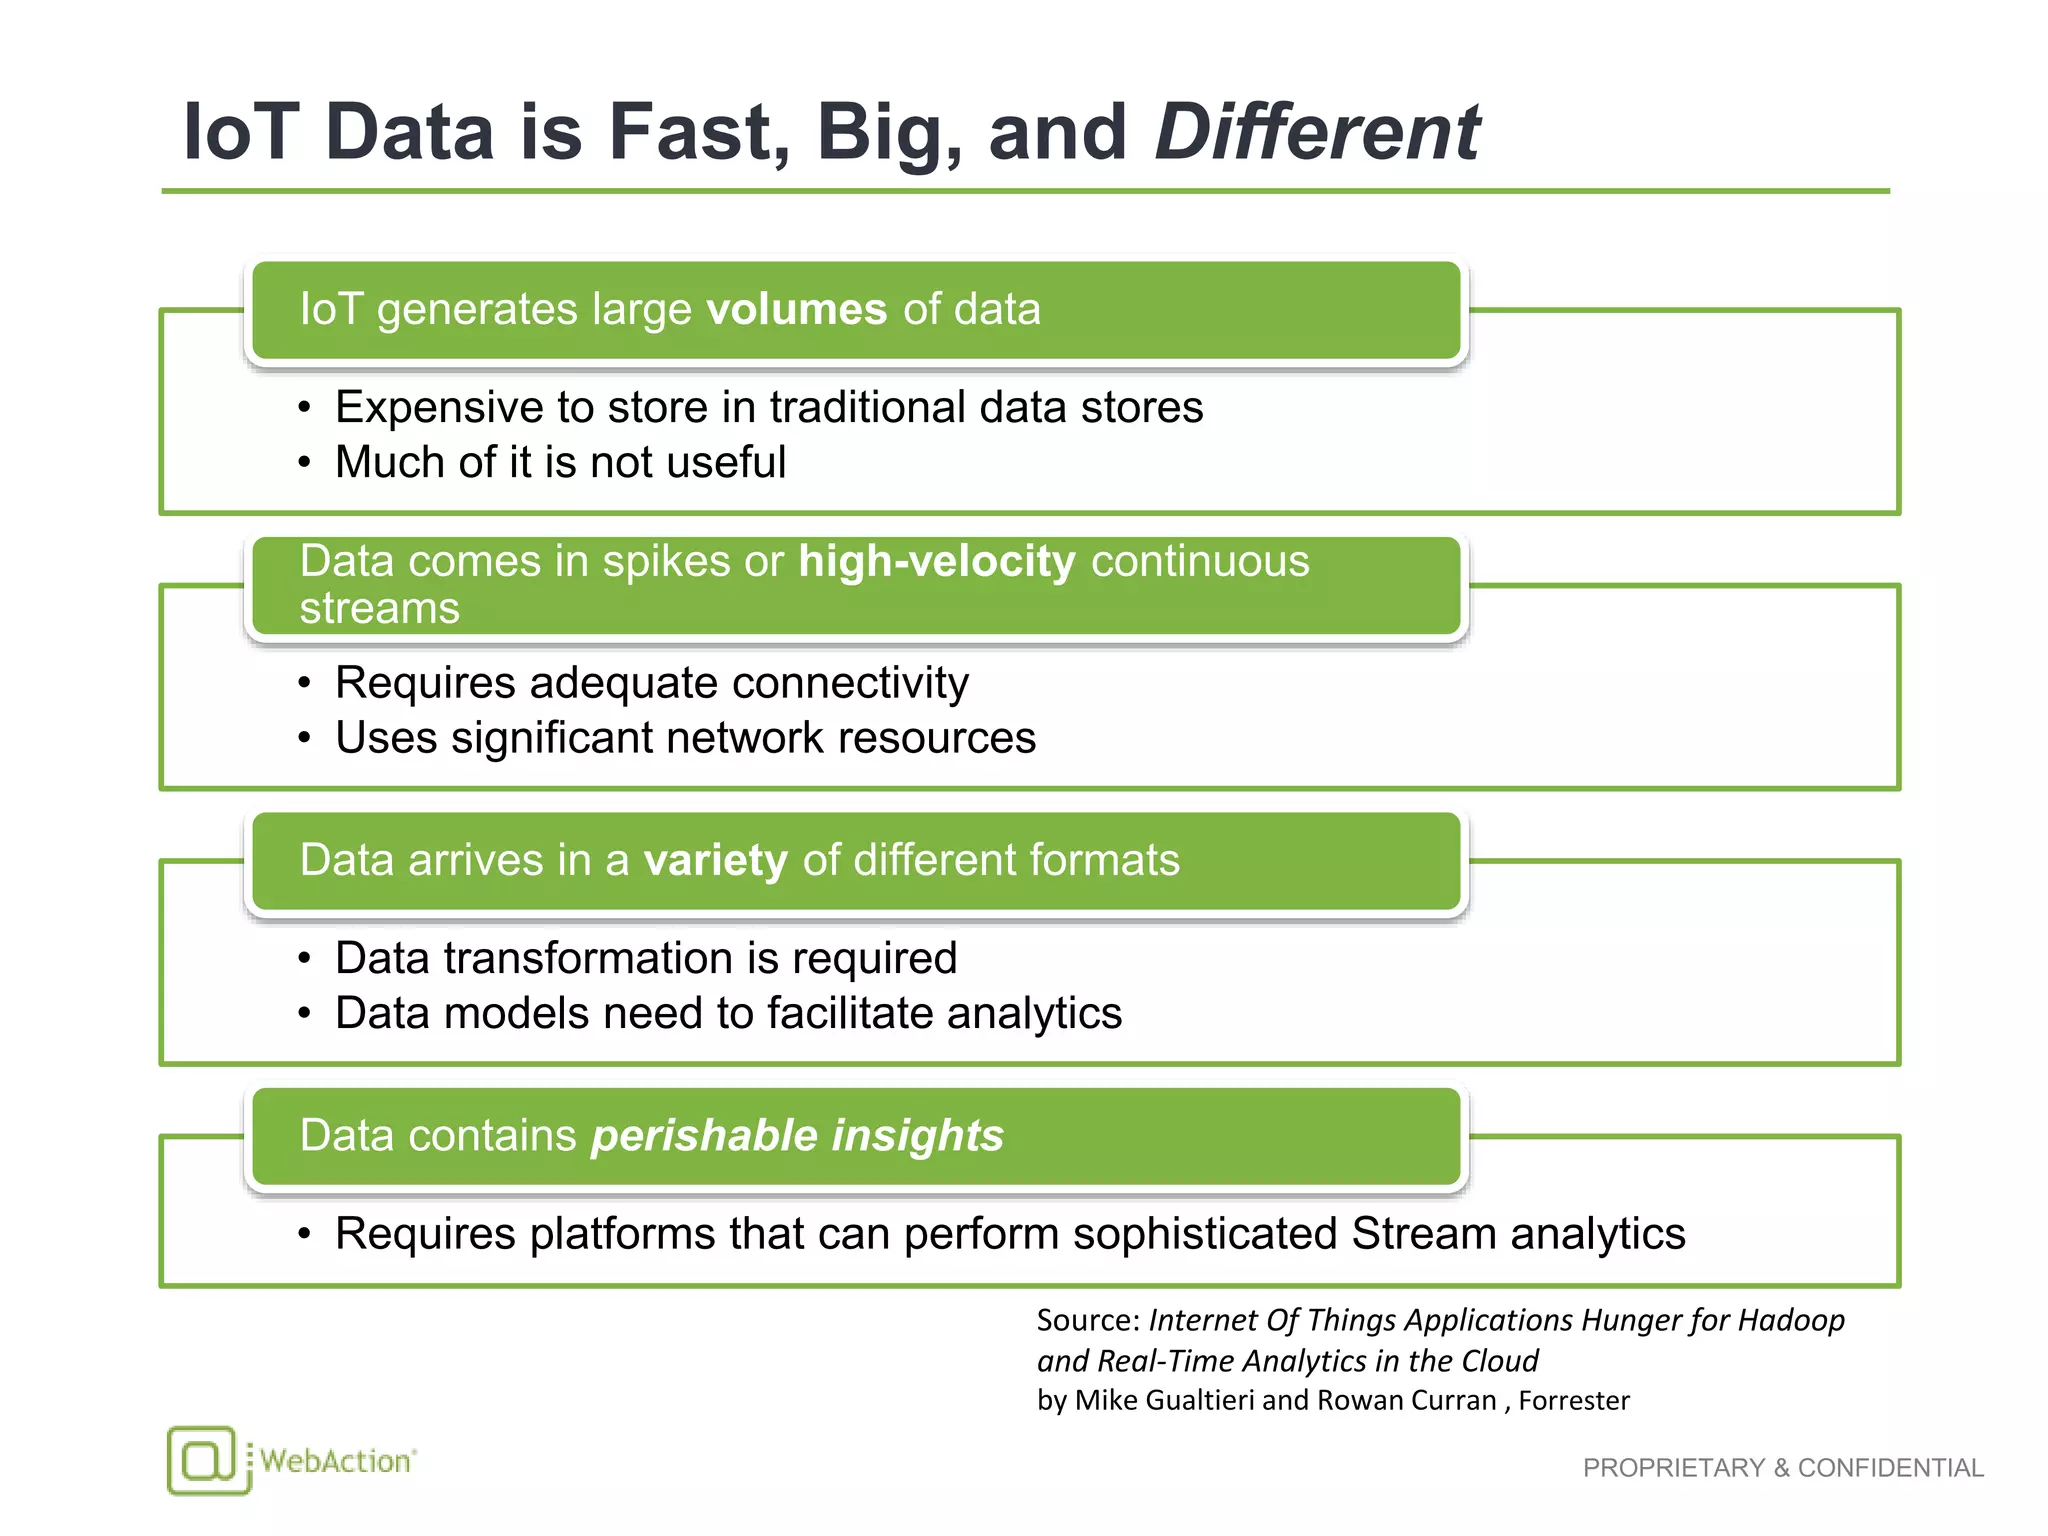
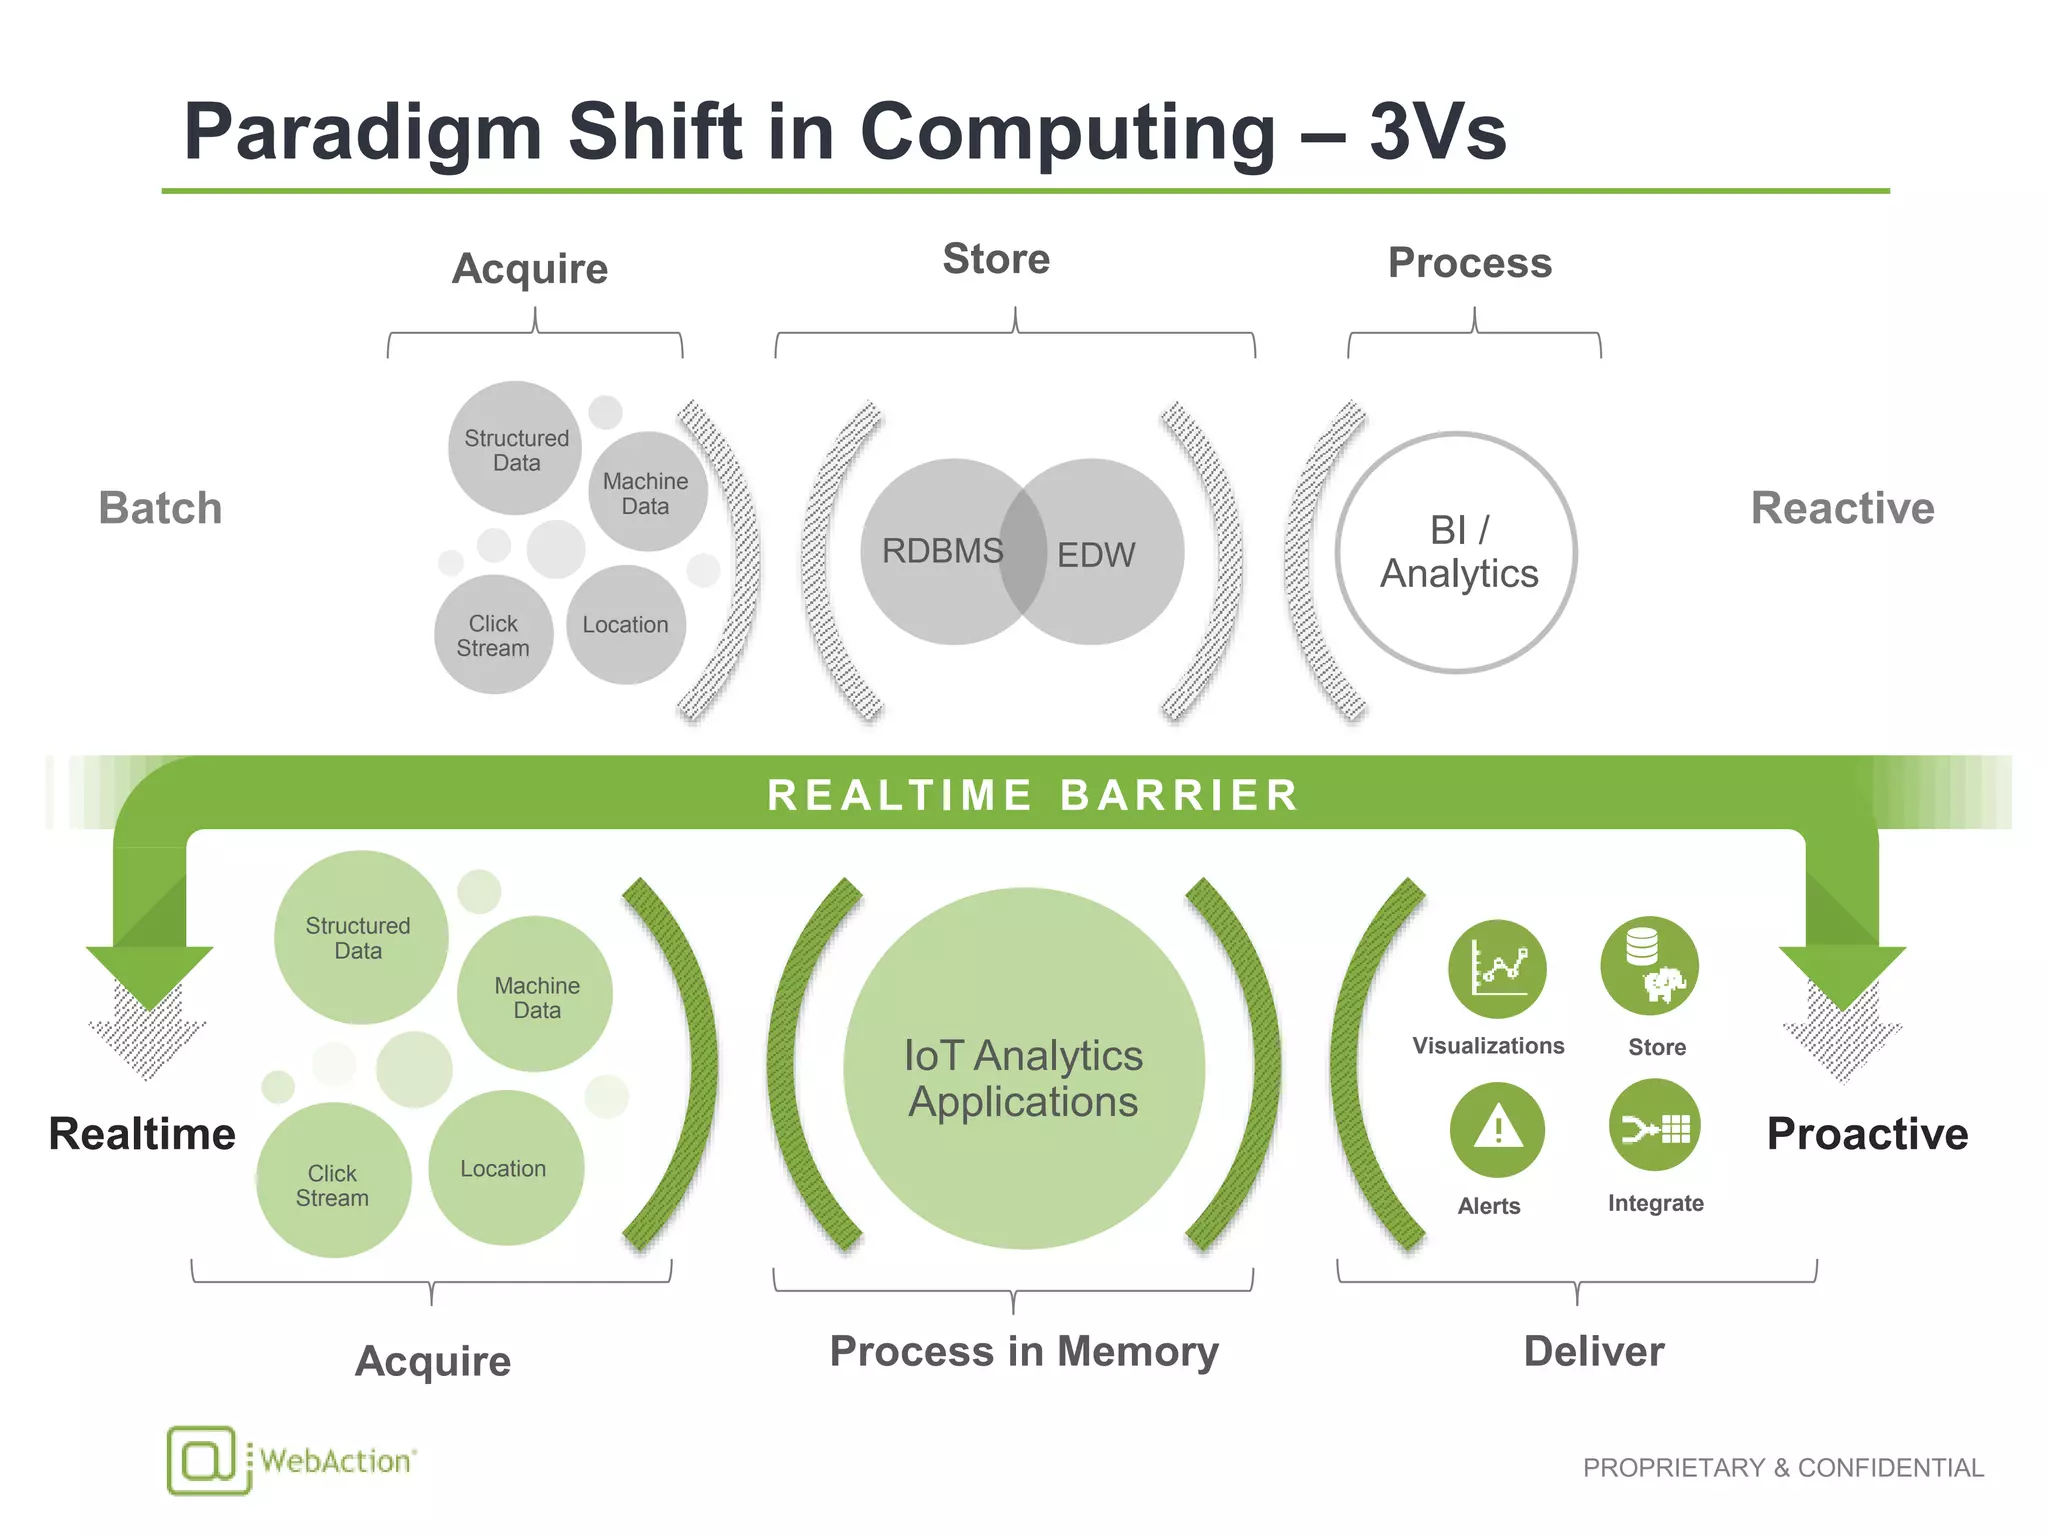
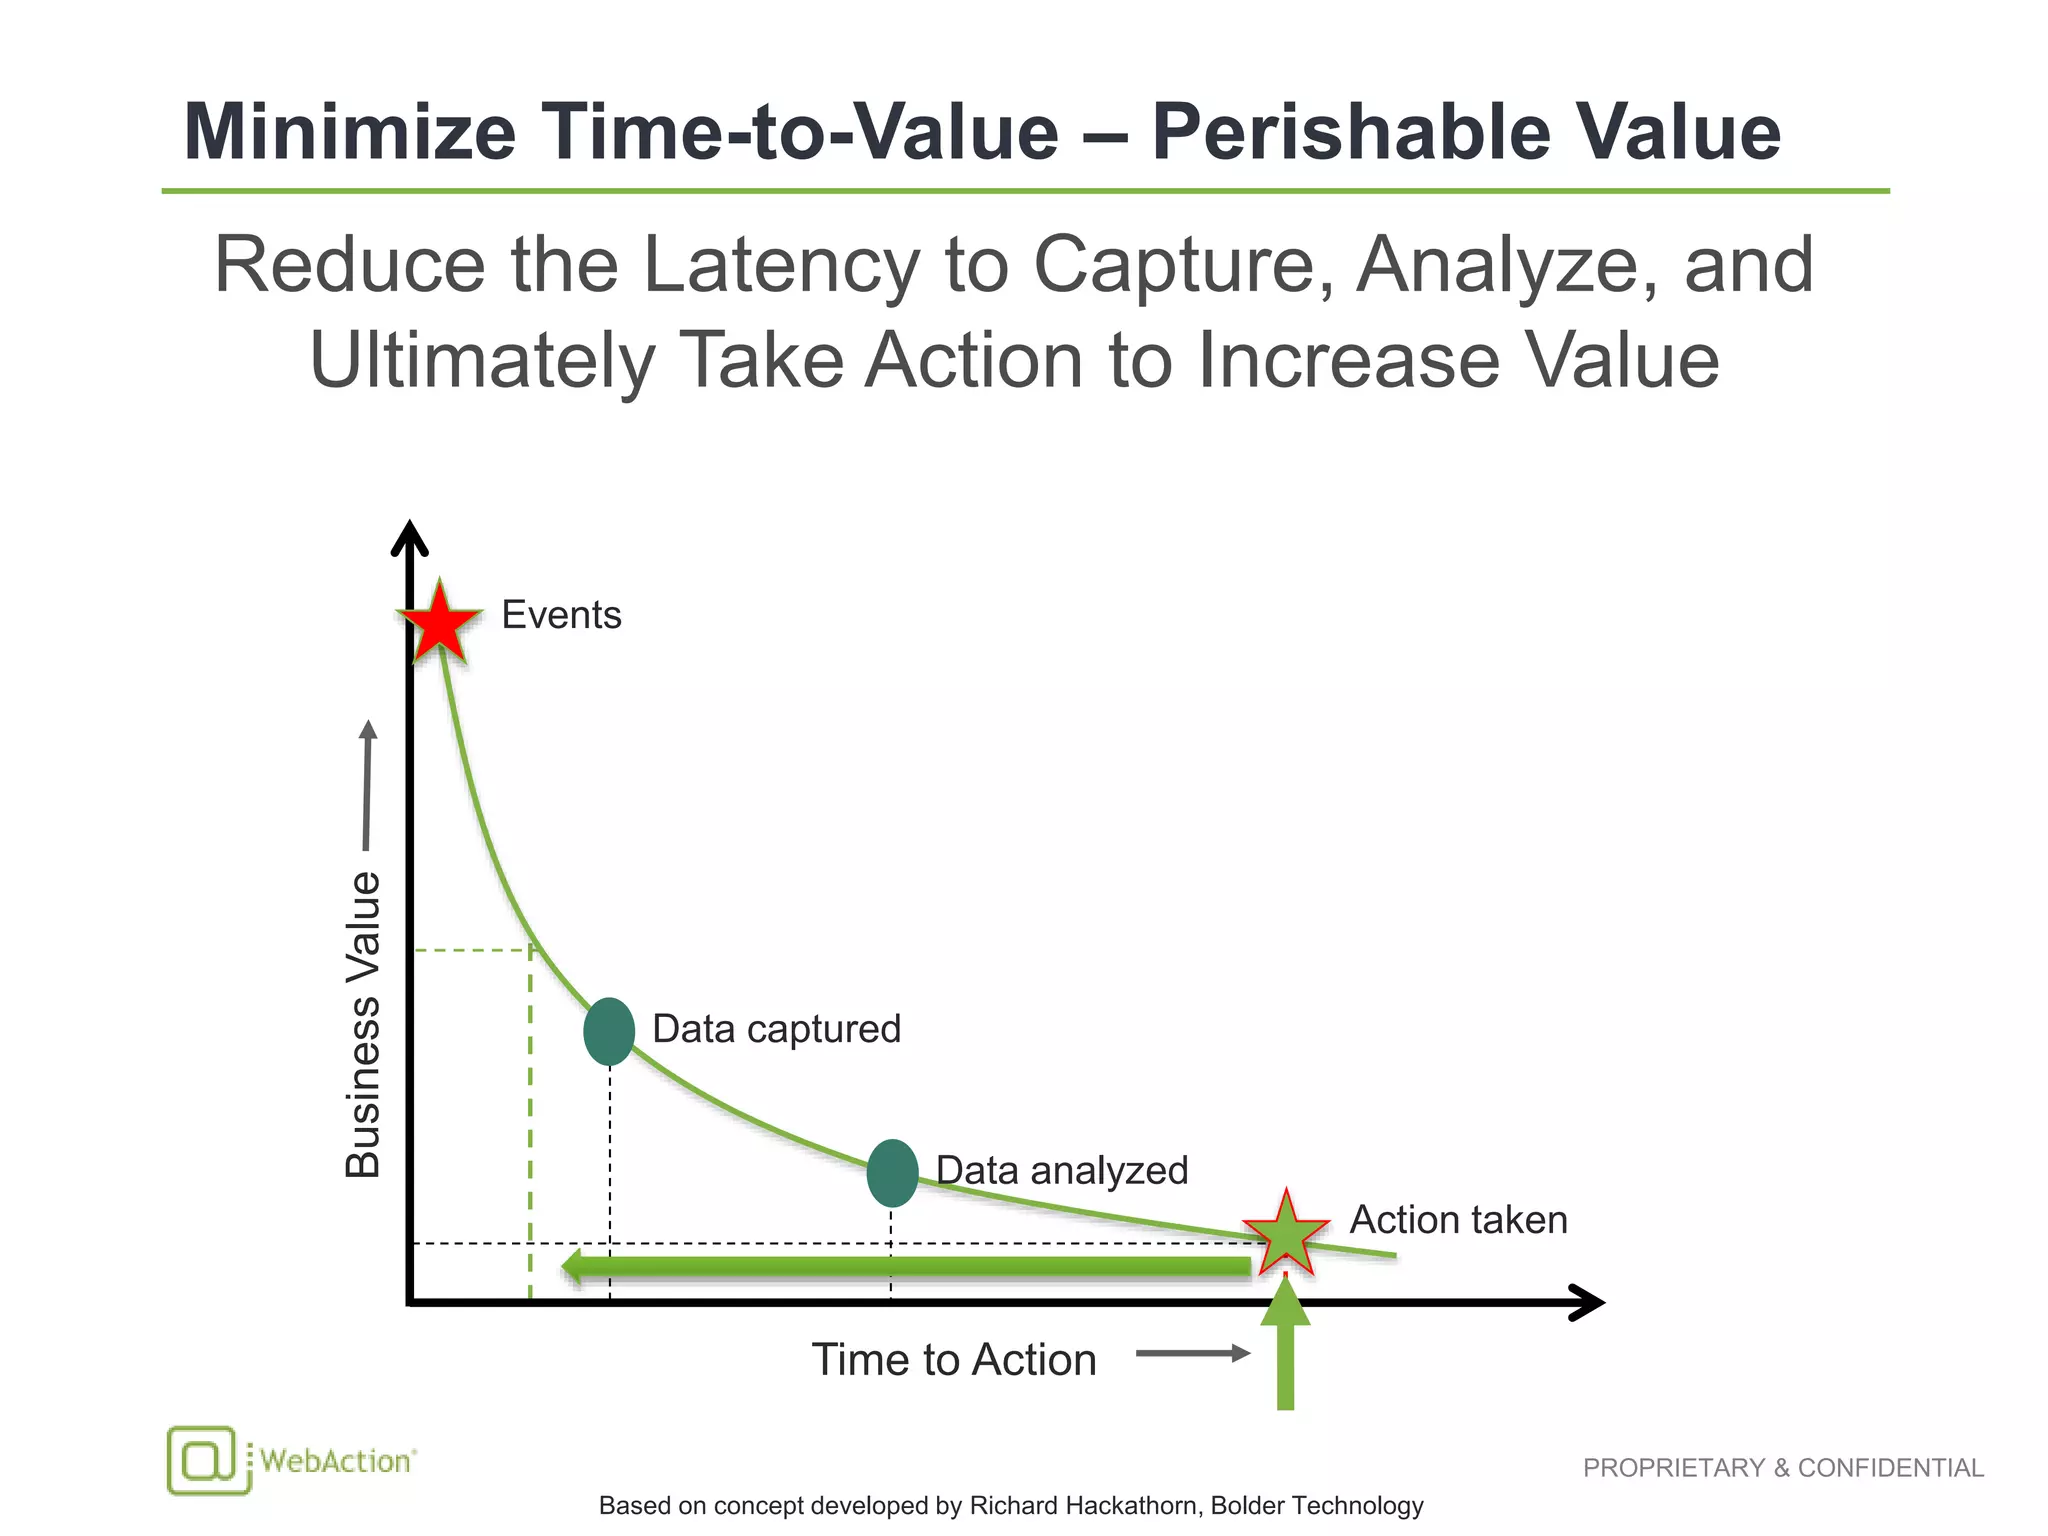
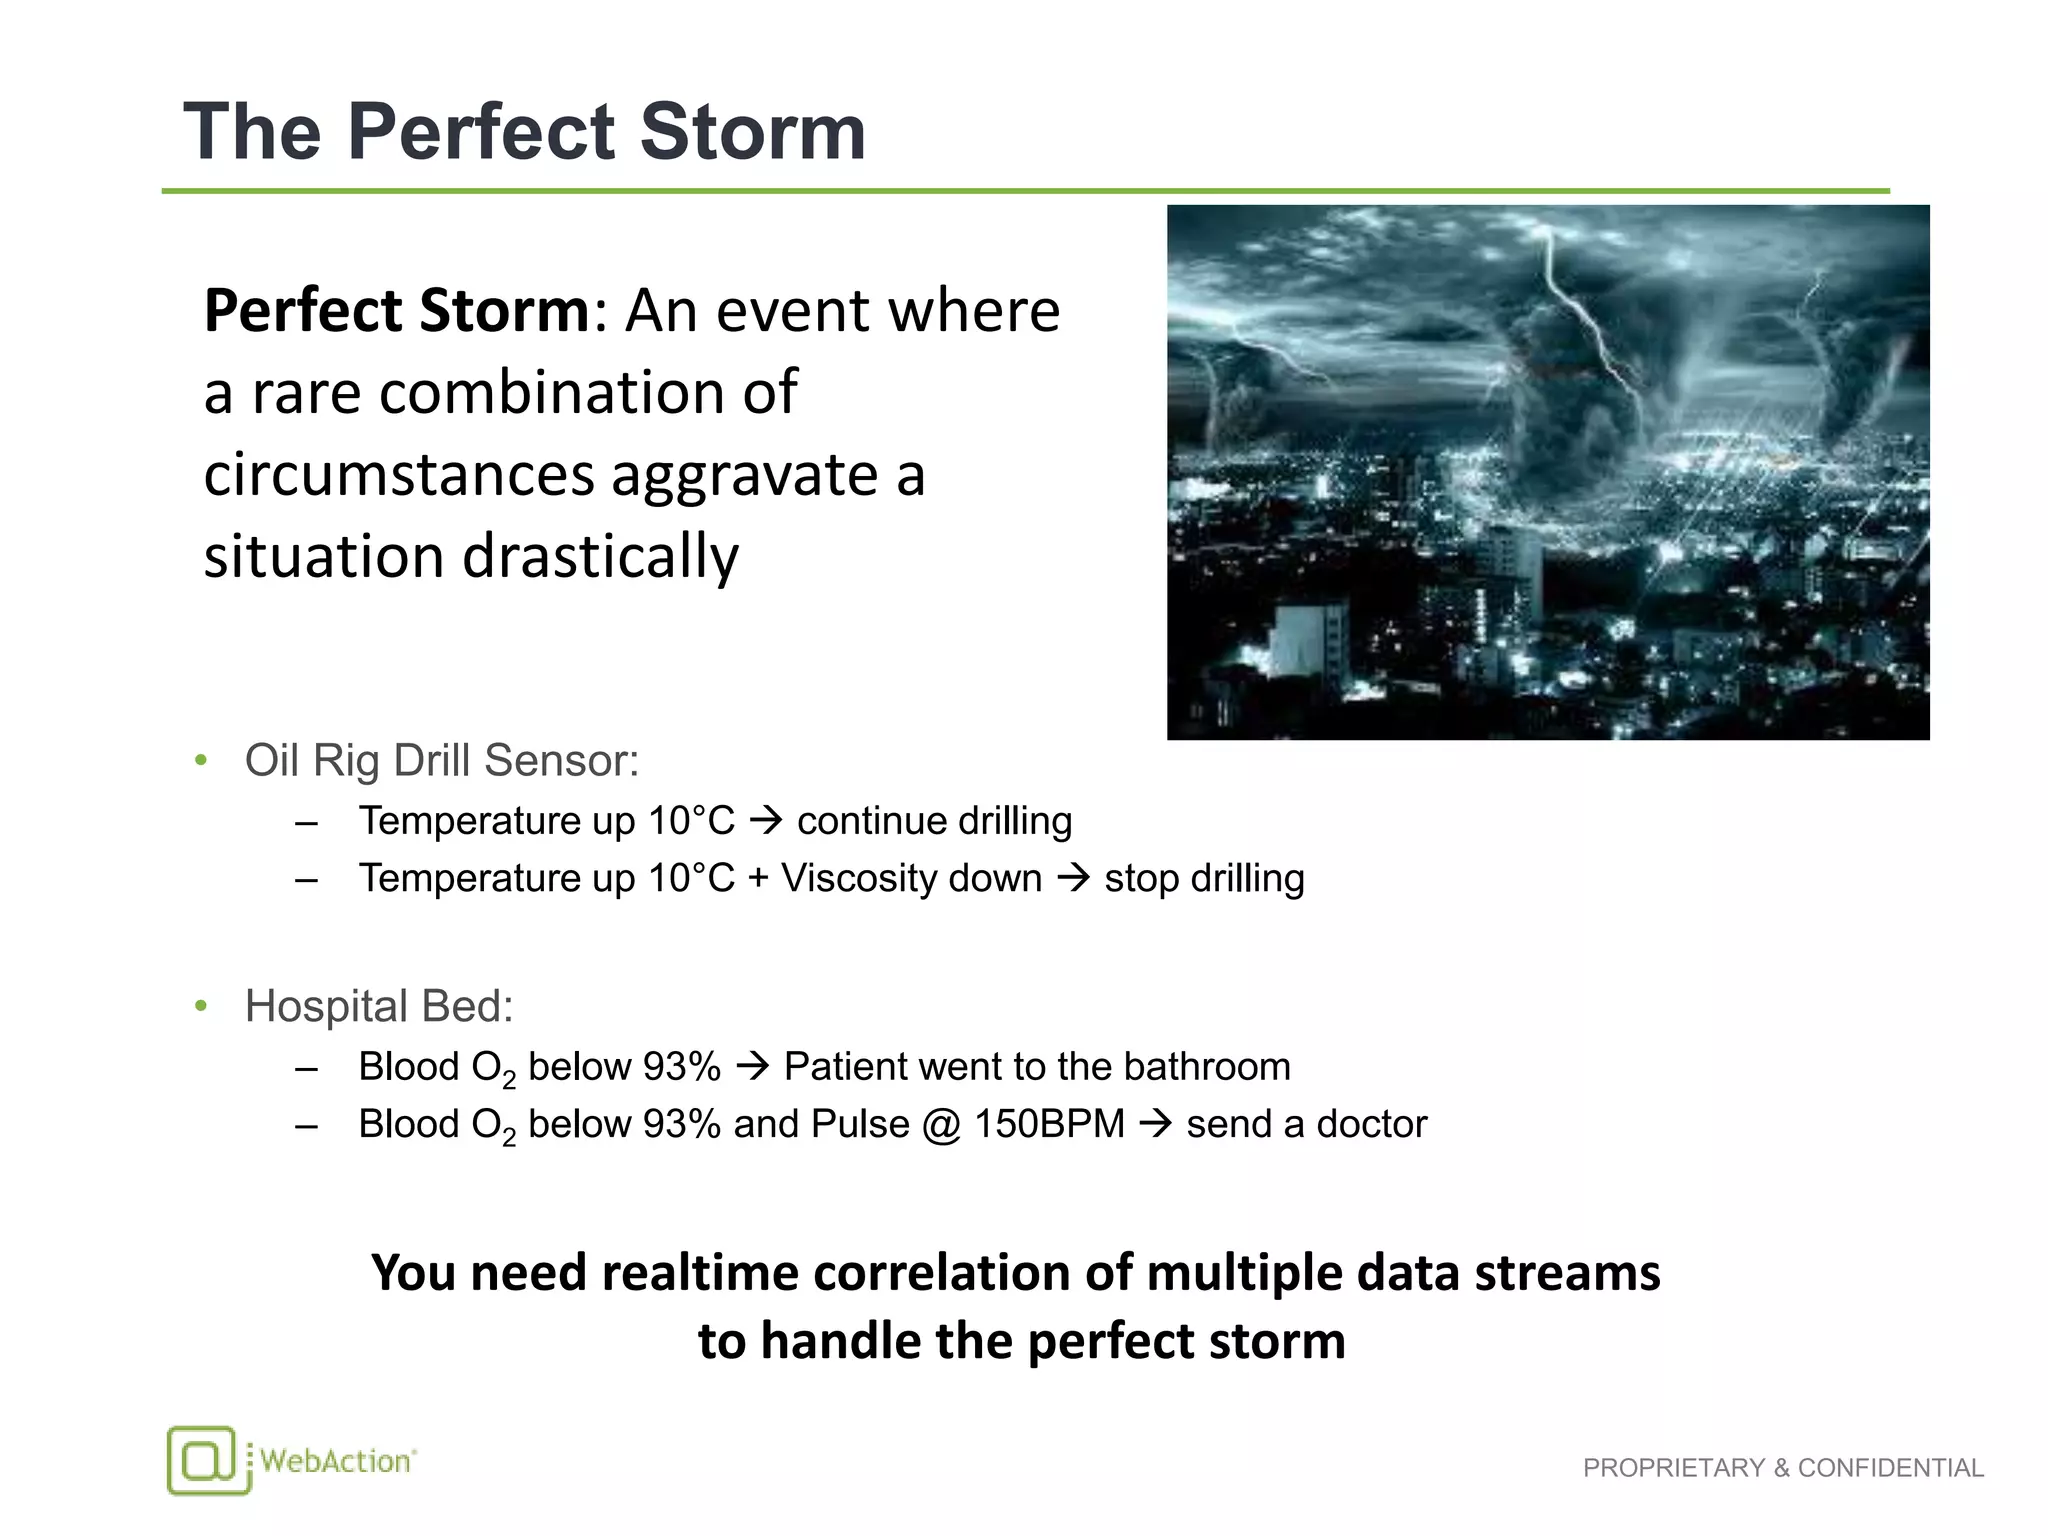
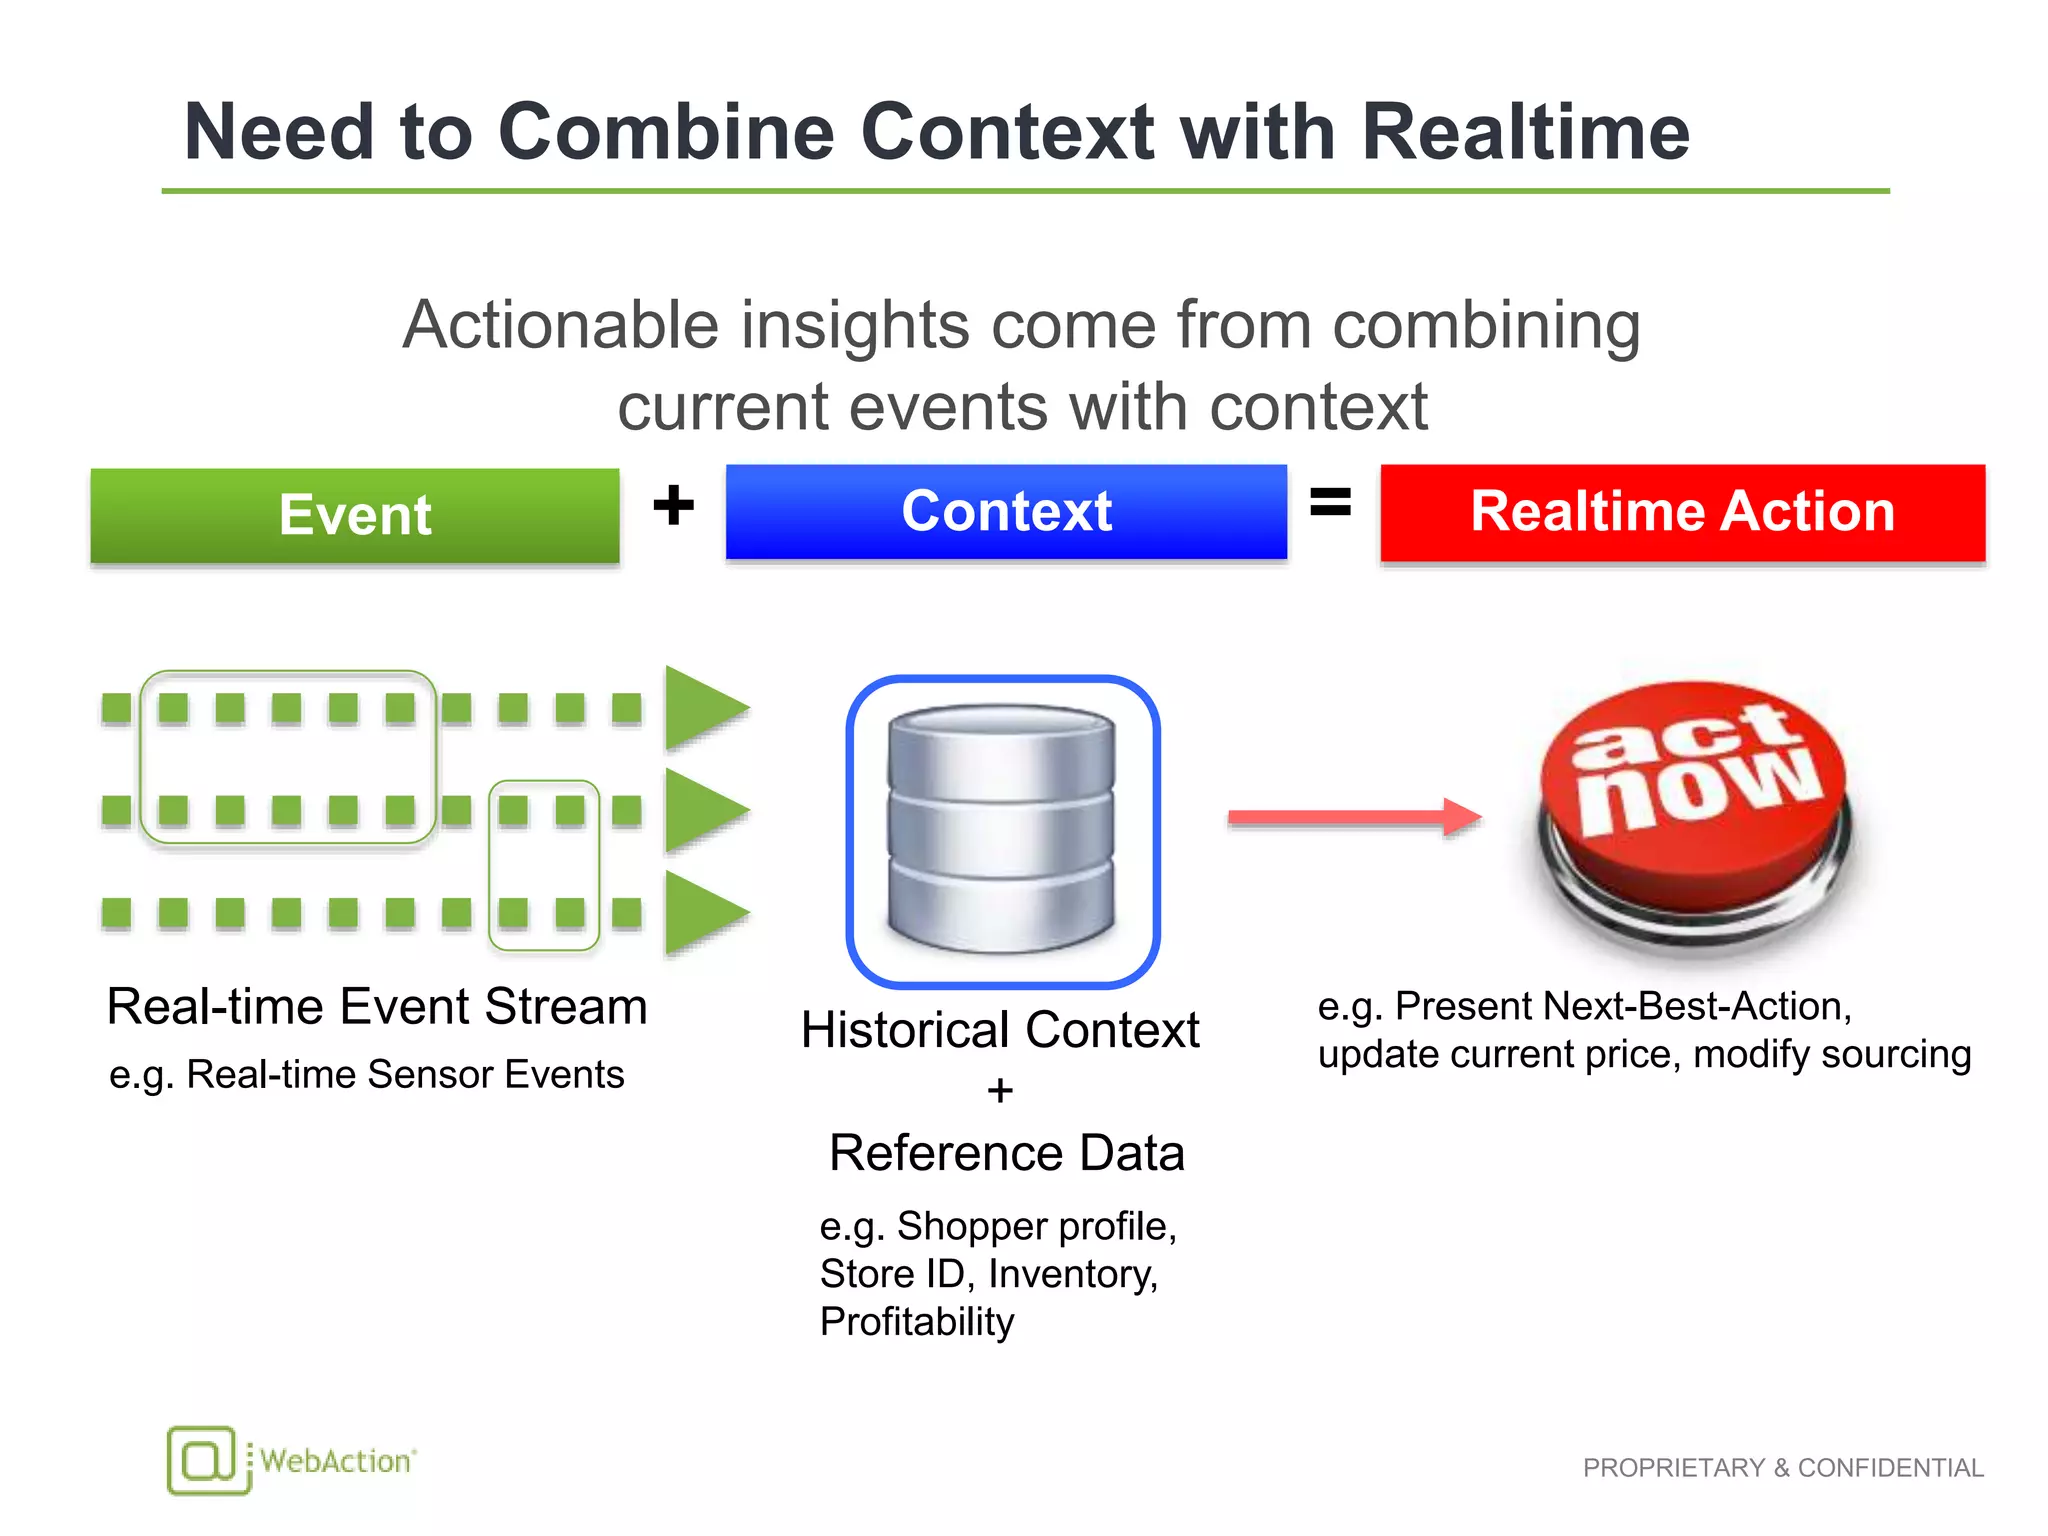
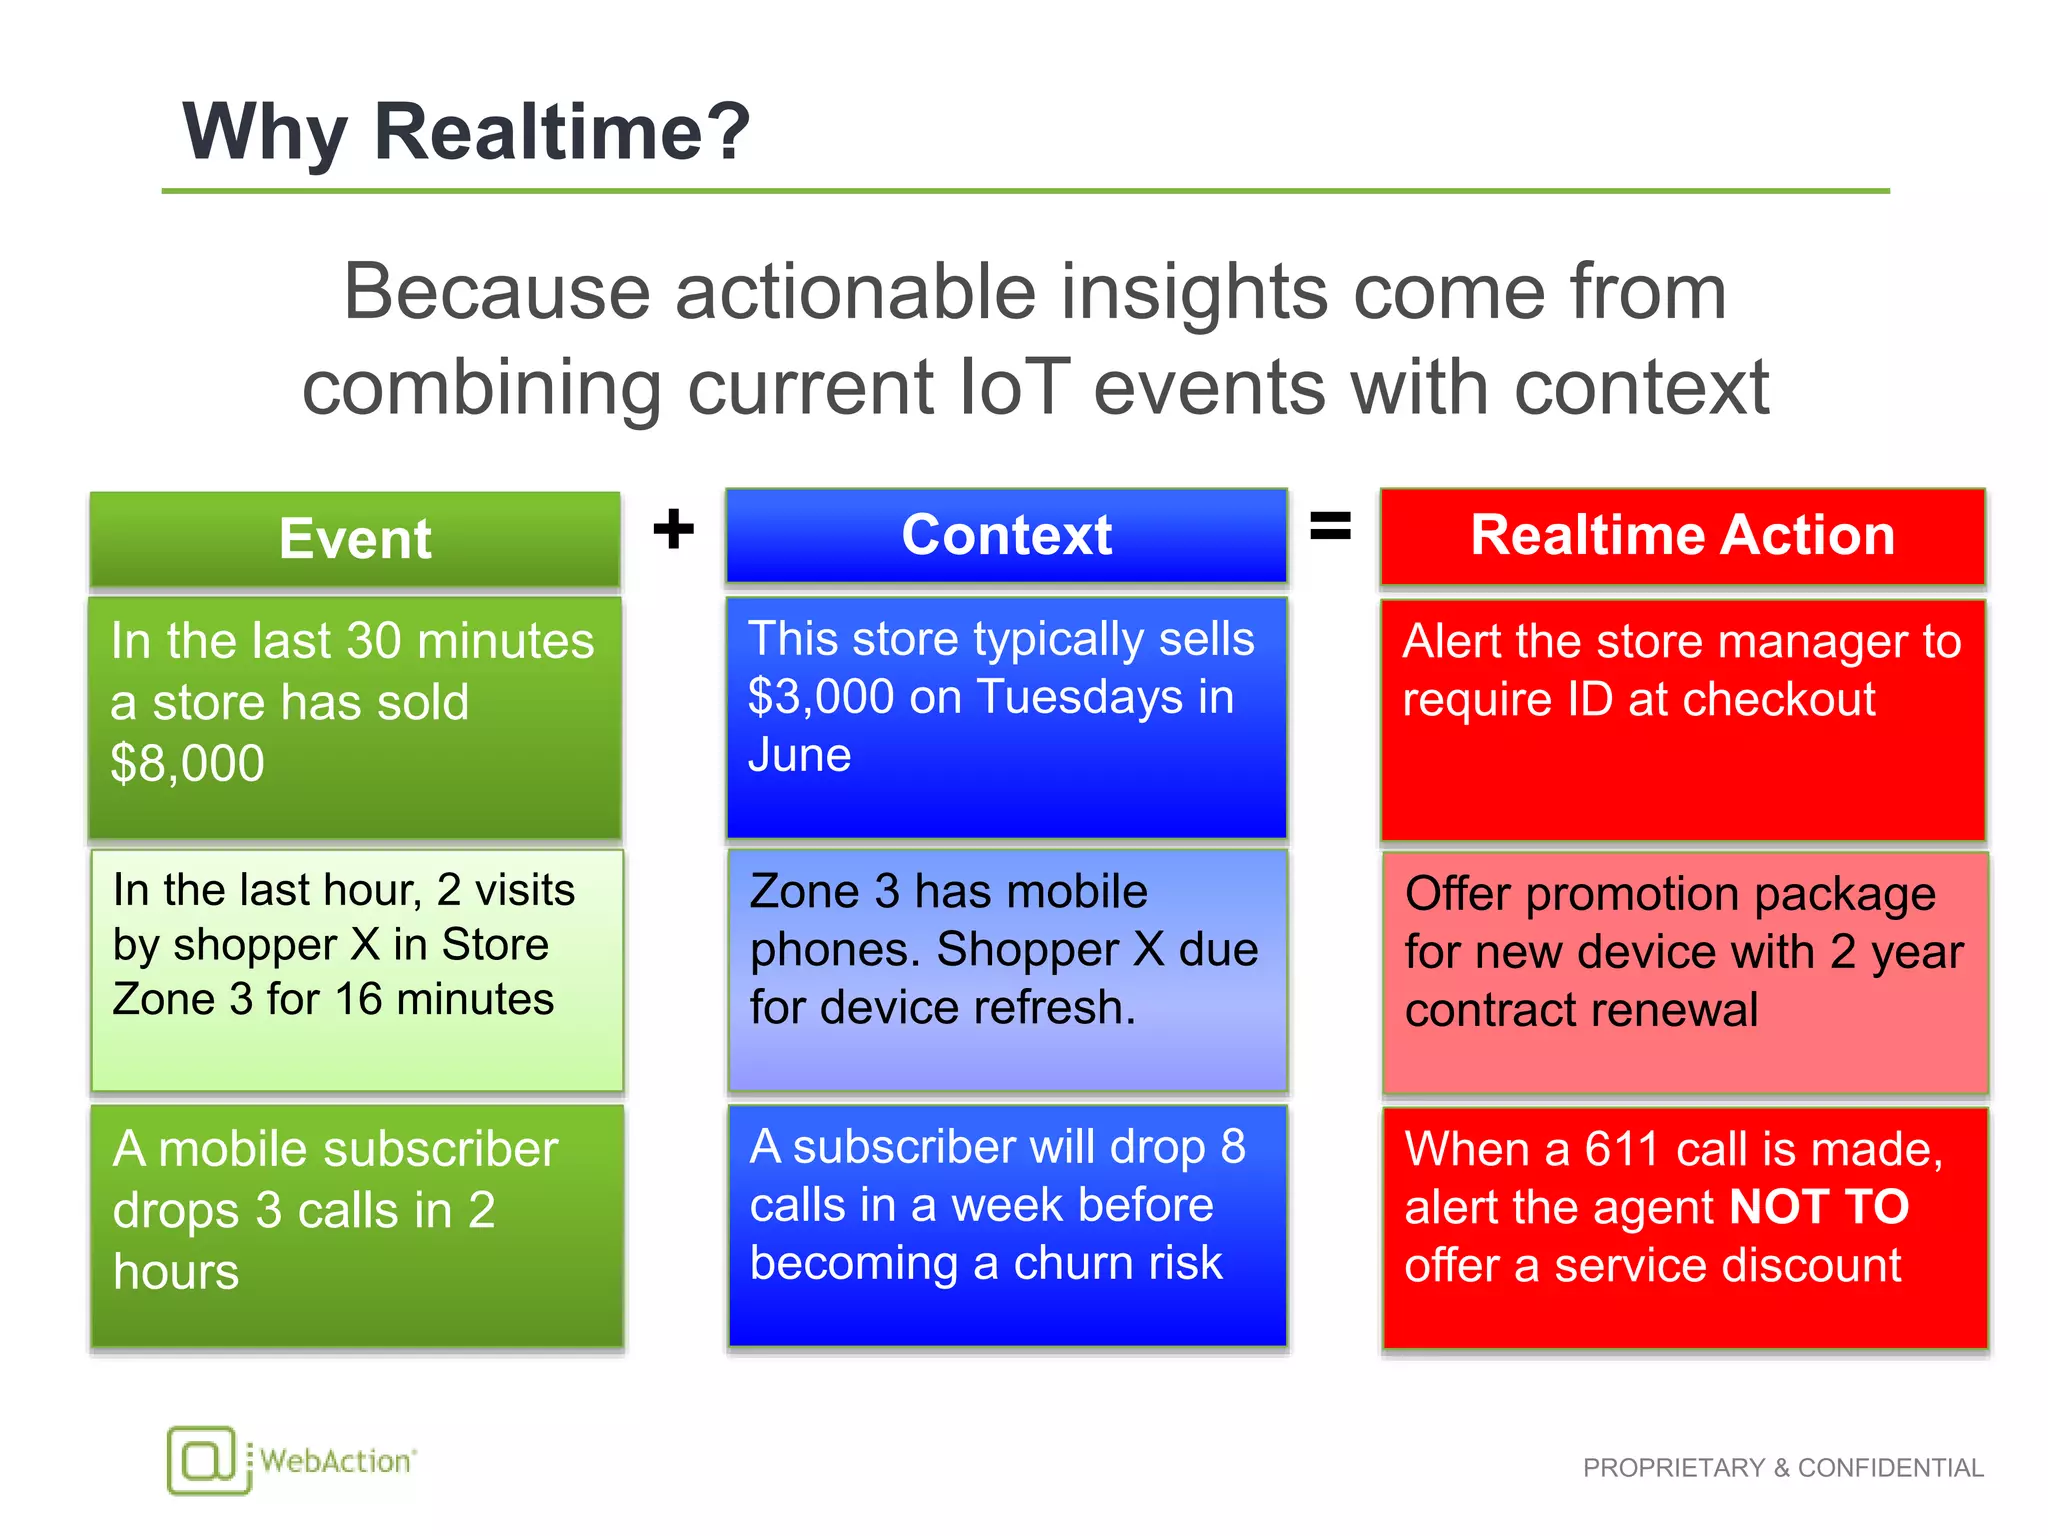
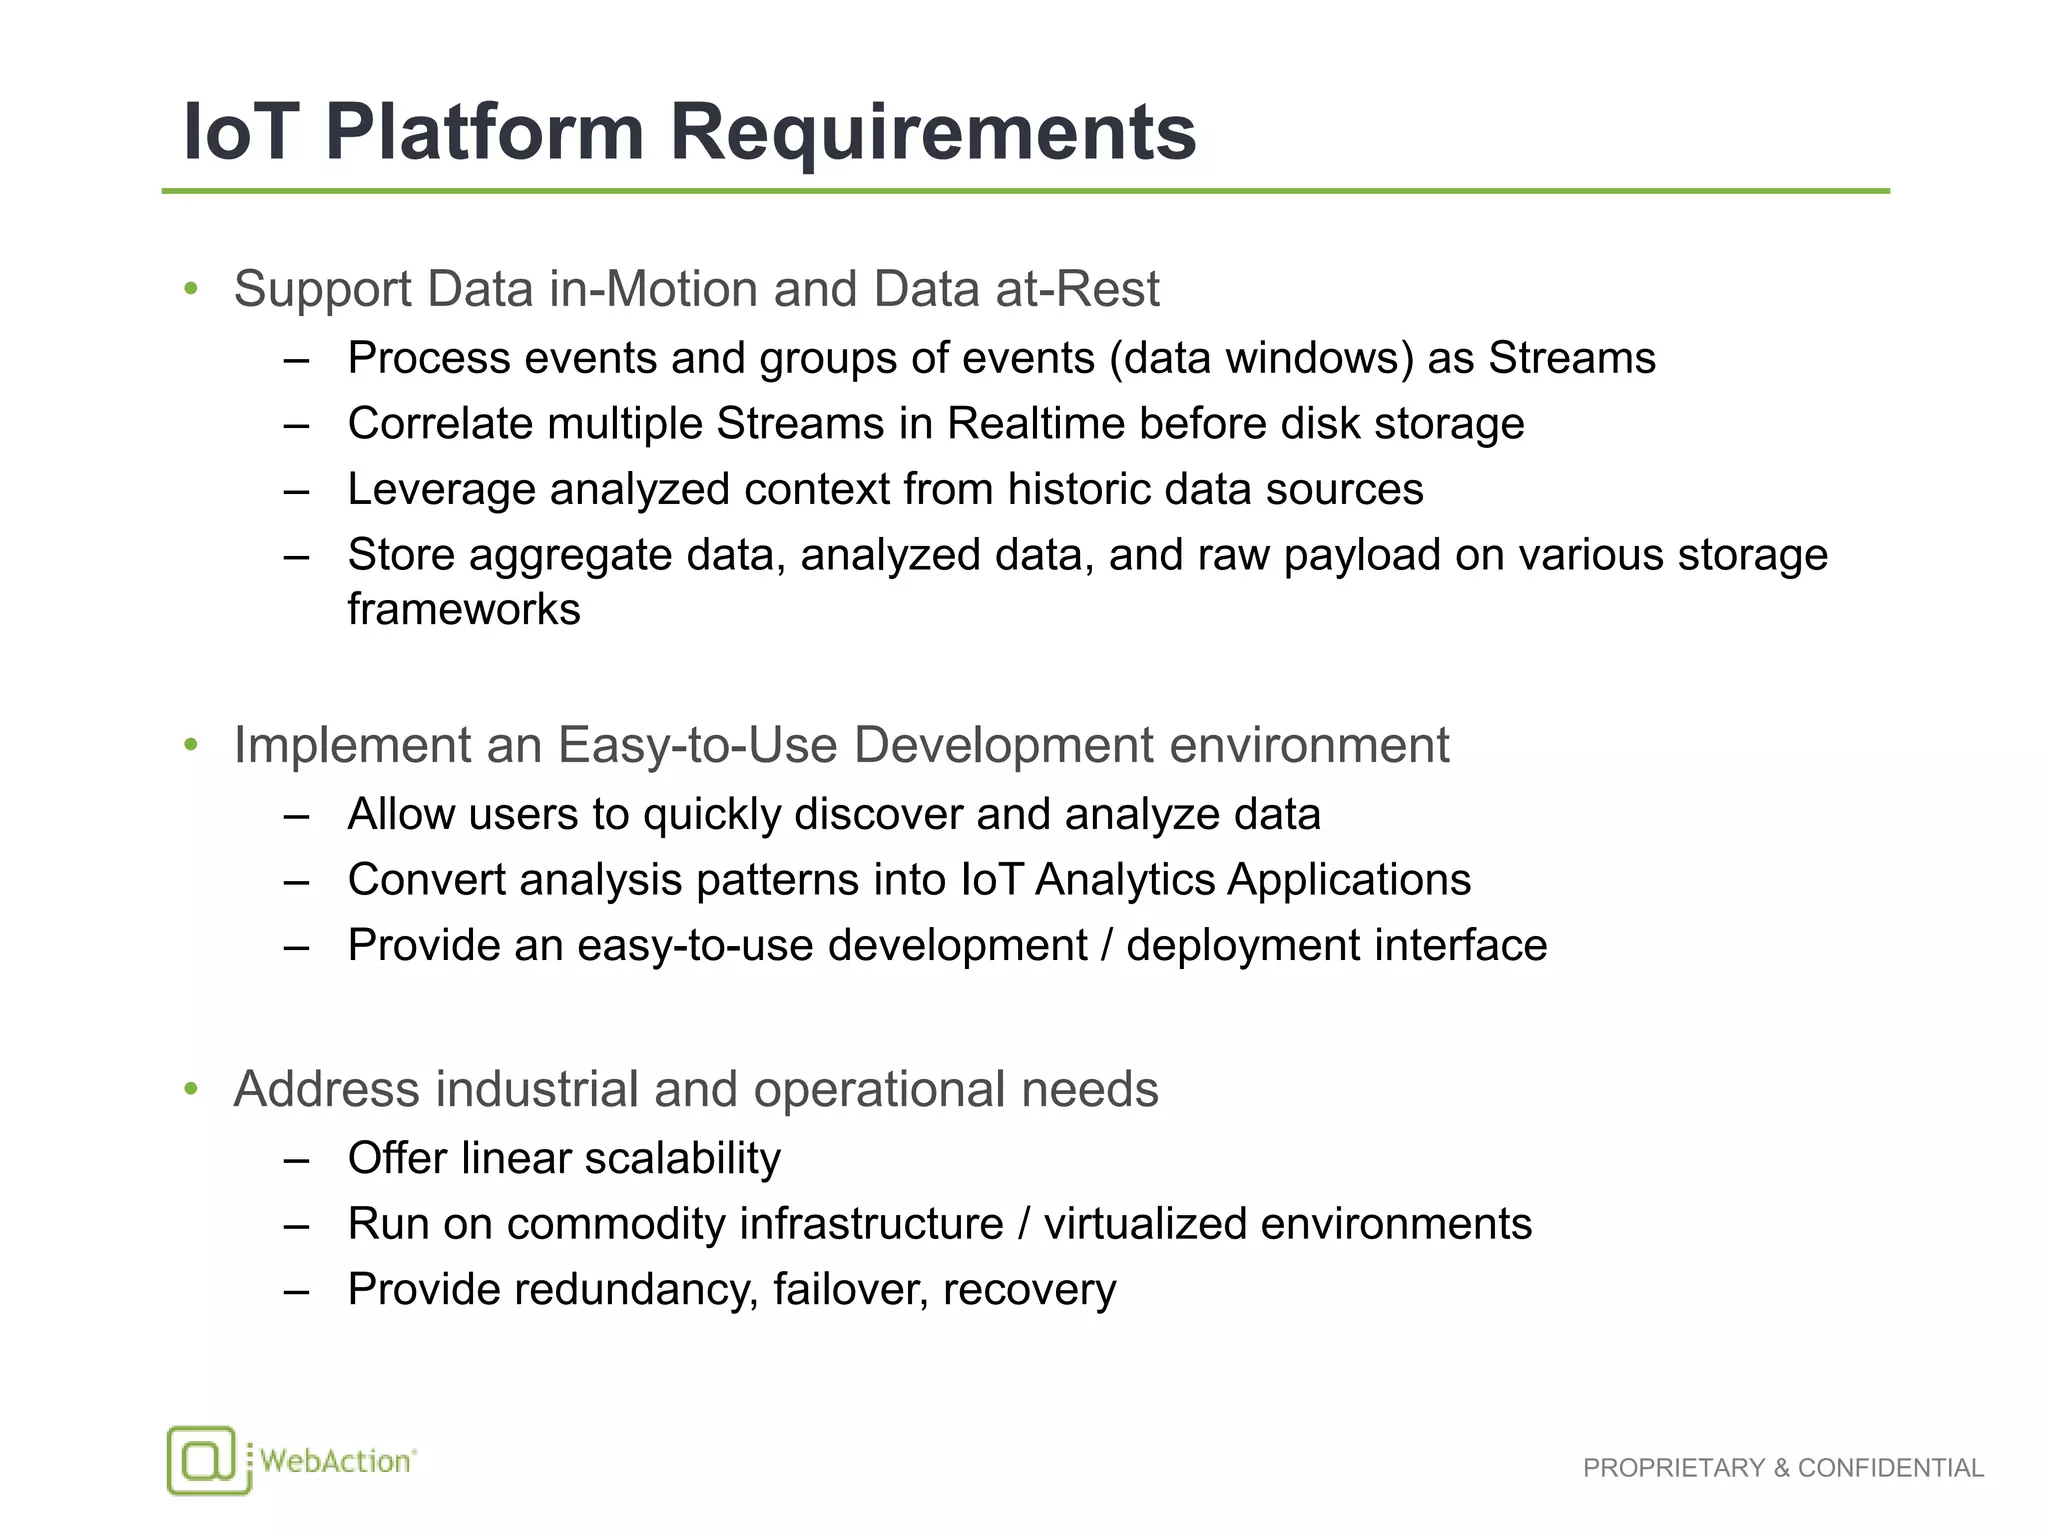
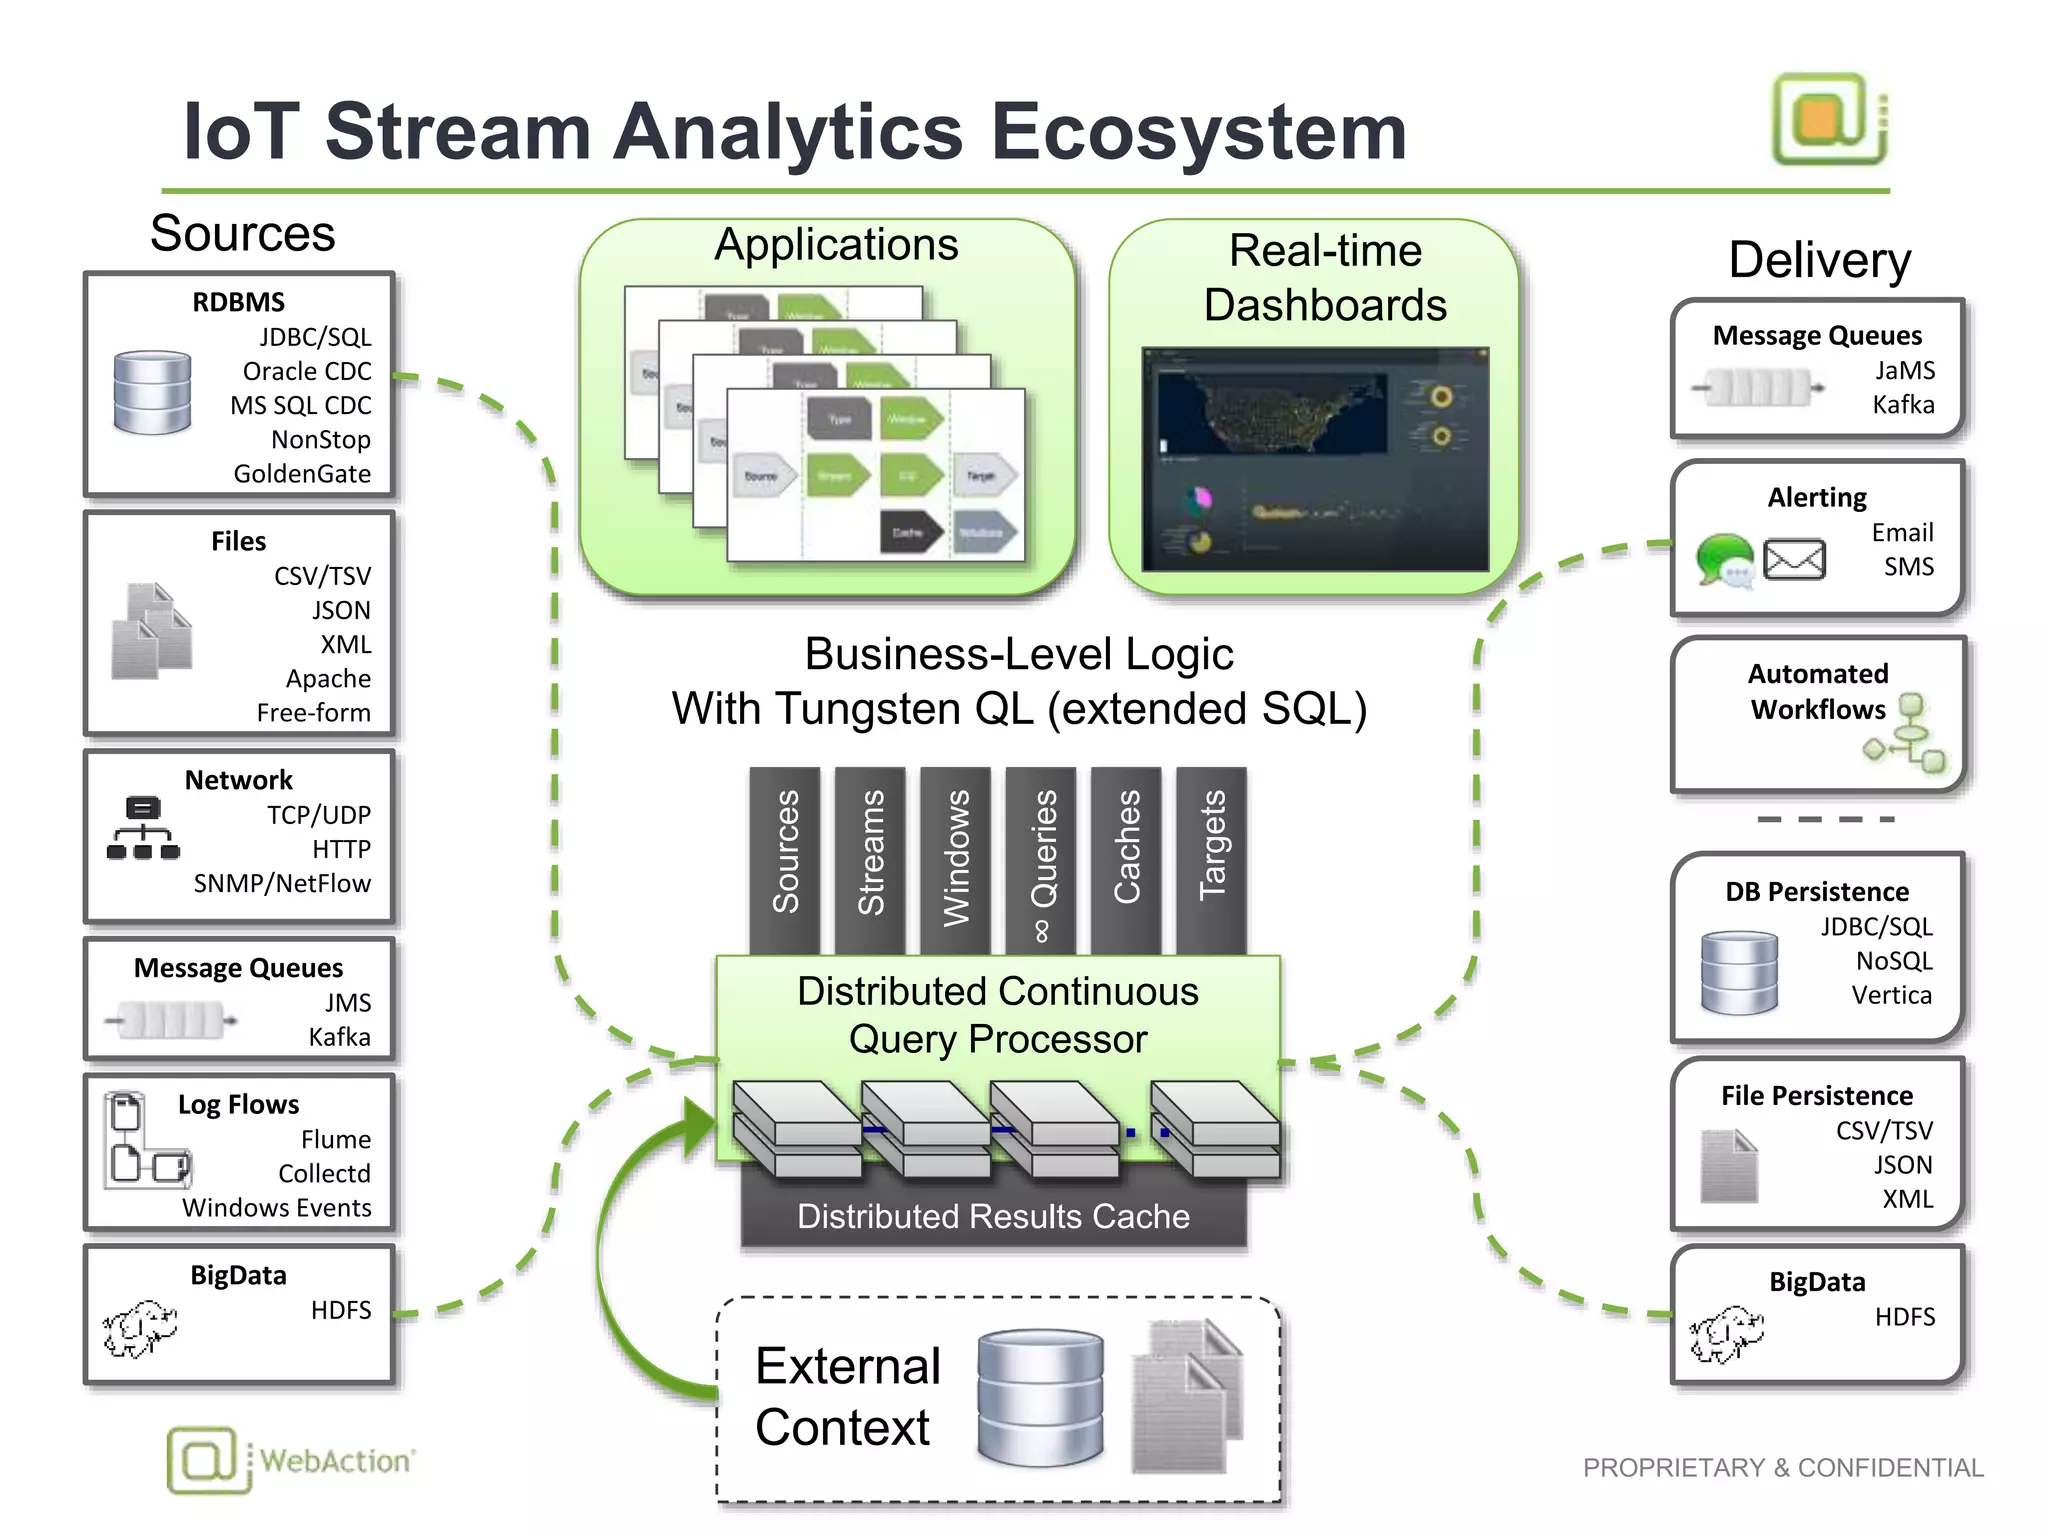
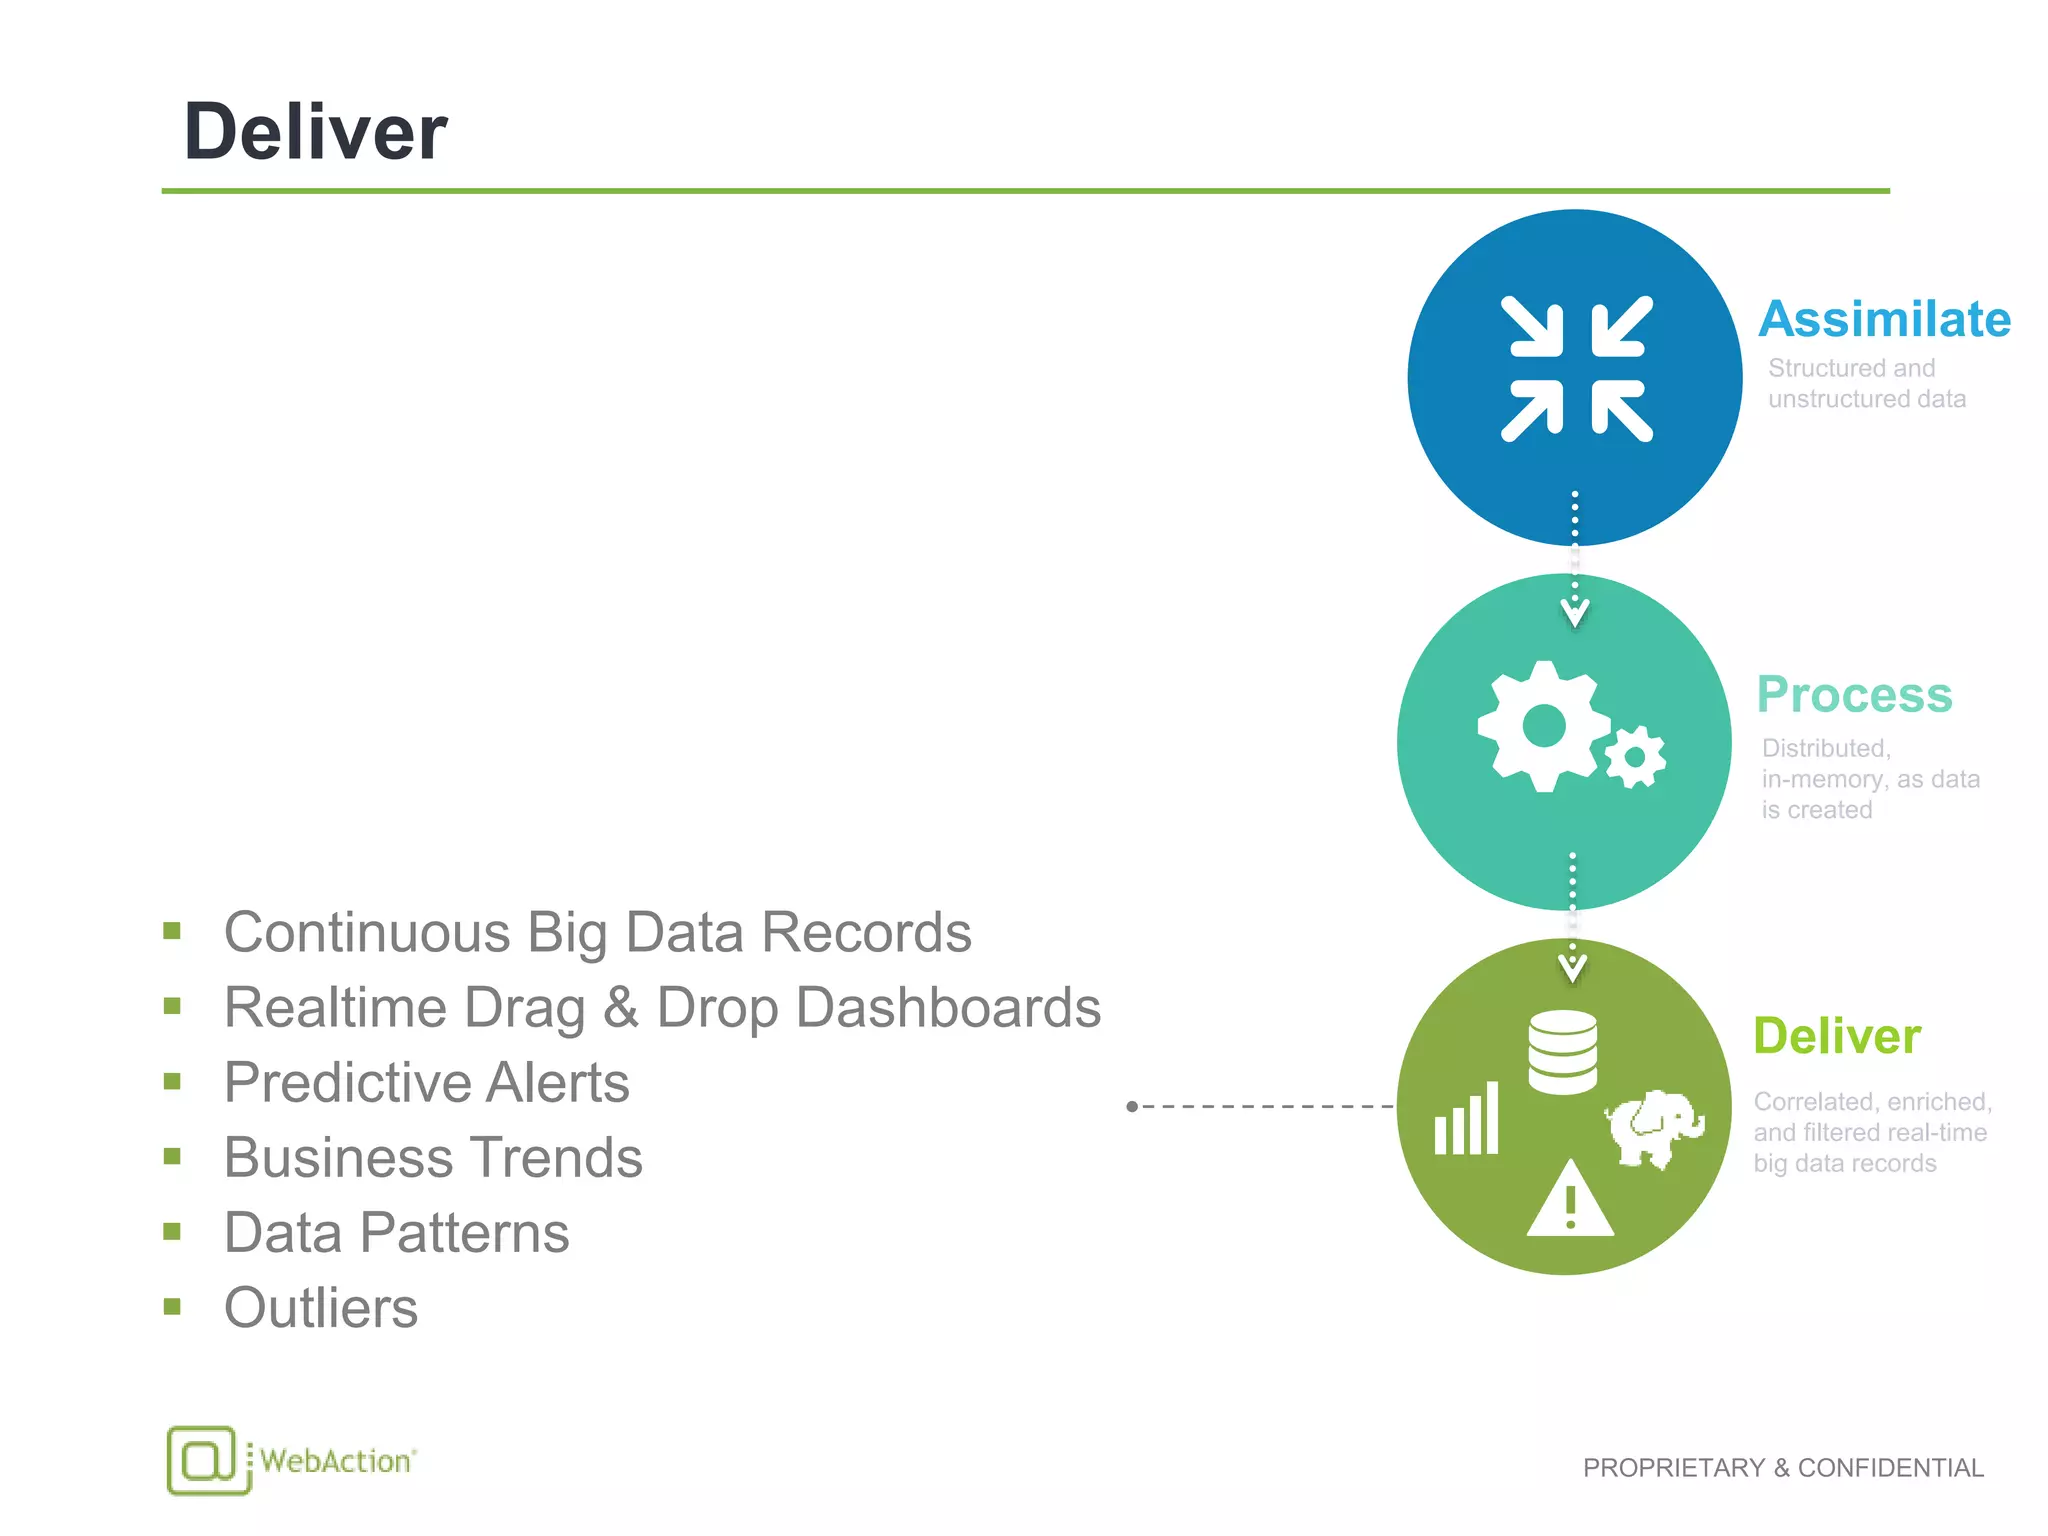
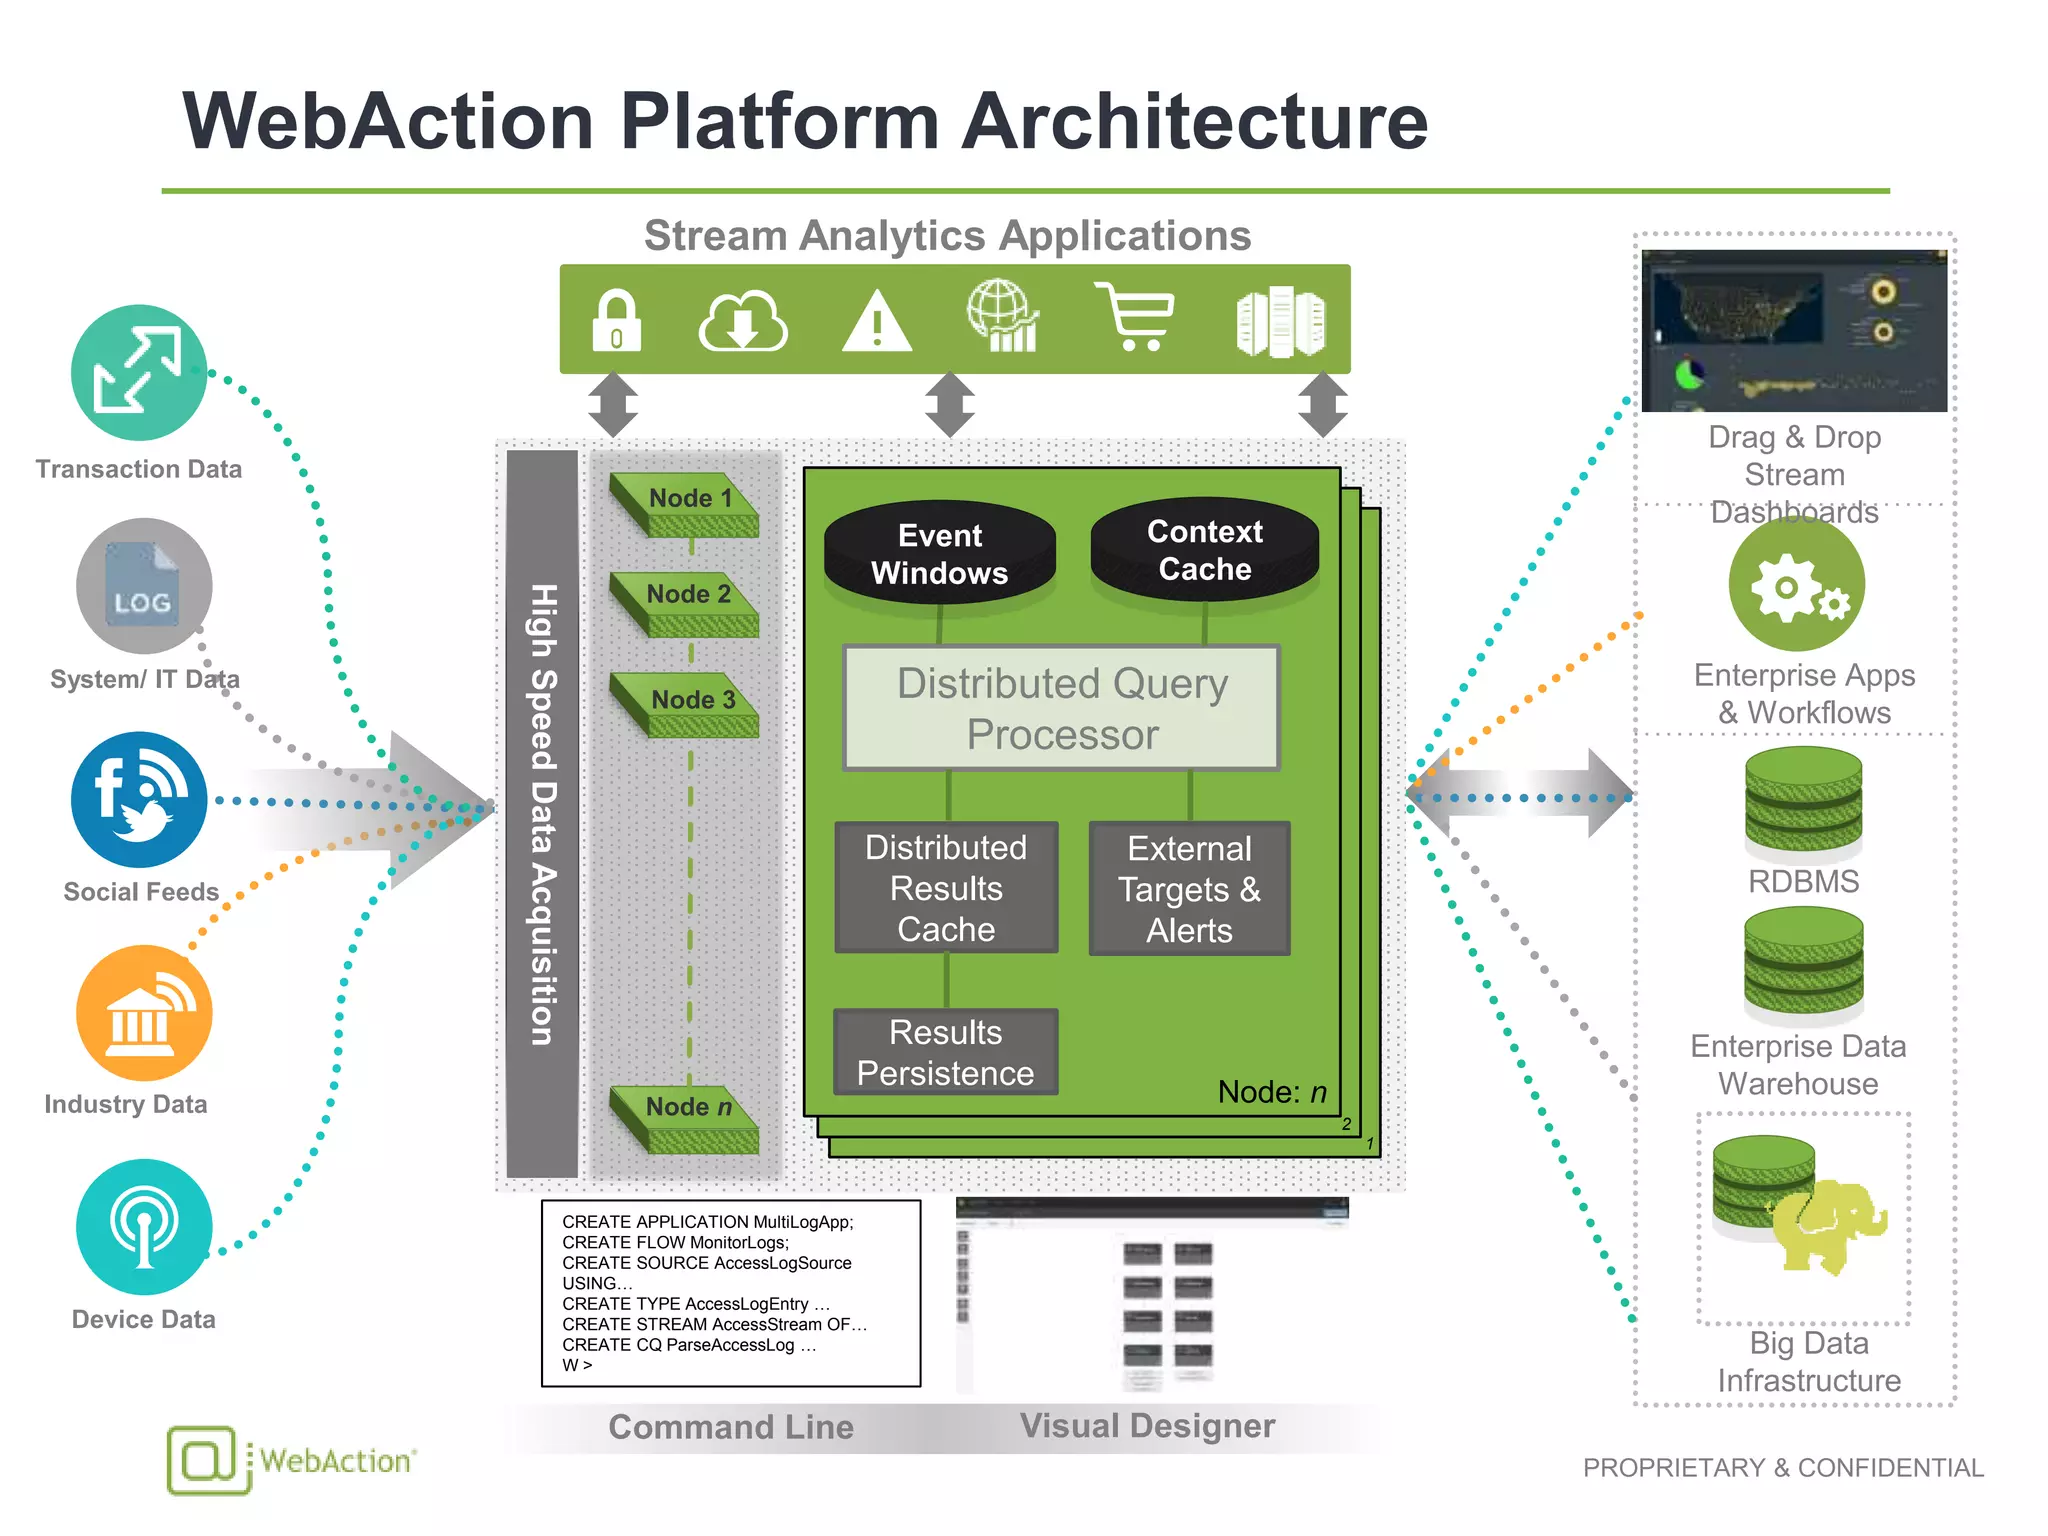
The Internet of Analytics
Discovering actionable insights from
high-velocity streams of real-time IoT data
Sami Akbay, Founder and EVP, WebAction
In-Memory Computing Summit | San Francisco, CA | June 2015
Cheap and Efficient
Data Capture
Affordable sensors,
RFID, antennas,
aggregators,
cameras
Smaller footprint
Low energy
consumption
Continuous
Connectivity from
Everywhere
Wired networks /
wireless networks
Reliable, high
bandwidth
connectivity
Ubiquitous access
virtually from
anywhere
Abundant Compute
Power and Storage
Faster chips
Cheaper Memory
Hadoop / big data
stores
• ERP, CRM, Billing …
• Human generated/captured
• Stored in Databases
• Data inherently valuable
• Data already useful for operations
before analytics
Traditional
• Capture
only events
of interest
Internet of
Things
• Capture
Everything
• Sensor, log, location, …
• Machine generated/captured
• Stored in big data frameworks
• Most of the data has little inherent
value
• Value of data unknown until after
it is analyzed
The Internet of Analytics
Abundant
Compute
Power and
Storage
Continuous
Connectivity
from
Everywhere
Cheap and
efficient
Data
Capture
• Expensive to store in traditional data stores
• Much of it is not useful
IoT generates large volumes of data
• Requires adequate connectivity
• Uses significant network resources
Data comes in spikes or high-velocity continuous
streams
• Data transformation is required
• Data models need to facilitate analytics
Data arrives in a variety of different formats
• Requires platforms that can perform sophisticated Stream analytics
Data contains perishable insights
Source: Internet Of Things Applications Hunger for Hadoop
and Real-Time Analytics in the Cloud
by Mike Gualtieri and Rowan Curran , Forrester
Acquire Store Process
Acquire Process in Memory Deliver
BI /
Analytics
RDBMS EDW
Structured
Data
Machine
Data
LocationClick
Stream
Structured
Data
Machine
Data
LocationClick
Stream
IoT Analytics
Applications
Batch Reactive
R E ALT I M E B AR R I E R
ProactiveRealtime
Visualizations Store
Alerts Integrate
Reduce the Latency to Capture, Analyze, and
Ultimately Take Action to Increase Value
Events
Decision
latency
BusinessValue
Time to Action
Action taken
Data analyzed
Data captured
Based on concept developed by Richard Hackathorn, Bolder Technology
• Oil Rig Drill Sensor:
– Temperature up 10°C  continue drilling
– Temperature up 10°C + Viscosity down  stop drilling
• Hospital Bed:
– Blood O2 below 93%  Patient went to the bathroom
– Blood O2 below 93% and Pulse @ 150BPM  send a doctor
Perfect Storm: An event where
a rare combination of
circumstances aggravate a
situation drastically
You need realtime correlation of multiple data streams
to handle the perfect storm
Actionable insights come from combining
current events with context
Context Realtime Action+ =Event
Historical Context
+
Reference Data
Real-time Event Stream
e.g. Real-time Sensor Events
e.g. Shopper profile,
Store ID, Inventory,
Profitability
e.g. Present Next-Best-Action,
update current price, modify sourcing
Because actionable insights come from
combining current IoT events with context
In the last 30 minutes
a store has sold
$8,000
This store typically sells
$3,000 on Tuesdays in
June
Alert the store manager to
require ID at checkout
In the last hour, 2 visits
by shopper X in Store
Zone 3 for 16 minutes
Zone 3 has mobile
phones. Shopper X due
for device refresh.
Offer promotion package
for new device with 2 year
contract renewal
A mobile subscriber
drops 3 calls in 2
hours
A subscriber will drop 8
calls in a week before
becoming a churn risk
When a 611 call is made,
alert the agent NOT TO
offer a service discount
Context Realtime Action+ =Event
• Support Data in-Motion and Data at-Rest
– Process events and groups of events (data windows) as Streams
– Correlate multiple Streams in Realtime before disk storage
– Leverage analyzed context from historic data sources
– Store aggregate data, analyzed data, and raw payload on various storage
frameworks
• Implement an Easy-to-Use Development environment
– Allow users to quickly discover and analyze data
– Convert analysis patterns into IoT Analytics Applications
– Provide an easy-to-use development / deployment interface
• Address industrial and operational needs
– Offer linear scalability
– Run on commodity infrastructure / virtualized environments
– Provide redundancy, failover, recovery
RDBMS
JDBC/SQL
Oracle CDC
MS SQL CDC
NonStop
GoldenGate
Network
TCP/UDP
HTTP
SNMP/NetFlow
Files
CSV/TSV
JSON
XML
Apache
Free-form
BigData
HDFS
Log Flows
Flume
Collectd
Windows Events
Message Queues
JMS
Kafka
Sources Applications
DB Persistence
JDBC/SQL
NoSQL
Vertica
File Persistence
CSV/TSV
JSON
XML
Automated
Workflows
BigData
HDFS
Alerting
Email
SMS
External
Context
Distributed Results Cache
Sources
Streams
Windows
∞Queries
Caches
Targets
Distributed Continuous
Query Processor
Real-time
Dashboards
Delivery
Business-Level Logic
With Tungsten QL (extended SQL)
Message Queues
JaMS
Kafka
WebAction Solution
Structured and
unstructured data
Distributed,
in-memory, as data
is created
Correlated, enriched,
and filtered real-time
big data records
Deliver
Process
Assimilate
 Data from transactional sources is acquired
via redo or transaction logs
 Structured and non-Structured data
 No Production Impact
 No Application changes
Device Data
Industry Data
Social Feeds
Real-Time
Transaction Data
System/ IT Data
Common File
Format
TYPE EXAMPLE COMPLEXITY
CSV, JSON, XML
Facebook, Twitter
Syslogs, weblogs, event logs
SmartMeter, Medical Device, RFID, Netflow,
iBeacon, CDR
SWIFT, HL7, FIX, ASN
Oracle, DB2, SQLServer, MySQL, HP NonStop
SIMPLE
VERY HIGH
SIMPLE TO MEDIUM
MEDIUM
MEDIUM
HIGH
Structured and
unstructured data
Assimilate
Distributed,
in-memory, as data
is created
Process
 Enrich live Big Data with historical
data sources
 Process Big Data faster using
partitioned streams, caches, and
additional nodes
 Execute SQL-like queries of in-memory
Big Data
 Alert in real-time based on predictive
analytic model results
Structured and
unstructured data
Assimilate
Structured and
unstructured data
Distributed,
in-memory, as data
is created
Correlated, enriched,
and filtered real-time
big data records
Deliver
Process
Assimilate
 Continuous Big Data Records
 Realtime Drag & Drop Dashboards
 Predictive Alerts
 Business Trends
 Data Patterns
 Outliers
Device Data
Big Data
Infrastructure
Industry Data
Social Feeds
Transaction Data
Enterprise Apps
& Workflows
Enterprise Data
Warehouse
RDBMS
Stream Analytics Applications
System/ IT Data
HighSpeedDataAcquisition
Command Line Visual Designer
CREATE APPLICATION MultiLogApp;
CREATE FLOW MonitorLogs;
CREATE SOURCE AccessLogSource
USING…
CREATE TYPE AccessLogEntry …
CREATE STREAM AccessStream OF…
CREATE CQ ParseAccessLog …
W >
Results
Persistence
Context
Cache
Distributed
Results
Cache
Distributed Query
Processor
External
Targets &
Alerts
Event
Windows
Node: n
2
1
Drag & Drop
Stream
Dashboards
Component Definition
Source Access external data and provides realtime continuous events into streams
Stream Carries data between components and nodes
Window Provides moving snapshot/collection of events for aggregates and models
Cache External contextual data made available using distributed in-memory grid
CQ
(Continuous Query)
A Continuous Query emits big data records after processing realtime
streaming events (can process data from streams, windows, caches, event
tables, and stores)
WAction Store
(big data records)
Resulting big data records from processing (aggregates, correlates, anomalies,
predictions) - can be in-memory only or persisted to Elasticsearch / database
Target Outputs realtime big data records to external systems
Application A combination of the above components performing business logic
Dashboard A drag and drop realtime view into stores, caches, and streams
• Create Applications
• Add & Navigate through Flows
• Design Data Model
• Drag & Drop Components
• Configure Components
• Deploy Applications
• Start / Stop Applications
• View Alerts
• View Event Flow Rate
• Add a new application
• Add a source (CDC, structured, semi-structured, etc.)
• Configure Source
• Add a typed stream
• Add a CQ to transform data types
• Add a Cache and CQ for context enrichment
• Design dashboard
• Create multiple pages / drilldowns
• Define data through queries
• Drag and drop visualizations: Values / Icons / Gauges – Maps – Line Charts –
Scatter / Bubble Plots – Pie / Donut Charts – Bar Charts – Tables – Heat
Maps
• Add a new Dashboard
• Add a Visualization
• Configure Query and Visualization
• View Data Visualized
• Filter data in a page
• Drilldown to related and detail pages
• Realtime log / database CDC reading in addition to push sources like
TCP/JMS
• Bytecode generation for data types and query processing
• Scaling across multiple nodes with flexible deployment
• Auto failover of application components from one node to another
• Nodes can be added and removed while applications are running
• Recovery ensures no events are missed or processed twice
• Recovery takes window contents into account
• Role based security at the application through component level
• Integrated realtime dashboard visualizations using server push
WebAction Headquarters
info@webaction.com
+1 (650) 241-0680
LinkedIn.com/company/WebAction-Inc- facebook.com/WebActionSoftware Twitter.com/WebActionInc

WebAction In-Memory Computing Summit 2015

  • 1.
    The Internet ofAnalytics Discovering actionable insights from high-velocity streams of real-time IoT data Sami Akbay, Founder and EVP, WebAction In-Memory Computing Summit | San Francisco, CA | June 2015
  • 2.
    Cheap and Efficient DataCapture Affordable sensors, RFID, antennas, aggregators, cameras Smaller footprint Low energy consumption Continuous Connectivity from Everywhere Wired networks / wireless networks Reliable, high bandwidth connectivity Ubiquitous access virtually from anywhere Abundant Compute Power and Storage Faster chips Cheaper Memory Hadoop / big data stores
  • 3.
    • ERP, CRM,Billing … • Human generated/captured • Stored in Databases • Data inherently valuable • Data already useful for operations before analytics Traditional • Capture only events of interest Internet of Things • Capture Everything • Sensor, log, location, … • Machine generated/captured • Stored in big data frameworks • Most of the data has little inherent value • Value of data unknown until after it is analyzed
  • 4.
    The Internet ofAnalytics Abundant Compute Power and Storage Continuous Connectivity from Everywhere Cheap and efficient Data Capture
  • 5.
    • Expensive tostore in traditional data stores • Much of it is not useful IoT generates large volumes of data • Requires adequate connectivity • Uses significant network resources Data comes in spikes or high-velocity continuous streams • Data transformation is required • Data models need to facilitate analytics Data arrives in a variety of different formats • Requires platforms that can perform sophisticated Stream analytics Data contains perishable insights Source: Internet Of Things Applications Hunger for Hadoop and Real-Time Analytics in the Cloud by Mike Gualtieri and Rowan Curran , Forrester
  • 6.
    Acquire Store Process AcquireProcess in Memory Deliver BI / Analytics RDBMS EDW Structured Data Machine Data LocationClick Stream Structured Data Machine Data LocationClick Stream IoT Analytics Applications Batch Reactive R E ALT I M E B AR R I E R ProactiveRealtime Visualizations Store Alerts Integrate
  • 7.
    Reduce the Latencyto Capture, Analyze, and Ultimately Take Action to Increase Value Events Decision latency BusinessValue Time to Action Action taken Data analyzed Data captured Based on concept developed by Richard Hackathorn, Bolder Technology
  • 8.
    • Oil RigDrill Sensor: – Temperature up 10°C  continue drilling – Temperature up 10°C + Viscosity down  stop drilling • Hospital Bed: – Blood O2 below 93%  Patient went to the bathroom – Blood O2 below 93% and Pulse @ 150BPM  send a doctor Perfect Storm: An event where a rare combination of circumstances aggravate a situation drastically You need realtime correlation of multiple data streams to handle the perfect storm
  • 9.
    Actionable insights comefrom combining current events with context Context Realtime Action+ =Event Historical Context + Reference Data Real-time Event Stream e.g. Real-time Sensor Events e.g. Shopper profile, Store ID, Inventory, Profitability e.g. Present Next-Best-Action, update current price, modify sourcing
  • 10.
    Because actionable insightscome from combining current IoT events with context In the last 30 minutes a store has sold $8,000 This store typically sells $3,000 on Tuesdays in June Alert the store manager to require ID at checkout In the last hour, 2 visits by shopper X in Store Zone 3 for 16 minutes Zone 3 has mobile phones. Shopper X due for device refresh. Offer promotion package for new device with 2 year contract renewal A mobile subscriber drops 3 calls in 2 hours A subscriber will drop 8 calls in a week before becoming a churn risk When a 611 call is made, alert the agent NOT TO offer a service discount Context Realtime Action+ =Event
  • 11.
    • Support Datain-Motion and Data at-Rest – Process events and groups of events (data windows) as Streams – Correlate multiple Streams in Realtime before disk storage – Leverage analyzed context from historic data sources – Store aggregate data, analyzed data, and raw payload on various storage frameworks • Implement an Easy-to-Use Development environment – Allow users to quickly discover and analyze data – Convert analysis patterns into IoT Analytics Applications – Provide an easy-to-use development / deployment interface • Address industrial and operational needs – Offer linear scalability – Run on commodity infrastructure / virtualized environments – Provide redundancy, failover, recovery
  • 12.
    RDBMS JDBC/SQL Oracle CDC MS SQLCDC NonStop GoldenGate Network TCP/UDP HTTP SNMP/NetFlow Files CSV/TSV JSON XML Apache Free-form BigData HDFS Log Flows Flume Collectd Windows Events Message Queues JMS Kafka Sources Applications DB Persistence JDBC/SQL NoSQL Vertica File Persistence CSV/TSV JSON XML Automated Workflows BigData HDFS Alerting Email SMS External Context Distributed Results Cache Sources Streams Windows ∞Queries Caches Targets Distributed Continuous Query Processor Real-time Dashboards Delivery Business-Level Logic With Tungsten QL (extended SQL) Message Queues JaMS Kafka
  • 13.
  • 14.
    Structured and unstructured data Distributed, in-memory,as data is created Correlated, enriched, and filtered real-time big data records Deliver Process Assimilate
  • 15.
     Data fromtransactional sources is acquired via redo or transaction logs  Structured and non-Structured data  No Production Impact  No Application changes Device Data Industry Data Social Feeds Real-Time Transaction Data System/ IT Data Common File Format TYPE EXAMPLE COMPLEXITY CSV, JSON, XML Facebook, Twitter Syslogs, weblogs, event logs SmartMeter, Medical Device, RFID, Netflow, iBeacon, CDR SWIFT, HL7, FIX, ASN Oracle, DB2, SQLServer, MySQL, HP NonStop SIMPLE VERY HIGH SIMPLE TO MEDIUM MEDIUM MEDIUM HIGH Structured and unstructured data Assimilate
  • 16.
    Distributed, in-memory, as data iscreated Process  Enrich live Big Data with historical data sources  Process Big Data faster using partitioned streams, caches, and additional nodes  Execute SQL-like queries of in-memory Big Data  Alert in real-time based on predictive analytic model results Structured and unstructured data Assimilate
  • 17.
    Structured and unstructured data Distributed, in-memory,as data is created Correlated, enriched, and filtered real-time big data records Deliver Process Assimilate  Continuous Big Data Records  Realtime Drag & Drop Dashboards  Predictive Alerts  Business Trends  Data Patterns  Outliers
  • 18.
    Device Data Big Data Infrastructure IndustryData Social Feeds Transaction Data Enterprise Apps & Workflows Enterprise Data Warehouse RDBMS Stream Analytics Applications System/ IT Data HighSpeedDataAcquisition Command Line Visual Designer CREATE APPLICATION MultiLogApp; CREATE FLOW MonitorLogs; CREATE SOURCE AccessLogSource USING… CREATE TYPE AccessLogEntry … CREATE STREAM AccessStream OF… CREATE CQ ParseAccessLog … W > Results Persistence Context Cache Distributed Results Cache Distributed Query Processor External Targets & Alerts Event Windows Node: n 2 1 Drag & Drop Stream Dashboards
  • 19.
    Component Definition Source Accessexternal data and provides realtime continuous events into streams Stream Carries data between components and nodes Window Provides moving snapshot/collection of events for aggregates and models Cache External contextual data made available using distributed in-memory grid CQ (Continuous Query) A Continuous Query emits big data records after processing realtime streaming events (can process data from streams, windows, caches, event tables, and stores) WAction Store (big data records) Resulting big data records from processing (aggregates, correlates, anomalies, predictions) - can be in-memory only or persisted to Elasticsearch / database Target Outputs realtime big data records to external systems Application A combination of the above components performing business logic Dashboard A drag and drop realtime view into stores, caches, and streams
  • 21.
    • Create Applications •Add & Navigate through Flows • Design Data Model • Drag & Drop Components • Configure Components • Deploy Applications • Start / Stop Applications • View Alerts • View Event Flow Rate
  • 22.
    • Add anew application • Add a source (CDC, structured, semi-structured, etc.) • Configure Source
  • 23.
    • Add atyped stream • Add a CQ to transform data types • Add a Cache and CQ for context enrichment
  • 25.
    • Design dashboard •Create multiple pages / drilldowns • Define data through queries • Drag and drop visualizations: Values / Icons / Gauges – Maps – Line Charts – Scatter / Bubble Plots – Pie / Donut Charts – Bar Charts – Tables – Heat Maps
  • 26.
    • Add anew Dashboard • Add a Visualization • Configure Query and Visualization
  • 27.
    • View DataVisualized • Filter data in a page • Drilldown to related and detail pages
  • 28.
    • Realtime log/ database CDC reading in addition to push sources like TCP/JMS • Bytecode generation for data types and query processing • Scaling across multiple nodes with flexible deployment • Auto failover of application components from one node to another • Nodes can be added and removed while applications are running • Recovery ensures no events are missed or processed twice • Recovery takes window contents into account • Role based security at the application through component level • Integrated realtime dashboard visualizations using server push
  • 29.
    WebAction Headquarters info@webaction.com +1 (650)241-0680 LinkedIn.com/company/WebAction-Inc- facebook.com/WebActionSoftware Twitter.com/WebActionInc

Editor's Notes

  • #10 Added windows to event streams – feel free to tweak. Here was what we wanted to get across on the Context topic: Combine multiple realtime streams for context. If A and B happen. Event correlation. Include time and windowing.  Historic context - same store sales from last year.  Reference data - Store ID. Combined through Multi-load correlation and lookups. Need to flesh out the context piece of this slide without mentioning WebAction. Update use case references for IoT.
  • #11 Edit this slide to include an IoT use case in the first position. You may also want to take an IoT angle on the other use cases. John Schaeffer has a couple of different use cases for this slide you may wish to plagiarize from.
  • #13 We need to add in all of the IoT Data Sources to this graphic. I don’t seem to have that particular data source slide that includes the IoT sources. Is this where you’d like to talk about “Enables data that was previously uncapturable - ability to capture the data”. If not, please be sure to mention this concept where appropriate, or create a slide to speak to it. I added Automated Workflows to Delivery.