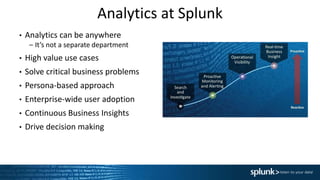
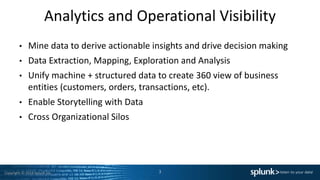
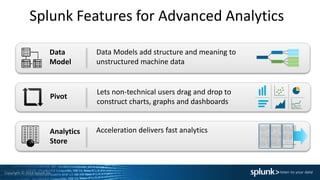
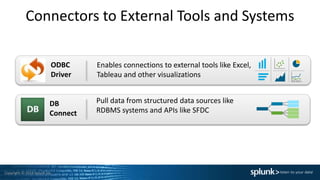
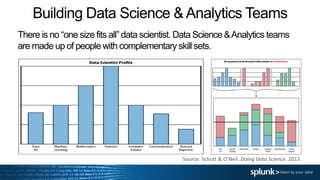
Copyright © 2014 Splunk Inc.
Advanced Analytics
Pete Sicilia
Chief of Staff, Analytics Markets
Dr. Tom LaGatta
Senior Data Scientist / Analytics Specialist
Analytics at Splunk
• Analytics can be anywhere
– It’s not a separate department
• High value use cases
• Solve critical business problems
• Persona-based approach
• Enterprise-wide user adoption
• Continuous Business Insights
• Drive decision making
Copyright © 2014 Splunk Inc.
Analytics and Operational Visibility
• Mine data to derive actionable insights and drive decision making
• Data Extraction, Mapping, Exploration and Analysis
• Unify machine + structured data to create 360 view of business
entities (customers, orders, transactions, etc).
• Enable Storytelling with Data
• Cross Organizational Silos
3
Copyright © 2014 Splunk Inc.
Analytics Ecosystem
4
Copyright © 2014 Splunk Inc.
Splunk Features for Advanced Analytics
Acceleration delivers fast analyticsAnalytics
Store
Lets non-technical users drag and drop to
construct charts, graphs and dashboards
Data Models add structure and meaning to
unstructured machine data
Data
Model
Pivot
Copyright © 2014 Splunk Inc.
Connectors to External Tools and Systems
Enables connections to external tools like Excel,
Tableau and other visualizations
Pull data from structured data sources like
RDBMS systems and APIs like SFDC
ODBC
Driver
DB
Connect
Successful Analytics
Projects
Intro to Personas
• Persona is a concept we use to define various user types in a Splunk
deployment.
• This is different than a Splunk role.
• Core IT personas (e.g. SysAdmins, Developers and Splunk Admins)
keep systems running, fix them when they break and plan for
capacity
• As your Splunk deployment grows out of Core IT…
Each business unit has their own set of personas
They have unique problems to solve and their preferred ways to interact with
or consume data
Building Data Science & Analytics Teams
There is no “one size fits all” data scientist. Data Science &Analytics teams
are made up of people with complementary skill sets.
Source: Schutt & O’Neil. Doing Data Science. 2013
Copyright © 2014 Splunk Inc.
Personas Requirements
As you encounter personas make sure you spend time collecting
their search and reporting and data requirements, but also pay
attention to the bigger picture.
• Gather Requirements (What is their Business Problem?)
• Get Relevant Data (Is the data they need in Splunk? What
other data helps answer their questions?)
• Build Searches/Datamodels
• Consume Results (Dashboards, visualization, 3rd party tools)
Developing for Business: Gather Requirements
• What is the question I’m trying to answer?
– What is their Business Problem?
– What department are we dealing with?
– Where do they fit in the organization?
– Who is the end user primary contact?
– Do they have a (trained) power user?
– Engagement/support model
 Self-service?
 Full change control/Formal requests?
 2 hour power session?
Developing for the Business: Get relevant data
• Where is the data that will help me answer the question?
• What are the relevant fields and what is the best way to
retrieve them?
• What data sources drive those constructs?
• Is the primary data in Splunk?
• Can I enrich Splunk data sources with external data feeds and
provide mash-ups?
• Should I be replacing legacy SQL queries with DBConnect?
• Should I index DBConnect data or just use it as a lookup?
Copyright © 2014 Splunk Inc.
Developing for Business: Searches/Datamodels
• What is the sequence of operations that convert my data into
the answer for my question?
• What Searches can they use to solve those problems?
• How do I constrain and audit user data access?
• How do I construct my search, build my datamodel, port my
SQL?
• Do I know where to get help?
– Splunk has Docs, Education, Support, IRC and Answers
Copyright © 2014 Splunk Inc.
Developing for Business: Consuming results
• Persona-relevant landing Dashboard
• Limit access to what they need to get the job done
– Time picker default timerange and limited options
– Form search
– Open in search vs open in pivot?
• Who will build and maintain the dashboards/datamodels?
• How do I construct my search, build my dashboards?
• How do they prefer to consume the results? Splunk? PDF? 3rd
Party Tool?
– Are we using the ODBC driver the right way?
– Returning search results vs exporting all data
• Who else would like access to these results? CIO? E-staff?
Advanced Analytics
With Splunk
(use cases and techniques)
Anomaly Detection & Clustering
•Anomaly Detection is one of Splunk’s most common use cases:
– Faster-than-humantransactions
– Intrusion & insider threat detection
– High-value customer purchase patterns
•Lots of solutions forAnomaly Detection:
– Clustering: cluster,kmeans,Event Patternstab
– AD: anomalies,anomalousvalue,outliers
– Alert on rate of statisticaloutliers (eg 5% → 15% triggers alert)
– Advanced threat detection (Enterprise Security)
•Integrate high-risk anomalies into incident review
Data Visualization
Data Viz:The creation and study of the visual representation of data.
•After processing, all data must be consumed:
– Machines can consume any kind of data
– People must visualize or listen to the data
•Splunk helps deliver actionable insights:
– Out-of-the-boxcharts & tables
– Easy-to-customizeD3 visualizations
– Drilldown & form inputs enable interactivity
Source: Satoshi’s Custom Visualizations app
https://splunkbase.splunk.com/app/2717/
Custom Viz: Sankey Chart
•Sankey charts illustrate flows through multiple stages
– You choose nodes & edges
•Lots of use cases:
– Customer paths through website
– Order tracking through system
– Any type of process flows
•Drilldown to go further:
– Why do these flows yield purchases?
– Which edges have high traffic?
– Where are the bottlenecks?
Nodes = stations. Edges = routes
Citibike data from:
http://www.citibikenyc.com/system-data
PredictiveAnalytics
Use predict to forecast time series into the future.
•Implements a Kalman filter
to identify seasonal trends.
– Best fit line & uncertainty envelope
•Lots of applications:
– Forecast revenue & other KPIs
– Estimate MTTR & server outages
– Dynamic baselining
– Capacity planning (AWSApp)
– Security threats (Enterprise Security)
•Remember: the future is always uncertain…
Demo
Growing beyond IT: Call to action!
• CIO and CDO care about Actionable Insights
• Build some Executive dashboards
• Crossing silos can be tricky
• Organization, communication,
documentation help immensely!
Next Steps
•Reach out to your localtechnical team!
– Your local Sales Engineers are happy to help
– Analytics SMEs are available for advanced use
cases
– Analytics Specialist team is available for
escalations
•We’ve got you covered. We’re here to help!
Thank You

Advanced Use Cases for Analytics Breakout Session

  • 1.
    Copyright © 2014Splunk Inc. Advanced Analytics Pete Sicilia Chief of Staff, Analytics Markets Dr. Tom LaGatta Senior Data Scientist / Analytics Specialist
  • 2.
    Analytics at Splunk •Analytics can be anywhere – It’s not a separate department • High value use cases • Solve critical business problems • Persona-based approach • Enterprise-wide user adoption • Continuous Business Insights • Drive decision making
  • 3.
    Copyright © 2014Splunk Inc. Analytics and Operational Visibility • Mine data to derive actionable insights and drive decision making • Data Extraction, Mapping, Exploration and Analysis • Unify machine + structured data to create 360 view of business entities (customers, orders, transactions, etc). • Enable Storytelling with Data • Cross Organizational Silos 3
  • 4.
    Copyright © 2014Splunk Inc. Analytics Ecosystem 4
  • 5.
    Copyright © 2014Splunk Inc. Splunk Features for Advanced Analytics Acceleration delivers fast analyticsAnalytics Store Lets non-technical users drag and drop to construct charts, graphs and dashboards Data Models add structure and meaning to unstructured machine data Data Model Pivot
  • 6.
    Copyright © 2014Splunk Inc. Connectors to External Tools and Systems Enables connections to external tools like Excel, Tableau and other visualizations Pull data from structured data sources like RDBMS systems and APIs like SFDC ODBC Driver DB Connect
  • 7.
  • 8.
    Intro to Personas •Persona is a concept we use to define various user types in a Splunk deployment. • This is different than a Splunk role. • Core IT personas (e.g. SysAdmins, Developers and Splunk Admins) keep systems running, fix them when they break and plan for capacity • As your Splunk deployment grows out of Core IT… Each business unit has their own set of personas They have unique problems to solve and their preferred ways to interact with or consume data
  • 9.
    Building Data Science& Analytics Teams There is no “one size fits all” data scientist. Data Science &Analytics teams are made up of people with complementary skill sets. Source: Schutt & O’Neil. Doing Data Science. 2013
  • 10.
    Copyright © 2014Splunk Inc. Personas Requirements As you encounter personas make sure you spend time collecting their search and reporting and data requirements, but also pay attention to the bigger picture. • Gather Requirements (What is their Business Problem?) • Get Relevant Data (Is the data they need in Splunk? What other data helps answer their questions?) • Build Searches/Datamodels • Consume Results (Dashboards, visualization, 3rd party tools)
  • 11.
    Developing for Business:Gather Requirements • What is the question I’m trying to answer? – What is their Business Problem? – What department are we dealing with? – Where do they fit in the organization? – Who is the end user primary contact? – Do they have a (trained) power user? – Engagement/support model  Self-service?  Full change control/Formal requests?  2 hour power session?
  • 12.
    Developing for theBusiness: Get relevant data • Where is the data that will help me answer the question? • What are the relevant fields and what is the best way to retrieve them? • What data sources drive those constructs? • Is the primary data in Splunk? • Can I enrich Splunk data sources with external data feeds and provide mash-ups? • Should I be replacing legacy SQL queries with DBConnect? • Should I index DBConnect data or just use it as a lookup?
  • 13.
    Copyright © 2014Splunk Inc. Developing for Business: Searches/Datamodels • What is the sequence of operations that convert my data into the answer for my question? • What Searches can they use to solve those problems? • How do I constrain and audit user data access? • How do I construct my search, build my datamodel, port my SQL? • Do I know where to get help? – Splunk has Docs, Education, Support, IRC and Answers
  • 14.
    Copyright © 2014Splunk Inc. Developing for Business: Consuming results • Persona-relevant landing Dashboard • Limit access to what they need to get the job done – Time picker default timerange and limited options – Form search – Open in search vs open in pivot? • Who will build and maintain the dashboards/datamodels? • How do I construct my search, build my dashboards? • How do they prefer to consume the results? Splunk? PDF? 3rd Party Tool? – Are we using the ODBC driver the right way? – Returning search results vs exporting all data • Who else would like access to these results? CIO? E-staff?
  • 15.
  • 16.
    Anomaly Detection &Clustering •Anomaly Detection is one of Splunk’s most common use cases: – Faster-than-humantransactions – Intrusion & insider threat detection – High-value customer purchase patterns •Lots of solutions forAnomaly Detection: – Clustering: cluster,kmeans,Event Patternstab – AD: anomalies,anomalousvalue,outliers – Alert on rate of statisticaloutliers (eg 5% → 15% triggers alert) – Advanced threat detection (Enterprise Security) •Integrate high-risk anomalies into incident review
  • 17.
    Data Visualization Data Viz:Thecreation and study of the visual representation of data. •After processing, all data must be consumed: – Machines can consume any kind of data – People must visualize or listen to the data •Splunk helps deliver actionable insights: – Out-of-the-boxcharts & tables – Easy-to-customizeD3 visualizations – Drilldown & form inputs enable interactivity Source: Satoshi’s Custom Visualizations app https://splunkbase.splunk.com/app/2717/
  • 18.
    Custom Viz: SankeyChart •Sankey charts illustrate flows through multiple stages – You choose nodes & edges •Lots of use cases: – Customer paths through website – Order tracking through system – Any type of process flows •Drilldown to go further: – Why do these flows yield purchases? – Which edges have high traffic? – Where are the bottlenecks? Nodes = stations. Edges = routes Citibike data from: http://www.citibikenyc.com/system-data
  • 19.
    PredictiveAnalytics Use predict toforecast time series into the future. •Implements a Kalman filter to identify seasonal trends. – Best fit line & uncertainty envelope •Lots of applications: – Forecast revenue & other KPIs – Estimate MTTR & server outages – Dynamic baselining – Capacity planning (AWSApp) – Security threats (Enterprise Security) •Remember: the future is always uncertain…
  • 20.
  • 21.
    Growing beyond IT:Call to action! • CIO and CDO care about Actionable Insights • Build some Executive dashboards • Crossing silos can be tricky • Organization, communication, documentation help immensely!
  • 22.
    Next Steps •Reach outto your localtechnical team! – Your local Sales Engineers are happy to help – Analytics SMEs are available for advanced use cases – Analytics Specialist team is available for escalations •We’ve got you covered. We’re here to help!
  • 23.

Editor's Notes

  • #3 Unlike Security, Analytics is everywhere. Depends on who talking to & what problems they have. Not just Data mash-ups Financial/KPI’s/Metrics Ops Social
  • #5 ODBC DB Connect Modular Inputs Streams MINT
  • #6 Splunk 6 takes large-scale machine data analytics to the next level by introducing three breakthrough innovations: Pivot – opens up the power of Splunk search to non-technical users with an easy-to-use drag and drop interface to explore, manipulate and visualize data Data Model – defines meaningful relationships in underlying machine data and making the data more useful to broader base of non-technical users Analytics Store – patent pending technology that accelerates data models by delivering extremely high performance data retrieval for analytical operations, up to 1000x faster than Splunk 5 Let’s dig into each of these new features in more detail.
  • #7 ODBC DB Connect Talk about Data Sift Modular Input Streams MINT
  • #9 Account Executive App Developer Business Analyst CIO/CISO/CDO Customer Analyst Data Scientist Marketing Analyst Marketing Executive Product Manager Quantitative Analyst Security Analyst Technology Strategist
  • #10 This slide demonstrates the the collaborative nature of Data Science & Analytics teams. There is no “one size fits all” data professional. Data Science and Analytics are cross-functional endeavors, and you need people from lots of different backgrounds. Math & Stats, some Machine Learning & Comp Sci – this person is a good Data Researcher to have onboard. The green one here is stronger in CS & Programming, and is more of a Data Developer. The red one here has a ton of Domain Expertise, Communication and Data Viz skills, and is a great Data Businessperson. Together these three form a really solid Data Science team.
  • #13 Mention Splunk assets DBConnect ODBC
  • #14  (e.g. Add a column, filter a few rows based on field x, compute sum of field volume and split by product)
  • #17  Definition: an anomaly is an event which is vastly dissimilar to other events. Note: “dissimilarity” is in the eye of the beholder. Lots of different similarity metrics. If you spot something which might be an anomaly, probe in deeper. Example: fraudulent transactions. First, we want to identify metrics of interest. Events are high-dimensional data objects, and metrics are one-dimensional projections. It’s not enough to just look at one metric: we need to keep track of multiple metrics simultaneously. For each of these metrics, we want to find those events that are highly dispersive: i.e., very far away from central behavior. Non-average: find those events which fall more than a few standard deviations away from the mean. From the Central Limit Theorem, if we have normally distributed data, we know that 99.7% of the data should fall within three standard deviations. Note: if you have 1000000 transactions, this means that ~3000 transactions are more than three standard deviations away! That’s still a lot, so be careful. Also keep in mind that with financial data, there are lots of heavy-tailed events floating about. For example, my transactions aren’t a uniform process: I mostly make small purchases but occasionally I’ll make a very large purchase. Non-typical: find those events which fall far outside the IQR. Note: by definition, the IQR only captures 50% of the data, so we don’t want to set a trigger for outside-IQR! But we may want 1.5 * IQR, or maybe everything outside of the 90th – 10th percentile. Apply to financial data.
  • #18 Also: feel data with mobile or watch notifications
  • #20 Here’s the predict command in action, applied to Lending Club Denied Loans data. This implements a Kalman filter, which captures the trends and fluctuations of the data, and forecasts them 2 years into the future. Notice something funny with this algorithm: the forecast starts to get periodic. The algorithm can only generalize from what it knows, so you should think of the thick line as a “best guess” given the past data. We actually expect the real trajectory to bounce around this “uncertainty envelope”. Crazy dip in # of denied loans in November 2013 Sourcetype=lending_club_denied_loan | timechart span=7d count | predict count future_timespan=104
  • #22 Shout outs to other talks Splunk for Data Scientists: Tom and Olivier Advanced Use Cases for Analytics: Archana and James
  • #23 Do you want cool analytics insights? How are customers using our product? How do failed or degraded transactions impact customers? How can I gain Operational Visibility into concurrent transactions?