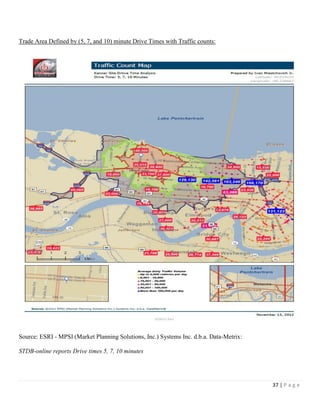
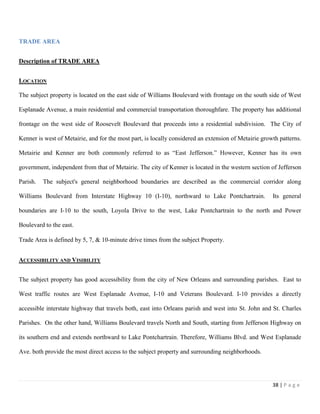
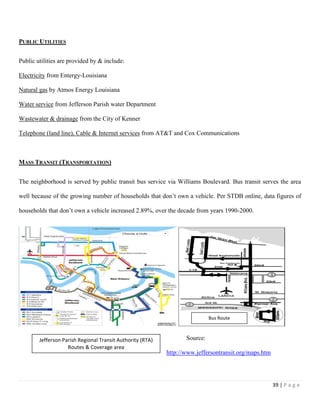
Downloaded 76 times


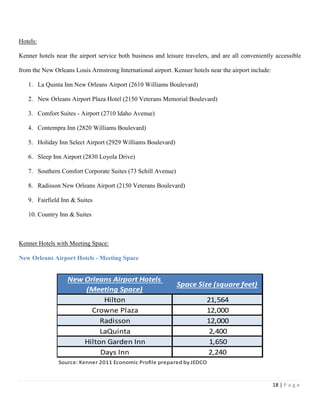


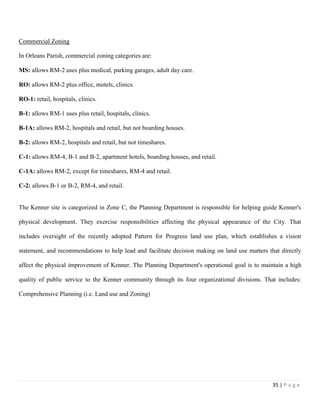


The document provides an overview of the city of Kenner, Louisiana, highlighting its amenities and quality of life. Key points include: - Kenner has a sub-tropical climate with average annual rainfall of 62 inches and temperatures between 77.5°F and 59.8°F. - Cultural and family attractions in Kenner include the River-town Historic District with art galleries, museums, and theaters, as well as the Cannes Brulees Native American Museum. - Recreational amenities include Lake-Town on the shore of Lake Pontchartrain, with parks, trails, and entertainment venues, and Kenner City Park with fountains, ponds, and event spaces.


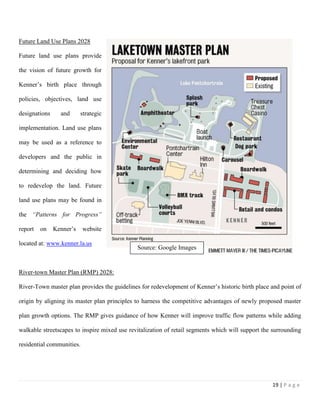
![[ARC 1215] Methods of documentation and Measured Drawings](https://cdn.slidesharecdn.com/ss_thumbnails/angelinekonkeehooi0302068portfolio-arc1215methodsofdocumentationandmeasureddrawings-140920042920-phpapp01-thumbnail.jpg?width=640&height=640&fit=bounds)


