Download to read offline
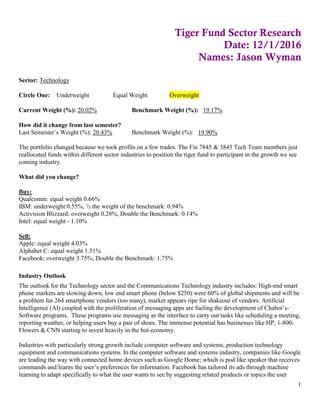
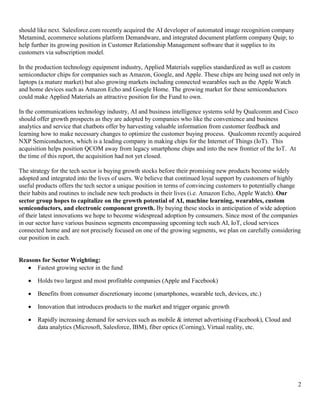
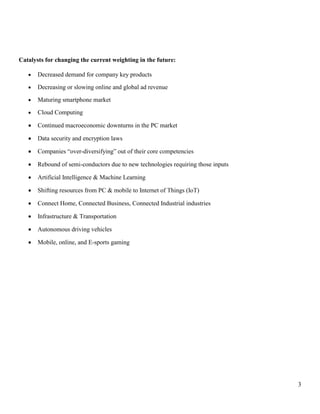
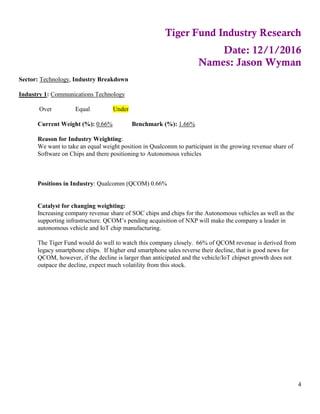
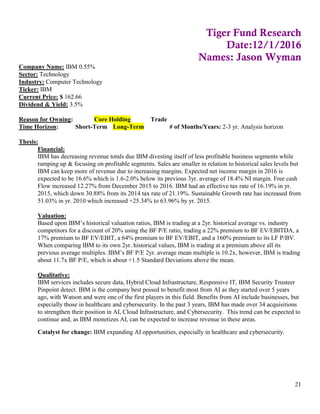

The document provides an analysis of sector and industry weightings for the Tiger Fund technology sector. It recommends an equal weight of 0.66% for Qualcomm in the Communications Technology industry and overweight positions in Microsoft, Facebook, Alphabet, and Salesforce in the Computer Services Software & Systems industry. It recommends an underweight position in the Computer Technology industry to decrease exposure to declining Apple phone sales and take a position in IBM to participate in its artificial intelligence initiatives. Catalysts that could trigger changes in weightings include company growth rates, smartphone market trends, and shifts in technology.


![E160404_RobotBiweekly[1]](https://cdn.slidesharecdn.com/ss_thumbnails/780aef08-dc8b-4485-bf63-a79fdc966a3d-160419003724-thumbnail.jpg?width=640&height=640&fit=bounds)


