SlideShare a Scribd company logo
1 of 13
Download to read offline
AgriMetSoft
http://www.youtube.com/AgriMetSoft
DMAP V2.0
The initial stage of the DMAP process involves "Input Data." During this step, you
are presented with two alternatives:
1- Importing data through Excel files.
You can bring in your data using an Excel file by utilizing the initial tab
(Fig1). Within this tab, there are two tasks you need to complete:
Fig1 – Input Data as Excel Files
AgriMetSoft
http://www.youtube.com/AgriMetSoft
1-1. Input List of Stations
To populate the station list, you have the option to either manually
enter the information directly into the table or import the list from an
Excel, CSV, or text file. Initially, you'll need to specify the delimiter. If
you're working with a CSV or text file, specifying the delimiter is
necessary, but if you're using an Excel file, you can skip this step. Next,
proceed to click on the "Fill List by File" button. Next, proceed to choose
the file you intend to use, which will prompt a window to appear. Within
this window, you will need to identify the appropriate sheet if your file is
in Excel format. Use the provided combo boxes to select and allocate
column headers. It's essential to select at least the following headers:
Station Name, Latitude, and Longitude. Other headers pertain to the
specific index.
Should you wish to compute KBDI (Keetch-Byram Drought Index), it's
necessary to designate and input the FC (Field Capacity) values.
For those seeking to calculate PDSI (Palmer Drought Severity Index), you
will need to input SS, which signifies the available water capacity of the
AgriMetSoft
http://www.youtube.com/AgriMetSoft
surface layer for each site (typically in mm, often around 25mm), and
AWC, indicating the available water capacity of the underlying layer for
each site (in mm).
There is a small converter if you want to convert the latitude and
longitude from UTM system.
It's important to be aware that in Excel, the typical practice involves
clearing the cell contents rather than deleting entire cells. For instance,
if you have a dataset with 10 rows of data, followed by 6 rows with
empty cells, Excel will interpret this as having missing data in those 6
rows. This could potentially trigger an error within the tool,
necessitating the removal of the empty rows as a corrective measure.
AgriMetSoft
http://www.youtube.com/AgriMetSoft
Fig2 – List of Stations
1-2. Input Data (time series)
Within the initial tab of the main window, the station list will be
populated. On the right-hand side, you'll find seven tabs that allow
you to input various time series corresponding to your required
indices. Choose the tab that aligns with the specific variable you
require. As you input each variable, one or multiple indices will
become computable:
o Rainfall --> SPI, CZI, ZSI, EDI (if your data is daily), PN, DI, RAI, MCZI
AgriMetSoft
http://www.youtube.com/AgriMetSoft
o Rainfall and Tave --> PDSI, PHDI, SPEI by T (culate PET by Tave)
o Rainfall and Tmax --> KBDI. Your data (Rainfall, Tmax) should be in
daily
o Rainfall and PET --> SPEI, PHDI, RDI, ARI, PDSI1
o PET and AET --> ETDI
o Soil Moisture --> SMDI
o Stream Flow --> SWSI, SDI
Fig3 – Input Data
Within each tab, proceed to pick your files and the corresponding
sheet (similar to Fig3). If the station names match the headers in the
AgriMetSoft
http://www.youtube.com/AgriMetSoft
first rows, you can utilize the "Auto-Fill Col-Head" feature to
automatically select column headers. However, if the station names
differ, you will need to manually select the appropriate headers.
You should choose the time scale that corresponds to the time scale
of your data. For instance, if you opt for a daily time scale for
monthly data, you will encounter an error.
Please ensure that you choose the appropriate date format. The
recommended format is YYYY. It's important to note that if you are
using the Excel date format, which is in the "mm/dd/YYYY hh:mm:ss"
format, the tool does not support it. You can easily convert it by
using the YEAR function in Excel. For a visual guide on this process,
you can refer to this instructional video.
Depending on the variables you input, the drought index will become
operational.
2. Importing Data via the NetCDF data format.
Here you can input your data using the NetCDF file format. In the second
tab, begin by selecting your files by clicking the designated button. If
AgriMetSoft
http://www.youtube.com/AgriMetSoft
you've already entered a list of stations in the first tab, you can utilize
this option (Use List of Stations fig 4) to extract data based on that list of
stations.
Fig4 – Input Data by NetCDF Files
Once you've chosen your files, the tool will automatically identify the
specifications of the NetCDF files, including variable names and the time
unit. It's important to review this information. If the tool doesn't
accurately identify the specifications or if they are missing, you can utilize
AgriMetSoft
http://www.youtube.com/AgriMetSoft
the "View Database" button to inspect the file's contents. This will help
you identify the names of latitude/longitude variables and other relevant
items and enter them correctly.
In the Loading section, you have the option to select either a shapefile, a
rectangular region, or a list of stations for extraction. When should you
use the list of stations?
You should use the list of stations when:
✓ You have previously entered a list of stations in the first tab.
✓ You have extracted NetCDF data using a shapefile.
✓ You have extracted NetCDF data using a rectangular region.
When working with the CORDEX dataset, it's advisable to mark the "Is
CORDEX Data" checkbox.
Ensure that you populate the variable name textbox; failure to do so
results in errors with the tool.
If you wish to monitor the extraction progress, you can enable the "Use
Progress Bar" checkbox. However, if you're dealing with a substantial
amount of data, we recommend unchecking it to expedite the extraction
process.
AgriMetSoft
http://www.youtube.com/AgriMetSoft
In the Unit Converter section, you must first identify the variable you've
extracted. Additionally, you can choose from various options to convert
the units of your data.
For instance, in the CMIP5&6 dataset, the precipitation variable 'pr' is
originally in units of Flux and should be converted to mm/day. Similarly,
in the CMIP5&6 dataset, the temperature is initially in Kelvin and should
be converted to degrees Celsius. Please be aware that a multiplication
factor of 1 or a plus/minus 0 signifies no conversion.
AgriMetSoft
http://www.youtube.com/AgriMetSoft
Fig5 - Extract NetCDF Data
3- Calculation Drought Index
After inputting your data, certain indices will become active depending
on the variables you provide (refer to point 1.2). Additionally, you have
the option to create a new station called "Average" by averaging the
data from your existing stations. The "moving average" feature will be
available when working with monthly frequencies in SPI, CZI, CZI, and
ZSI.
On the right-hand side, you'll find a severity calculation section. It's
important to note that severity varies depending on the specific index
you're working with. For instance, different indices have distinct criteria
for identifying drought conditions. For example, some papers define
drought conditions as SPI values less than -0.99, while in KBDI, a drought
condition is indicated by values exceeding 200.
As a result, you'll need to conduct research on the specific index you're
using to determine the appropriate threshold values and direction
(whether it's "more than" or "less than") for calculating severity.
AgriMetSoft
http://www.youtube.com/AgriMetSoft
In DMAP, you have the flexibility to input these threshold values and
select the appropriate sign (either "more than" or "less than") to tailor
the severity calculation according to the requirements of your chosen
index.
Additionally, you can generate various plots to monitor results for
individual stations or across all stations. These plots include Linear plots,
Column plots, and Box plots.
Furthermore, certain indices involve the calculation of Potential
Evapotranspiration (PET) as part of the process such as "SPEI bt T". You
can conveniently export all the variables by clicking the "Export" button
located in the top bar.
When calculating the Reference Drought Index (RDI), you have the
option to select a "standardized" checkbox if needed.
AgriMetSoft
http://www.youtube.com/AgriMetSoft
Fig6 – Drought Index
After clicking the "Severity" button, a window will appear displaying a
table containing the start dateof thedrought, the duration of thedrought
in days, and the magnitude of the drought. The unit of magnitude
matches the unit of your selected index. You can export both the table
data and the data used to generate the chart to Excel for further analysis.
AgriMetSoft
http://www.youtube.com/AgriMetSoft
Fig7 – Drought Severity

More Related Content

Similar to DMAP Tutorial

Massmaintenance
MassmaintenanceMassmaintenance
MassmaintenanceDavid Chan
 
John Warner MeasureFest 2018
John Warner MeasureFest 2018John Warner MeasureFest 2018
John Warner MeasureFest 2018John Warner
 
Stop Wasting Time! 5 Steps to Automate Your Google Analytics Reporting
Stop Wasting Time! 5 Steps to Automate Your Google Analytics ReportingStop Wasting Time! 5 Steps to Automate Your Google Analytics Reporting
Stop Wasting Time! 5 Steps to Automate Your Google Analytics ReportingClick Consult (Part of Ceuta Group)
 
Step by step lsmw tutorial
Step by step lsmw tutorialStep by step lsmw tutorial
Step by step lsmw tutorialraonivaz
 
Lesson 18 Creating Pivot Tables
Lesson 18 Creating Pivot TablesLesson 18 Creating Pivot Tables
Lesson 18 Creating Pivot Tablesguevarra_2000
 
Temp Proc - Operations Reporting
Temp Proc - Operations ReportingTemp Proc - Operations Reporting
Temp Proc - Operations ReportingPaul Rouse
 
Nextera Energy Job Aid
Nextera Energy Job AidNextera Energy Job Aid
Nextera Energy Job AidKara Hodges
 
Tableau Basic Questions
Tableau Basic QuestionsTableau Basic Questions
Tableau Basic QuestionsSooraj Vinodan
 
Week 2 Project - STAT 3001Student Name Type your name here.docx
Week 2 Project - STAT 3001Student Name Type your name here.docxWeek 2 Project - STAT 3001Student Name Type your name here.docx
Week 2 Project - STAT 3001Student Name Type your name here.docxcockekeshia
 
IFSM 201 Possible Is Everything/newtonhelp.com
IFSM 201 Possible Is Everything/newtonhelp.comIFSM 201 Possible Is Everything/newtonhelp.com
IFSM 201 Possible Is Everything/newtonhelp.comlechenau70
 
IFSM 201 Learn/newtonhelp.com
IFSM 201 Learn/newtonhelp.comIFSM 201 Learn/newtonhelp.com
IFSM 201 Learn/newtonhelp.comlechenau47
 
Scoring documentation
Scoring documentationScoring documentation
Scoring documentationFatima Khalid
 
Utilização do SGeMS
Utilização do SGeMSUtilização do SGeMS
Utilização do SGeMSAlex Ramires
 
How To Automate Part 3
How To Automate Part 3How To Automate Part 3
How To Automate Part 3Sean Durocher
 
Calculation contex in sap business objects
Calculation contex in sap business objectsCalculation contex in sap business objects
Calculation contex in sap business objectsDmitry Anoshin
 

Similar to DMAP Tutorial (20)

Massmaintenance
MassmaintenanceMassmaintenance
Massmaintenance
 
John Warner MeasureFest 2018
John Warner MeasureFest 2018John Warner MeasureFest 2018
John Warner MeasureFest 2018
 
Stop Wasting Time! 5 Steps to Automate Your Google Analytics Reporting
Stop Wasting Time! 5 Steps to Automate Your Google Analytics ReportingStop Wasting Time! 5 Steps to Automate Your Google Analytics Reporting
Stop Wasting Time! 5 Steps to Automate Your Google Analytics Reporting
 
Step by step lsmw tutorial
Step by step lsmw tutorialStep by step lsmw tutorial
Step by step lsmw tutorial
 
Lesson 18 Creating Pivot Tables
Lesson 18 Creating Pivot TablesLesson 18 Creating Pivot Tables
Lesson 18 Creating Pivot Tables
 
Temp Proc - Operations Reporting
Temp Proc - Operations ReportingTemp Proc - Operations Reporting
Temp Proc - Operations Reporting
 
Help of knn wg
Help of knn wgHelp of knn wg
Help of knn wg
 
Nextera Energy Job Aid
Nextera Energy Job AidNextera Energy Job Aid
Nextera Energy Job Aid
 
Tableau Basic Questions
Tableau Basic QuestionsTableau Basic Questions
Tableau Basic Questions
 
Week 2 Project - STAT 3001Student Name Type your name here.docx
Week 2 Project - STAT 3001Student Name Type your name here.docxWeek 2 Project - STAT 3001Student Name Type your name here.docx
Week 2 Project - STAT 3001Student Name Type your name here.docx
 
IFSM 201 Possible Is Everything/newtonhelp.com
IFSM 201 Possible Is Everything/newtonhelp.comIFSM 201 Possible Is Everything/newtonhelp.com
IFSM 201 Possible Is Everything/newtonhelp.com
 
IFSM 201 Learn/newtonhelp.com
IFSM 201 Learn/newtonhelp.comIFSM 201 Learn/newtonhelp.com
IFSM 201 Learn/newtonhelp.com
 
Readme-GPS Data Conversion for GIS Unit
Readme-GPS Data Conversion for GIS UnitReadme-GPS Data Conversion for GIS Unit
Readme-GPS Data Conversion for GIS Unit
 
Scoring documentation
Scoring documentationScoring documentation
Scoring documentation
 
Utilização do SGeMS
Utilização do SGeMSUtilização do SGeMS
Utilização do SGeMS
 
Cygnus v3.2.0 webinar
Cygnus v3.2.0 webinarCygnus v3.2.0 webinar
Cygnus v3.2.0 webinar
 
How To Automate Part 3
How To Automate Part 3How To Automate Part 3
How To Automate Part 3
 
Calculation contex in sap business objects
Calculation contex in sap business objectsCalculation contex in sap business objects
Calculation contex in sap business objects
 
Report designer
Report designerReport designer
Report designer
 
Manual Entry Module (Manual Data Logger)
Manual Entry Module (Manual Data Logger)Manual Entry Module (Manual Data Logger)
Manual Entry Module (Manual Data Logger)
 

More from Sohrab Kolsoumi

Modis Product Extractor Turorial
Modis Product Extractor TurorialModis Product Extractor Turorial
Modis Product Extractor TurorialSohrab Kolsoumi
 
Help of drought monitoring and prediction
Help of drought monitoring and predictionHelp of drought monitoring and prediction
Help of drought monitoring and predictionSohrab Kolsoumi
 
Help drought indices tool
Help drought indices toolHelp drought indices tool
Help drought indices toolSohrab Kolsoumi
 
Help of meteorological drought monitoring
Help of meteorological drought monitoringHelp of meteorological drought monitoring
Help of meteorological drought monitoringSohrab Kolsoumi
 
Help of netcdf extractor
Help of netcdf extractorHelp of netcdf extractor
Help of netcdf extractorSohrab Kolsoumi
 
Help of API of netcdf extractor V2.1
Help of API of netcdf extractor V2.1Help of API of netcdf extractor V2.1
Help of API of netcdf extractor V2.1Sohrab Kolsoumi
 

More from Sohrab Kolsoumi (11)

SD-GCM Formulas
SD-GCM FormulasSD-GCM Formulas
SD-GCM Formulas
 
Modis Product Extractor Turorial
Modis Product Extractor TurorialModis Product Extractor Turorial
Modis Product Extractor Turorial
 
DMAP Formulas
DMAP FormulasDMAP Formulas
DMAP Formulas
 
Open NC File Formulas
Open NC File FormulasOpen NC File Formulas
Open NC File Formulas
 
Kbdi help
Kbdi helpKbdi help
Kbdi help
 
Help of drought monitoring and prediction
Help of drought monitoring and predictionHelp of drought monitoring and prediction
Help of drought monitoring and prediction
 
Help drought indices tool
Help drought indices toolHelp drought indices tool
Help drought indices tool
 
What is cru
What is cruWhat is cru
What is cru
 
Help of meteorological drought monitoring
Help of meteorological drought monitoringHelp of meteorological drought monitoring
Help of meteorological drought monitoring
 
Help of netcdf extractor
Help of netcdf extractorHelp of netcdf extractor
Help of netcdf extractor
 
Help of API of netcdf extractor V2.1
Help of API of netcdf extractor V2.1Help of API of netcdf extractor V2.1
Help of API of netcdf extractor V2.1
 

Recently uploaded

Pharmacognosy Flower 3. Compositae 2023.pdf
Pharmacognosy Flower 3. Compositae 2023.pdfPharmacognosy Flower 3. Compositae 2023.pdf
Pharmacognosy Flower 3. Compositae 2023.pdfMahmoud M. Sallam
 
Painted Grey Ware.pptx, PGW Culture of India
Painted Grey Ware.pptx, PGW Culture of IndiaPainted Grey Ware.pptx, PGW Culture of India
Painted Grey Ware.pptx, PGW Culture of IndiaVirag Sontakke
 
भारत-रोम व्यापार.pptx, Indo-Roman Trade,
भारत-रोम व्यापार.pptx, Indo-Roman Trade,भारत-रोम व्यापार.pptx, Indo-Roman Trade,
भारत-रोम व्यापार.pptx, Indo-Roman Trade,Virag Sontakke
 
Incoming and Outgoing Shipments in 1 STEP Using Odoo 17
Incoming and Outgoing Shipments in 1 STEP Using Odoo 17Incoming and Outgoing Shipments in 1 STEP Using Odoo 17
Incoming and Outgoing Shipments in 1 STEP Using Odoo 17Celine George
 
Kisan Call Centre - To harness potential of ICT in Agriculture by answer farm...
Kisan Call Centre - To harness potential of ICT in Agriculture by answer farm...Kisan Call Centre - To harness potential of ICT in Agriculture by answer farm...
Kisan Call Centre - To harness potential of ICT in Agriculture by answer farm...Krashi Coaching
 
POINT- BIOCHEMISTRY SEM 2 ENZYMES UNIT 5.pptx
POINT- BIOCHEMISTRY SEM 2 ENZYMES UNIT 5.pptxPOINT- BIOCHEMISTRY SEM 2 ENZYMES UNIT 5.pptx
POINT- BIOCHEMISTRY SEM 2 ENZYMES UNIT 5.pptxSayali Powar
 
Computed Fields and api Depends in the Odoo 17
Computed Fields and api Depends in the Odoo 17Computed Fields and api Depends in the Odoo 17
Computed Fields and api Depends in the Odoo 17Celine George
 
Introduction to ArtificiaI Intelligence in Higher Education
Introduction to ArtificiaI Intelligence in Higher EducationIntroduction to ArtificiaI Intelligence in Higher Education
Introduction to ArtificiaI Intelligence in Higher Educationpboyjonauth
 
ENGLISH5 QUARTER4 MODULE1 WEEK1-3 How Visual and Multimedia Elements.pptx
ENGLISH5 QUARTER4 MODULE1 WEEK1-3 How Visual and Multimedia Elements.pptxENGLISH5 QUARTER4 MODULE1 WEEK1-3 How Visual and Multimedia Elements.pptx
ENGLISH5 QUARTER4 MODULE1 WEEK1-3 How Visual and Multimedia Elements.pptxAnaBeatriceAblay2
 
How to Make a Pirate ship Primary Education.pptx
How to Make a Pirate ship Primary Education.pptxHow to Make a Pirate ship Primary Education.pptx
How to Make a Pirate ship Primary Education.pptxmanuelaromero2013
 
Mastering the Unannounced Regulatory Inspection
Mastering the Unannounced Regulatory InspectionMastering the Unannounced Regulatory Inspection
Mastering the Unannounced Regulatory InspectionSafetyChain Software
 
Proudly South Africa powerpoint Thorisha.pptx
Proudly South Africa powerpoint Thorisha.pptxProudly South Africa powerpoint Thorisha.pptx
Proudly South Africa powerpoint Thorisha.pptxthorishapillay1
 
Introduction to AI in Higher Education_draft.pptx
Introduction to AI in Higher Education_draft.pptxIntroduction to AI in Higher Education_draft.pptx
Introduction to AI in Higher Education_draft.pptxpboyjonauth
 
How to Configure Email Server in Odoo 17
How to Configure Email Server in Odoo 17How to Configure Email Server in Odoo 17
How to Configure Email Server in Odoo 17Celine George
 
Organic Name Reactions for the students and aspirants of Chemistry12th.pptx
Organic Name Reactions  for the students and aspirants of Chemistry12th.pptxOrganic Name Reactions  for the students and aspirants of Chemistry12th.pptx
Organic Name Reactions for the students and aspirants of Chemistry12th.pptxVS Mahajan Coaching Centre
 
Final demo Grade 9 for demo Plan dessert.pptx
Final demo Grade 9 for demo Plan dessert.pptxFinal demo Grade 9 for demo Plan dessert.pptx
Final demo Grade 9 for demo Plan dessert.pptxAvyJaneVismanos
 
ECONOMIC CONTEXT - LONG FORM TV DRAMA - PPT
ECONOMIC CONTEXT - LONG FORM TV DRAMA - PPTECONOMIC CONTEXT - LONG FORM TV DRAMA - PPT
ECONOMIC CONTEXT - LONG FORM TV DRAMA - PPTiammrhaywood
 
Science lesson Moon for 4th quarter lesson
Science lesson Moon for 4th quarter lessonScience lesson Moon for 4th quarter lesson
Science lesson Moon for 4th quarter lessonJericReyAuditor
 

Recently uploaded (20)

Pharmacognosy Flower 3. Compositae 2023.pdf
Pharmacognosy Flower 3. Compositae 2023.pdfPharmacognosy Flower 3. Compositae 2023.pdf
Pharmacognosy Flower 3. Compositae 2023.pdf
 
9953330565 Low Rate Call Girls In Rohini Delhi NCR
9953330565 Low Rate Call Girls In Rohini  Delhi NCR9953330565 Low Rate Call Girls In Rohini  Delhi NCR
9953330565 Low Rate Call Girls In Rohini Delhi NCR
 
Painted Grey Ware.pptx, PGW Culture of India
Painted Grey Ware.pptx, PGW Culture of IndiaPainted Grey Ware.pptx, PGW Culture of India
Painted Grey Ware.pptx, PGW Culture of India
 
भारत-रोम व्यापार.pptx, Indo-Roman Trade,
भारत-रोम व्यापार.pptx, Indo-Roman Trade,भारत-रोम व्यापार.pptx, Indo-Roman Trade,
भारत-रोम व्यापार.pptx, Indo-Roman Trade,
 
Incoming and Outgoing Shipments in 1 STEP Using Odoo 17
Incoming and Outgoing Shipments in 1 STEP Using Odoo 17Incoming and Outgoing Shipments in 1 STEP Using Odoo 17
Incoming and Outgoing Shipments in 1 STEP Using Odoo 17
 
Kisan Call Centre - To harness potential of ICT in Agriculture by answer farm...
Kisan Call Centre - To harness potential of ICT in Agriculture by answer farm...Kisan Call Centre - To harness potential of ICT in Agriculture by answer farm...
Kisan Call Centre - To harness potential of ICT in Agriculture by answer farm...
 
POINT- BIOCHEMISTRY SEM 2 ENZYMES UNIT 5.pptx
POINT- BIOCHEMISTRY SEM 2 ENZYMES UNIT 5.pptxPOINT- BIOCHEMISTRY SEM 2 ENZYMES UNIT 5.pptx
POINT- BIOCHEMISTRY SEM 2 ENZYMES UNIT 5.pptx
 
Computed Fields and api Depends in the Odoo 17
Computed Fields and api Depends in the Odoo 17Computed Fields and api Depends in the Odoo 17
Computed Fields and api Depends in the Odoo 17
 
Introduction to ArtificiaI Intelligence in Higher Education
Introduction to ArtificiaI Intelligence in Higher EducationIntroduction to ArtificiaI Intelligence in Higher Education
Introduction to ArtificiaI Intelligence in Higher Education
 
ENGLISH5 QUARTER4 MODULE1 WEEK1-3 How Visual and Multimedia Elements.pptx
ENGLISH5 QUARTER4 MODULE1 WEEK1-3 How Visual and Multimedia Elements.pptxENGLISH5 QUARTER4 MODULE1 WEEK1-3 How Visual and Multimedia Elements.pptx
ENGLISH5 QUARTER4 MODULE1 WEEK1-3 How Visual and Multimedia Elements.pptx
 
How to Make a Pirate ship Primary Education.pptx
How to Make a Pirate ship Primary Education.pptxHow to Make a Pirate ship Primary Education.pptx
How to Make a Pirate ship Primary Education.pptx
 
Mastering the Unannounced Regulatory Inspection
Mastering the Unannounced Regulatory InspectionMastering the Unannounced Regulatory Inspection
Mastering the Unannounced Regulatory Inspection
 
TataKelola dan KamSiber Kecerdasan Buatan v022.pdf
TataKelola dan KamSiber Kecerdasan Buatan v022.pdfTataKelola dan KamSiber Kecerdasan Buatan v022.pdf
TataKelola dan KamSiber Kecerdasan Buatan v022.pdf
 
Proudly South Africa powerpoint Thorisha.pptx
Proudly South Africa powerpoint Thorisha.pptxProudly South Africa powerpoint Thorisha.pptx
Proudly South Africa powerpoint Thorisha.pptx
 
Introduction to AI in Higher Education_draft.pptx
Introduction to AI in Higher Education_draft.pptxIntroduction to AI in Higher Education_draft.pptx
Introduction to AI in Higher Education_draft.pptx
 
How to Configure Email Server in Odoo 17
How to Configure Email Server in Odoo 17How to Configure Email Server in Odoo 17
How to Configure Email Server in Odoo 17
 
Organic Name Reactions for the students and aspirants of Chemistry12th.pptx
Organic Name Reactions  for the students and aspirants of Chemistry12th.pptxOrganic Name Reactions  for the students and aspirants of Chemistry12th.pptx
Organic Name Reactions for the students and aspirants of Chemistry12th.pptx
 
Final demo Grade 9 for demo Plan dessert.pptx
Final demo Grade 9 for demo Plan dessert.pptxFinal demo Grade 9 for demo Plan dessert.pptx
Final demo Grade 9 for demo Plan dessert.pptx
 
ECONOMIC CONTEXT - LONG FORM TV DRAMA - PPT
ECONOMIC CONTEXT - LONG FORM TV DRAMA - PPTECONOMIC CONTEXT - LONG FORM TV DRAMA - PPT
ECONOMIC CONTEXT - LONG FORM TV DRAMA - PPT
 
Science lesson Moon for 4th quarter lesson
Science lesson Moon for 4th quarter lessonScience lesson Moon for 4th quarter lesson
Science lesson Moon for 4th quarter lesson
 

DMAP Tutorial

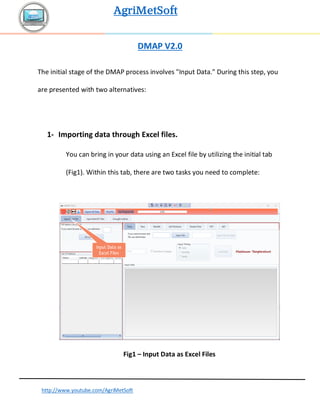
  • 1. AgriMetSoft http://www.youtube.com/AgriMetSoft DMAP V2.0 The initial stage of the DMAP process involves "Input Data." During this step, you are presented with two alternatives: 1- Importing data through Excel files. You can bring in your data using an Excel file by utilizing the initial tab (Fig1). Within this tab, there are two tasks you need to complete: Fig1 – Input Data as Excel Files
  • 2. AgriMetSoft http://www.youtube.com/AgriMetSoft 1-1. Input List of Stations To populate the station list, you have the option to either manually enter the information directly into the table or import the list from an Excel, CSV, or text file. Initially, you'll need to specify the delimiter. If you're working with a CSV or text file, specifying the delimiter is necessary, but if you're using an Excel file, you can skip this step. Next, proceed to click on the "Fill List by File" button. Next, proceed to choose the file you intend to use, which will prompt a window to appear. Within this window, you will need to identify the appropriate sheet if your file is in Excel format. Use the provided combo boxes to select and allocate column headers. It's essential to select at least the following headers: Station Name, Latitude, and Longitude. Other headers pertain to the specific index. Should you wish to compute KBDI (Keetch-Byram Drought Index), it's necessary to designate and input the FC (Field Capacity) values. For those seeking to calculate PDSI (Palmer Drought Severity Index), you will need to input SS, which signifies the available water capacity of the
  • 3. AgriMetSoft http://www.youtube.com/AgriMetSoft surface layer for each site (typically in mm, often around 25mm), and AWC, indicating the available water capacity of the underlying layer for each site (in mm). There is a small converter if you want to convert the latitude and longitude from UTM system. It's important to be aware that in Excel, the typical practice involves clearing the cell contents rather than deleting entire cells. For instance, if you have a dataset with 10 rows of data, followed by 6 rows with empty cells, Excel will interpret this as having missing data in those 6 rows. This could potentially trigger an error within the tool, necessitating the removal of the empty rows as a corrective measure.
  • 4. AgriMetSoft http://www.youtube.com/AgriMetSoft Fig2 – List of Stations 1-2. Input Data (time series) Within the initial tab of the main window, the station list will be populated. On the right-hand side, you'll find seven tabs that allow you to input various time series corresponding to your required indices. Choose the tab that aligns with the specific variable you require. As you input each variable, one or multiple indices will become computable: o Rainfall --> SPI, CZI, ZSI, EDI (if your data is daily), PN, DI, RAI, MCZI
  • 5. AgriMetSoft http://www.youtube.com/AgriMetSoft o Rainfall and Tave --> PDSI, PHDI, SPEI by T (culate PET by Tave) o Rainfall and Tmax --> KBDI. Your data (Rainfall, Tmax) should be in daily o Rainfall and PET --> SPEI, PHDI, RDI, ARI, PDSI1 o PET and AET --> ETDI o Soil Moisture --> SMDI o Stream Flow --> SWSI, SDI Fig3 – Input Data Within each tab, proceed to pick your files and the corresponding sheet (similar to Fig3). If the station names match the headers in the
  • 6. AgriMetSoft http://www.youtube.com/AgriMetSoft first rows, you can utilize the "Auto-Fill Col-Head" feature to automatically select column headers. However, if the station names differ, you will need to manually select the appropriate headers. You should choose the time scale that corresponds to the time scale of your data. For instance, if you opt for a daily time scale for monthly data, you will encounter an error. Please ensure that you choose the appropriate date format. The recommended format is YYYY. It's important to note that if you are using the Excel date format, which is in the "mm/dd/YYYY hh:mm:ss" format, the tool does not support it. You can easily convert it by using the YEAR function in Excel. For a visual guide on this process, you can refer to this instructional video. Depending on the variables you input, the drought index will become operational. 2. Importing Data via the NetCDF data format. Here you can input your data using the NetCDF file format. In the second tab, begin by selecting your files by clicking the designated button. If
  • 7. AgriMetSoft http://www.youtube.com/AgriMetSoft you've already entered a list of stations in the first tab, you can utilize this option (Use List of Stations fig 4) to extract data based on that list of stations. Fig4 – Input Data by NetCDF Files Once you've chosen your files, the tool will automatically identify the specifications of the NetCDF files, including variable names and the time unit. It's important to review this information. If the tool doesn't accurately identify the specifications or if they are missing, you can utilize
  • 8. AgriMetSoft http://www.youtube.com/AgriMetSoft the "View Database" button to inspect the file's contents. This will help you identify the names of latitude/longitude variables and other relevant items and enter them correctly. In the Loading section, you have the option to select either a shapefile, a rectangular region, or a list of stations for extraction. When should you use the list of stations? You should use the list of stations when: ✓ You have previously entered a list of stations in the first tab. ✓ You have extracted NetCDF data using a shapefile. ✓ You have extracted NetCDF data using a rectangular region. When working with the CORDEX dataset, it's advisable to mark the "Is CORDEX Data" checkbox. Ensure that you populate the variable name textbox; failure to do so results in errors with the tool. If you wish to monitor the extraction progress, you can enable the "Use Progress Bar" checkbox. However, if you're dealing with a substantial amount of data, we recommend unchecking it to expedite the extraction process.
  • 9. AgriMetSoft http://www.youtube.com/AgriMetSoft In the Unit Converter section, you must first identify the variable you've extracted. Additionally, you can choose from various options to convert the units of your data. For instance, in the CMIP5&6 dataset, the precipitation variable 'pr' is originally in units of Flux and should be converted to mm/day. Similarly, in the CMIP5&6 dataset, the temperature is initially in Kelvin and should be converted to degrees Celsius. Please be aware that a multiplication factor of 1 or a plus/minus 0 signifies no conversion.
  • 10. AgriMetSoft http://www.youtube.com/AgriMetSoft Fig5 - Extract NetCDF Data 3- Calculation Drought Index After inputting your data, certain indices will become active depending on the variables you provide (refer to point 1.2). Additionally, you have the option to create a new station called "Average" by averaging the data from your existing stations. The "moving average" feature will be available when working with monthly frequencies in SPI, CZI, CZI, and ZSI. On the right-hand side, you'll find a severity calculation section. It's important to note that severity varies depending on the specific index you're working with. For instance, different indices have distinct criteria for identifying drought conditions. For example, some papers define drought conditions as SPI values less than -0.99, while in KBDI, a drought condition is indicated by values exceeding 200. As a result, you'll need to conduct research on the specific index you're using to determine the appropriate threshold values and direction (whether it's "more than" or "less than") for calculating severity.
  • 11. AgriMetSoft http://www.youtube.com/AgriMetSoft In DMAP, you have the flexibility to input these threshold values and select the appropriate sign (either "more than" or "less than") to tailor the severity calculation according to the requirements of your chosen index. Additionally, you can generate various plots to monitor results for individual stations or across all stations. These plots include Linear plots, Column plots, and Box plots. Furthermore, certain indices involve the calculation of Potential Evapotranspiration (PET) as part of the process such as "SPEI bt T". You can conveniently export all the variables by clicking the "Export" button located in the top bar. When calculating the Reference Drought Index (RDI), you have the option to select a "standardized" checkbox if needed.
  • 12. AgriMetSoft http://www.youtube.com/AgriMetSoft Fig6 – Drought Index After clicking the "Severity" button, a window will appear displaying a table containing the start dateof thedrought, the duration of thedrought in days, and the magnitude of the drought. The unit of magnitude matches the unit of your selected index. You can export both the table data and the data used to generate the chart to Excel for further analysis.