Download as PDF, PPTX


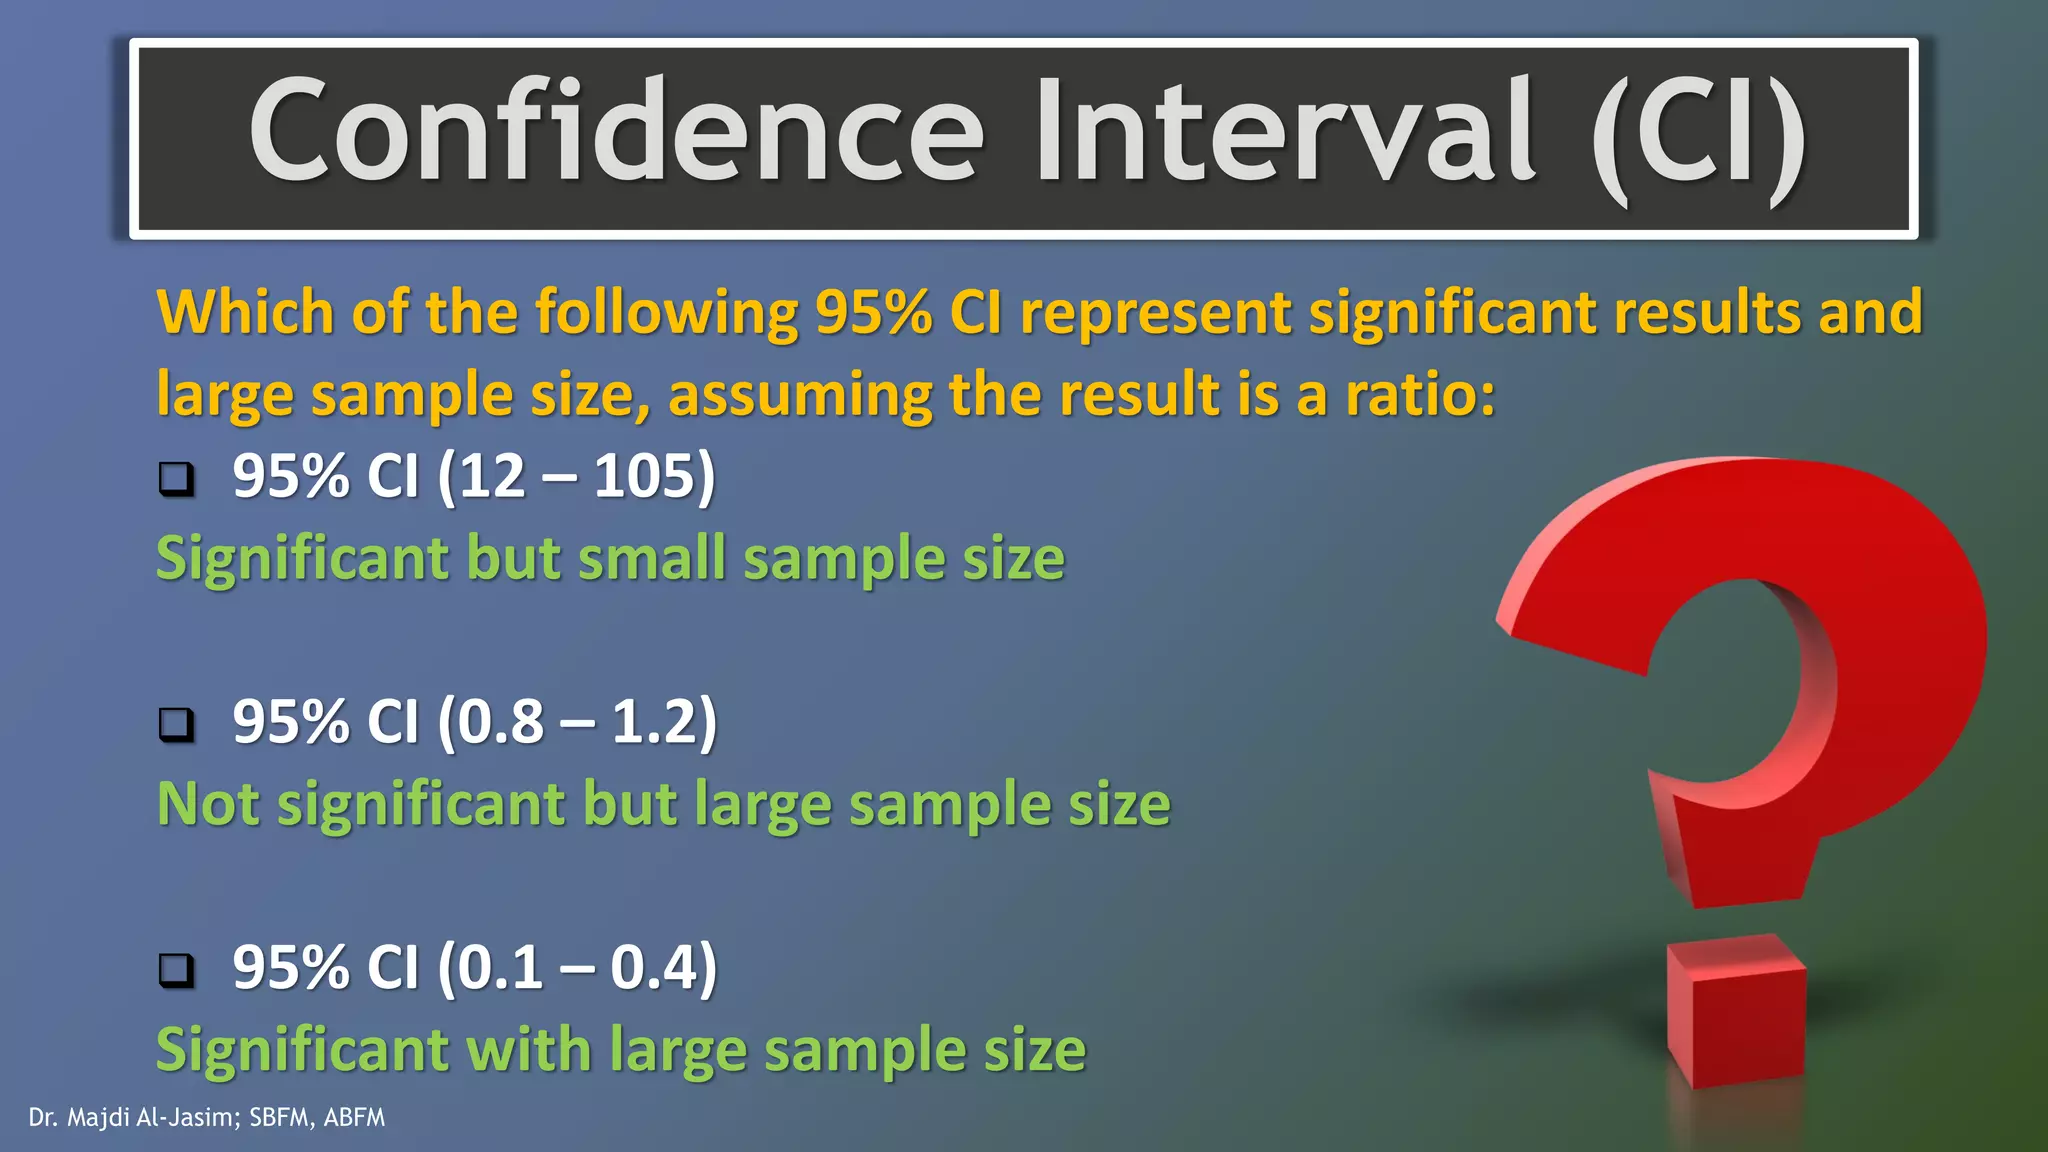


This document discusses various quantitative measures used in therapy articles, including p-value, confidence interval, event rates, relative risk, relative risk reduction, absolute risk reduction, and number needed to treat or harm. It provides examples and formulas for calculating each measure. The document aims to help readers understand how to interpret results reported in therapy studies.