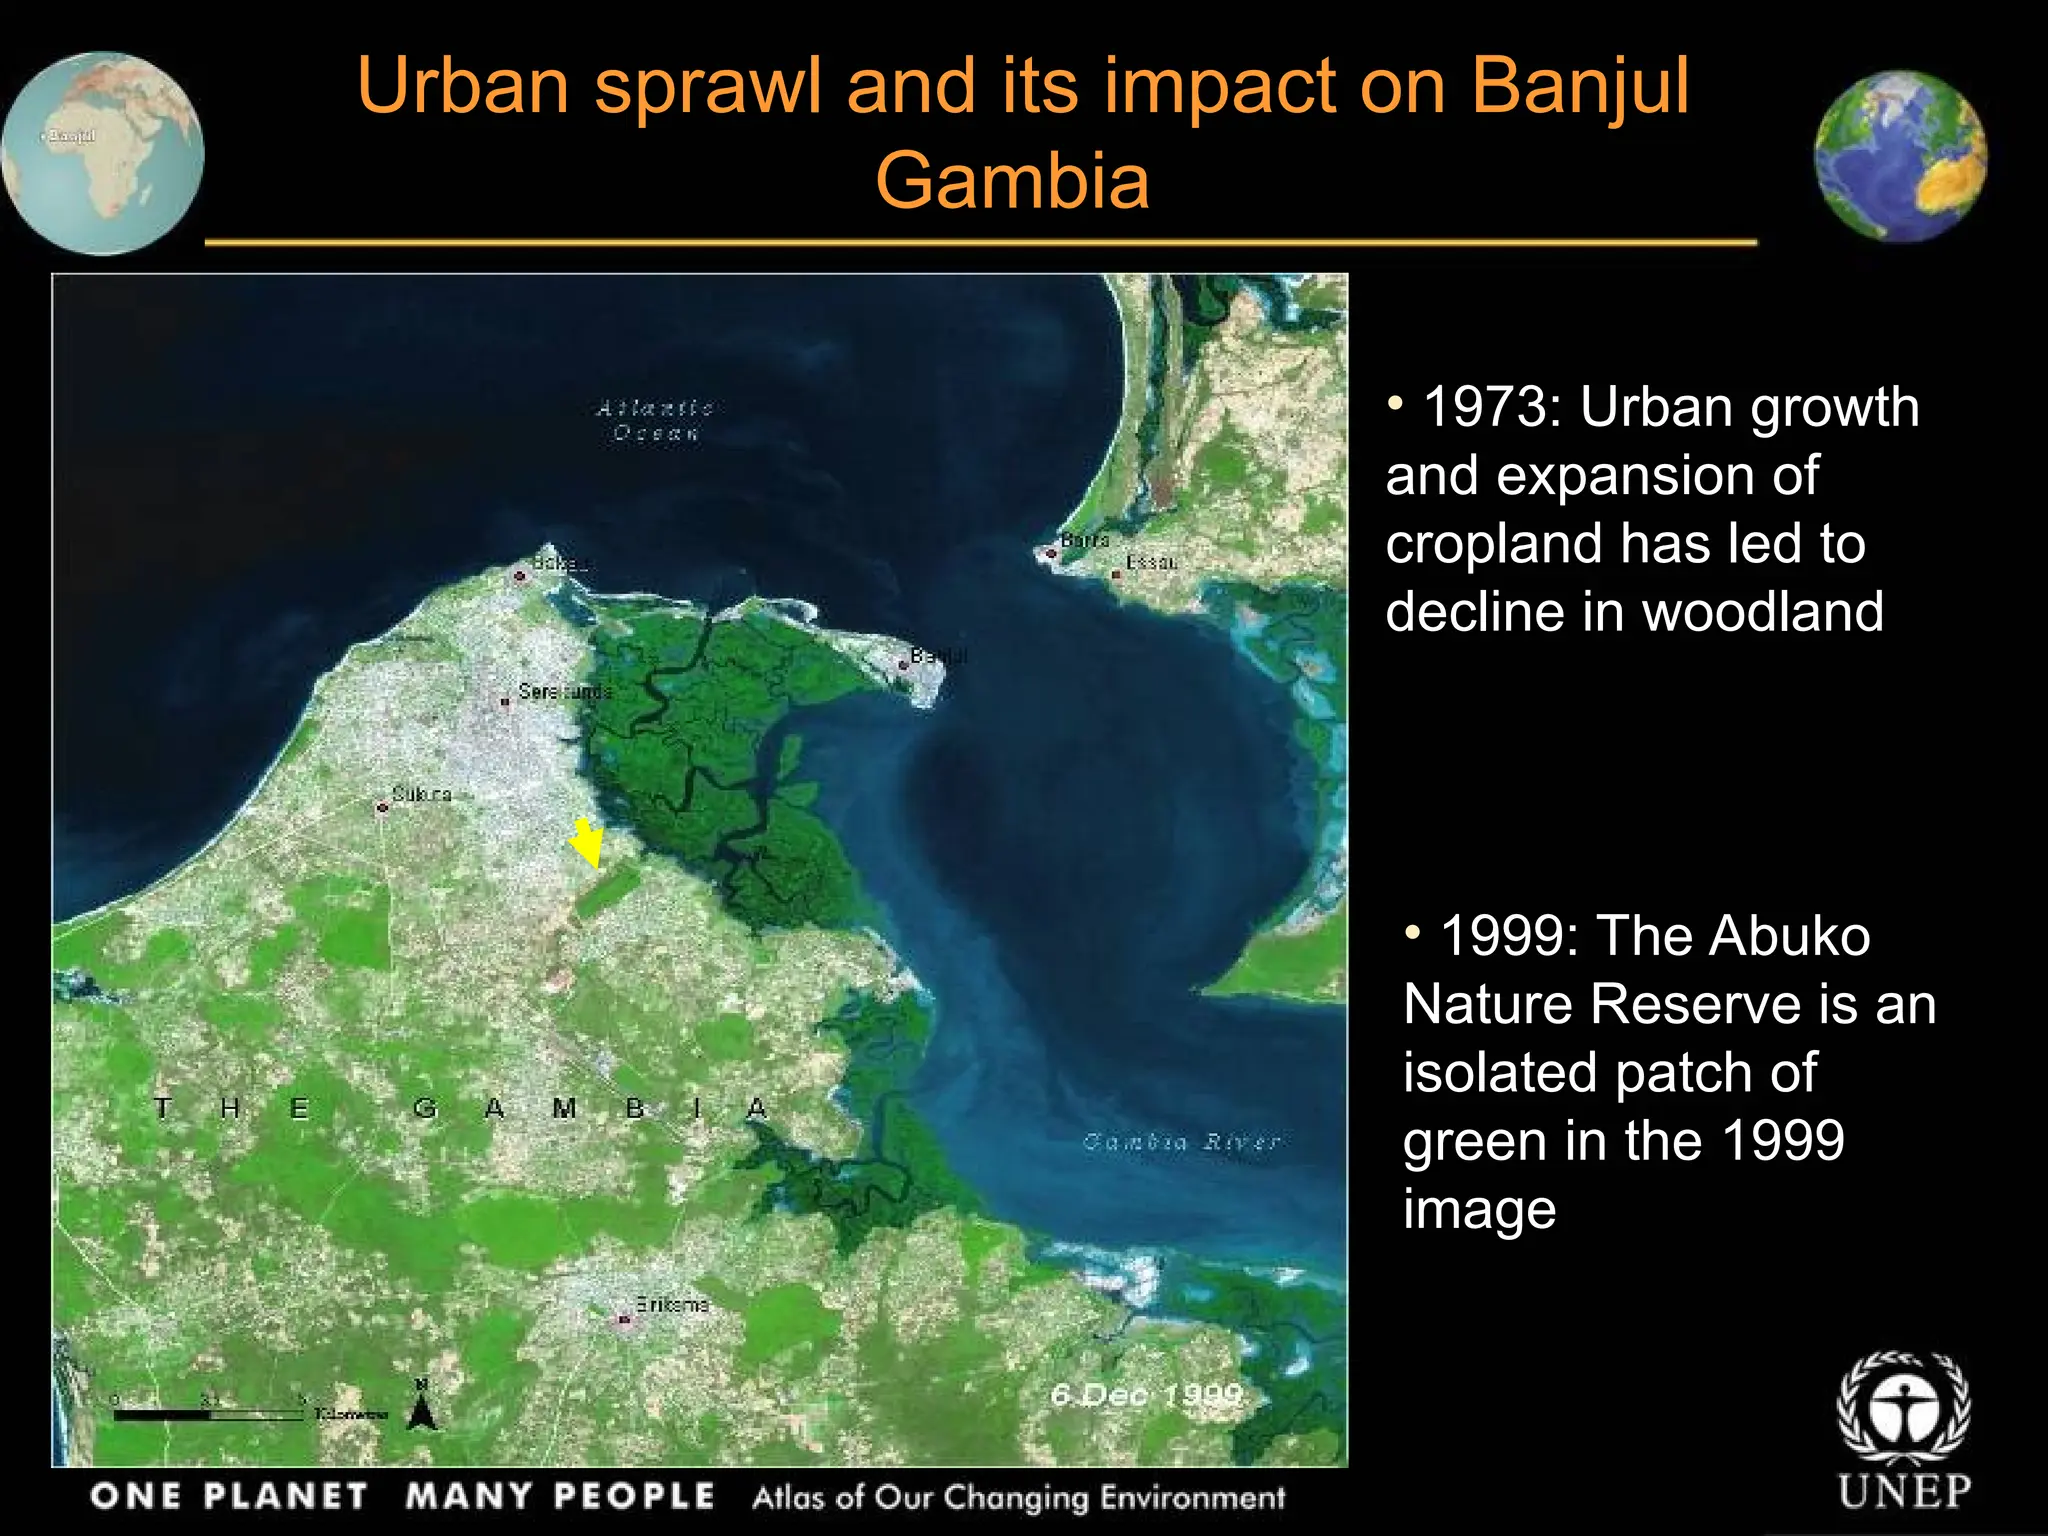
THEMATIC SLIDES
URBAN AREAS
World Population Growth
1750-2150
• About 3 billion people, or 50 per cent of the global population,
already live in urban areas; over the next 25 years, more than 2
billion people are predicted to be added
Source: UN- HABITAT Report 2005; United Nations, World Urbanization Prospects, The 1999 Revision
Growth of Urban Agglomerations 1950-2015
• Paris, France
• Brasilia, Brazil
• Santiago, Chile
• Mexico City, Mexico
• Vancouver, Canada
• Las Vegas, United States
• San Francisco, United States
• Seattle, United States
• Washington D.C., United States
• Banjul, Gambia
• Midrand, South Africa
• Tripoli, Libya
• Beijing, China
• Delhi, India
• Dhaka, Bangladesh
• Karachi, Pakistan
• Sydney, Australia
• London, United Kingdom
• Moskva, Russia
URBAN AREAS
URBAN FACTS
• Roughly 3% of the earth’s land surface is occupied by urban areas,
with the highest concentrations occurring along the coasts and
waterways
Sources: UNEP, WRI, Population Reference Bureau, 2006; UN/ESA,2005
• Of the 10 world's most populous urban agglomerations, 6 are in Asia;
global population is around 6.4 billion and growing at 70 million/year,
mostly in low income countries
• In 2000, about 47 % of the world’s population lived in urban areas
• By 2030, 60 % of the world population is expected to be urban
• In Santiago, 4 000 people die prematurely every year from causes related
to air pollution
• In Mexico City, for every increase in ozone of 10 parts per billion, a 0.6%
increase of acute mortality and 1% increase in premature mortality can
occur
• 1973: Urban growth
and expansion of
cropland has led to
decline in woodland
• 1999: The Abuko
Nature Reserve is an
isolated patch of
green in the 1999
image
Urban sprawl and its impact on Banjul
Gambia
Rapidly transforming Midrand city
South Africa
Rapidly transforming
city due to population
growth, agriculture,
mining, and industry
• 1978: Surrounding
area consists largely
of agriculture
• 2002: High
density urban
development
Steady urban growth in Tripoli
Libya
• 1976: Grasslands
have been converted
into agricultural fields
• 2002: Urban
expansion is especially
notable (shades of grey)
Beijing, the capital city of
China, has experienced
explosive growth since
economic reforms in 1979
• 1978: Beijing in 1978
• 2000: Extent of urban
expansion is clearly visible
Explosive growth in Beijing
China
1977-1999: The
population of Delhi
was at 4.4 million in
1975 and grew to
12.4 million in 2000
Growing Delhi and its suburbs
India
Phenomenal growth in Dhaka
Bangladesh
1977-2000: the capital
of Bangladesh has
grown from a city of 2.5
million more than 10
million
Rapid urban growth in Karachi
Pakistan
• 1975: Karachi before
the urban sprawl
• 2001: Note the
change in aerial
extent
Sydney – the country’s largest city
Australia
1975-2002: Over the
last several decades,
Sydney has been
expanding westward
toward the Blue
Mountains
Growing London city
United Kingdom
• Over 7 million
residents
• Population
projected to
approach 8 million by
2021
Urbanization in Moskva
Russia
1975-2001: Images
show urban
expansion during
the last 25 years of
the 20th
century
Seine River dissecting Paris
France
1976-2001: Images
show expansion of
city into the
surrounding rural
areas
Unplanned urban developments in Brasilia
Brazil
•1973-2001:
Unplanned urban
development
resulted in a
collection of urban
“satellites” around
the city
Rapid growth in Santiago
Chile
The explosive
growth of Santiago’s
urban area
Fastest growing megalopolis in the world
- Mexico City, Mexico
• 1973 -Urban growth is
concentrated in the center
of the city
• 2000 -Now expands
dramatically into
surrounding rural areas
Growth
of a
mega city
Denser Vancouver, Canada
1976
•1976-2000: The
city’s population in
2001 was nearly 2
million, compared to
1.3 million in 1976
2000
Las Vegas – Fastest growing metropolitan
area in the United States
• 1973: A small settlement
• 2000-2006:The landscape is
now dramatically modified
Images courtesy USGS
Expanding Las Vegas, United States
Drought in the Western United States
Lake Mead
2000
2004
Hoover Dam and Lake Mead
PhotoView
PhotoView 18 meters
18 meters
Golf courses springing up around Lake Mead
United States
New Golf Courses since 2001
Expansion of Golf Courses
around Lake Mead
Growth of San Francisco
United States
1970-2000: Population
grew from 4.6 million to
7.2 million in the Bay Area
•1972-2000: Seattle
has sprawled since
1980s, with the
current metropolitan
population
estimated at 3.8
million
Sprawling in Seattle, United States
1972
2000
Satellite
images
showing the
dramatic
loss of trees
in the
District
Urban Forest in Washington D.C.
United States
Satellite
images show
urban forest in
Washington
D.C.
Pentagon, 2002 Photo: Digital Globe
Urban Forest in Washington D.C.
United States
Photo: Digital Globe
Fort McMurray, Canada
1974-2004: Massive oil
extraction from oil sands
have remarkably changed
the land area of Fort
McMurray in Alberta
One Planet Many People:
Atlas of Our Changing Environment
Thank You!
Free Downloads:
www.na.unep.net
Purchase:
www.Earthprint.com
URBAN AREAS

rban expansion is defined simply as the physical extension of the geographical footprints of towns

  • 1.
  • 2.
  • 3.
    World Population Growth 1750-2150 •About 3 billion people, or 50 per cent of the global population, already live in urban areas; over the next 25 years, more than 2 billion people are predicted to be added Source: UN- HABITAT Report 2005; United Nations, World Urbanization Prospects, The 1999 Revision Growth of Urban Agglomerations 1950-2015
  • 4.
    • Paris, France •Brasilia, Brazil • Santiago, Chile • Mexico City, Mexico • Vancouver, Canada • Las Vegas, United States • San Francisco, United States • Seattle, United States • Washington D.C., United States • Banjul, Gambia • Midrand, South Africa • Tripoli, Libya • Beijing, China • Delhi, India • Dhaka, Bangladesh • Karachi, Pakistan • Sydney, Australia • London, United Kingdom • Moskva, Russia URBAN AREAS
  • 5.
    URBAN FACTS • Roughly3% of the earth’s land surface is occupied by urban areas, with the highest concentrations occurring along the coasts and waterways Sources: UNEP, WRI, Population Reference Bureau, 2006; UN/ESA,2005 • Of the 10 world's most populous urban agglomerations, 6 are in Asia; global population is around 6.4 billion and growing at 70 million/year, mostly in low income countries • In 2000, about 47 % of the world’s population lived in urban areas • By 2030, 60 % of the world population is expected to be urban • In Santiago, 4 000 people die prematurely every year from causes related to air pollution • In Mexico City, for every increase in ozone of 10 parts per billion, a 0.6% increase of acute mortality and 1% increase in premature mortality can occur
  • 6.
    • 1973: Urbangrowth and expansion of cropland has led to decline in woodland • 1999: The Abuko Nature Reserve is an isolated patch of green in the 1999 image Urban sprawl and its impact on Banjul Gambia
  • 7.
    Rapidly transforming Midrandcity South Africa Rapidly transforming city due to population growth, agriculture, mining, and industry • 1978: Surrounding area consists largely of agriculture • 2002: High density urban development
  • 8.
    Steady urban growthin Tripoli Libya • 1976: Grasslands have been converted into agricultural fields • 2002: Urban expansion is especially notable (shades of grey)
  • 9.
    Beijing, the capitalcity of China, has experienced explosive growth since economic reforms in 1979 • 1978: Beijing in 1978 • 2000: Extent of urban expansion is clearly visible Explosive growth in Beijing China
  • 10.
    1977-1999: The population ofDelhi was at 4.4 million in 1975 and grew to 12.4 million in 2000 Growing Delhi and its suburbs India
  • 11.
    Phenomenal growth inDhaka Bangladesh 1977-2000: the capital of Bangladesh has grown from a city of 2.5 million more than 10 million
  • 12.
    Rapid urban growthin Karachi Pakistan • 1975: Karachi before the urban sprawl • 2001: Note the change in aerial extent
  • 13.
    Sydney – thecountry’s largest city Australia 1975-2002: Over the last several decades, Sydney has been expanding westward toward the Blue Mountains
  • 14.
    Growing London city UnitedKingdom • Over 7 million residents • Population projected to approach 8 million by 2021
  • 15.
    Urbanization in Moskva Russia 1975-2001:Images show urban expansion during the last 25 years of the 20th century
  • 16.
    Seine River dissectingParis France 1976-2001: Images show expansion of city into the surrounding rural areas
  • 17.
    Unplanned urban developmentsin Brasilia Brazil •1973-2001: Unplanned urban development resulted in a collection of urban “satellites” around the city
  • 18.
    Rapid growth inSantiago Chile The explosive growth of Santiago’s urban area
  • 19.
    Fastest growing megalopolisin the world - Mexico City, Mexico • 1973 -Urban growth is concentrated in the center of the city • 2000 -Now expands dramatically into surrounding rural areas Growth of a mega city
  • 20.
    Denser Vancouver, Canada 1976 •1976-2000:The city’s population in 2001 was nearly 2 million, compared to 1.3 million in 1976 2000
  • 21.
    Las Vegas –Fastest growing metropolitan area in the United States • 1973: A small settlement • 2000-2006:The landscape is now dramatically modified Images courtesy USGS
  • 22.
    Expanding Las Vegas,United States
  • 23.
    Drought in theWestern United States Lake Mead 2000 2004 Hoover Dam and Lake Mead PhotoView PhotoView 18 meters 18 meters
  • 24.
    Golf courses springingup around Lake Mead United States New Golf Courses since 2001 Expansion of Golf Courses around Lake Mead
  • 25.
    Growth of SanFrancisco United States 1970-2000: Population grew from 4.6 million to 7.2 million in the Bay Area
  • 26.
    •1972-2000: Seattle has sprawledsince 1980s, with the current metropolitan population estimated at 3.8 million Sprawling in Seattle, United States 1972 2000
  • 27.
    Satellite images showing the dramatic loss oftrees in the District Urban Forest in Washington D.C. United States
  • 28.
    Satellite images show urban forestin Washington D.C. Pentagon, 2002 Photo: Digital Globe Urban Forest in Washington D.C. United States Photo: Digital Globe
  • 29.
    Fort McMurray, Canada 1974-2004:Massive oil extraction from oil sands have remarkably changed the land area of Fort McMurray in Alberta
  • 30.
    One Planet ManyPeople: Atlas of Our Changing Environment Thank You! Free Downloads: www.na.unep.net Purchase: www.Earthprint.com URBAN AREAS

Editor's Notes

  • #3 World Population Growth, 1750–2150
  • #5 Asia Pacific saw dramatic improvement in urban water supply coverage, where 368 million people had gained access to improved drinking water, an increase of 35% of the total rural population of the region since 1990.
  • #6 The Gambia is a small—11 295 km2 (4 361 square miles)—country in West Africa. It is surrounded by Senegal on all sides except on its coast. The capital city of Banjul lies at the end of a small peninsula that protrudes into the Atlantic Ocean. The country’s population is increasing at a rate of about 4.2 per cent annually. For the past three decades, western Gambia has undergone considerable urban growth, particularly in Banjul and some of its neighboring cities, including Serekunda, Bakau, Sukuta, and Brikama. The population of the greater Banjul area, for example, more than tripled during this time. These two satellite images, taken in 1973 and 1999 respectively, show this urban sprawl and its impact. Urban growth and the accompanying expansion of cropland around urban areas have led to a significant decline in woodland areas (dark green). The Abuko Nature Reserve, located in the center of the images, was once surrounded by woodlands. It now stands out as an isolated patch of green in an otherwise developed landscape.
  • #7 Midrand is located approximately halfway between the major urban centers of Johannesburg and Pretoria in South Africa. The major highway that connects these two large cities dissects the city of Midrand into east and west halves. Since 1978, the city has been rapidly transformed as a result of population growth, agriculture, mining, and industry. In the 1978 image, the area surrounding Midrand consists largely of agricultural lands and rural residential zones, with some evidence of commercial development. The 2002 image reveals high-density urban development throughout. Rapid growth of Midrand’s economy is expected to continue. Current development trends and population growth rates indicate that if effective environmental management strategies are not adopted soon, significant deterioration in the quality of the environment can be expected.
  • #8 Tripoli, the capital city of Libya, is located on the country’s Mediterranean coast along a narrow band of fertile lowlands that quickly give way to a vast interior of arid, rocky plains and seas of sand. Tripoli has undergone steady urban growth over the past thirty years. These three satellite images, from 1976, 1989, and 2002, document some of the major changes. Urban areas appear as shades of grey. Darker patches south of the city, visible in both the 1976 and 1989 images represent grasslands that have been converted to agricultural fields. Bright green areas are planted croplands. In the 2002 image, urban expansion is especially notable. The irregular brown patch in the upper far right of this image, south of Al Hamidiyan, is perhaps the last remaining vestige of natural vegetation in the Tripoli region.
  • #9 Beijing, the capital city of the People’s Republic of China, is located in the country’s northeastern corner, in the transition zone between the Inner Mongolia Plateau and the North China Plain. It is a city that has undergone tremendous change and explosive urban growth, since the start of economic reforms in 1979. The left-hand satellite image shows Beijing in 1978, just prior to the reforms. The light blue-gray area in the center of the image is the urban landscape of the city. The hills to the west are covered with deciduous forest, which appears green. The agricultural lands that lie around the city appear as muted red, orange, and golden yellow, depending on the crop (rice, winter wheat, or vegetables) and its stage of development. Beijing’s explosive growth is very obvious in the 2000 image. The city has expanded from its original center in all directions. Prime agricultural lands that once lay outside the city are now suburbs dominated by institutional, industrial, and residential buildings. In 2000, Beijing’s population was 13 million.
  • #10 India occupies only two per cent of the world’s total landmass. Yet it is home to 15 per cent of the world’s total population. Urban growth is characteristic of most Indian cities, with that of Delhi being especially dramatic, as these satellite images from 1977 and 1999 clearly show. In 1975, Delhi had a population of 4.4 million people or 3.3 per cent of India’s entire urban population. In 2000, the city had 12.4 million inhabitants, or more than 4.5 per cent of the country’s urban population. Of the world’s 30 largest urban agglomerations, Delhi ranked 24th in 1975 and tenth in 2000. By 2015, Delhi’s population is expected to be 20.9 million. In these images, urban areas appear in shades of gray and purple. Growth is especially noticeable in the suburbs and areas surrounding Delhi such as Ghaziabad, Faridabad, and Gurgaon. Rapid urbanization has placed tremendous pressure on land and water resources in and around Delhi.
  • #11 Dhaka, the capital of Bangladesh, has undergone phenomenal growth since the country gained independence in 1971. It has grown from a city of 2.5 million inhabitants to one with a population of more than ten million. This increase represents an average population growth rate of about eight per cent annually. Dhaka is one of the poorest and most densely populated cities on the planet, with 6 545 people per square kilometre. Following independence, urban areas expanded rapidly as they sought to become hubs of production and modernization. In the process, land use changed dramatically, as these images from 1977 and 2000 reveal. Dhaka is visible in the central portion of each image along the Turag River. Green areas represent forests and agricultural lands. White spots are planned areas of infrastructure. Urban areas are light purple. The 2000 image shows how, over time, lowlands and agricultural lands have been converted to urban areas where Dhaka has expanded to the north.
  • #12 Tripoli, the capital city of Libya, is located on the country’s Mediterranean coast along a narrow band of fertile lowlands that quickly give way to a vast interior of arid, rocky plains and seas of sand. Tripoli has undergone steady urban growth over the past thirty years. These three satellite images, from 1976, 1989, and 2002, document some of the major changes. Urban areas appear as shades of grey. Darker patches south of the city, visible in both the 1976 and 1989 images represent grasslands that have been converted to agricultural fields. Bright green areas are planted croplands. In the 2002 image, urban expansion is especially notable. The irregular brown patch in the upper far right of this image, south of Al Hamidiyan, is perhaps the last remaining vestige of natural vegetation in the Tripoli region.
  • #13 Australia is the sixth largest country in the world. It is roughly the same size as the conterminous United States and 50 per cent larger than Europe. Yet Australia has the lowest population density of any country in the world. With 4 million inhabitants, Sydney is Australia’s largest city. It is also the capital of New South Wales, the country’s most densely populated state. Sydney is bounded by the Pacific Ocean to the east, national parks and deep-water inlets to the north and south, and the spectacular Blue Mountains far to the west. These natural boundaries have influenced Sydney’s urban growth patterns. Over the past several decades, the city’s expansion has been largely westward toward the Blue Mountains, as can be seen in these two satellite images. As suburbs sprawl into bushland, they become vulnerable to summer bush fires.
  • #15 Moskva—Russia’s capital city and its political and economic heart—sits on the far eastern end of Europe, roughly 1 300 km (815 miles) west of the Ural Mountains and the Asian continent. The Moskva (Moscow) River winds through the city, and the Kremlin, the seat of the Russian government, lies at its center. With a population close to 9 million and an area of 1 035 km2 (405 square miles), Moskva is believed to be the largest of all European cities. These two images show the urban expansion Moskva experienced during the last 25 years of the 20th century. The blue-gray patches are urban areas. The light green areas surrounding the city are farms while the brown areas are regions of sparse vegetation.
  • #16 France is a large country with relatively few large metropolitan areas. Only 16 French towns and cities have populations of more than 150 000 people. Paris, the capital city of France, is the largest of these and home to roughly 2 million inhabitants. The entire Paris metropolitan area, however, includes more than 11 million people. Lying roughly 160 km (100 miles) southeast of the English Channel in northern France, Paris is considered by many to be one of the most beautiful cities in the world. In the images above, the Seine River can be seen winding its way through the heart of the city. Urban areas appear gray and purple. The patchwork of green, brown, tan and yellow around the city is primarily farmland. Note how the city has expanded in the years between 1987 and 2001, reaching ever-further into the surrounding rural areas.
  • #17 Inaugurated on 21 April 1960, Brazil’s new capital of Brasilia began with a population of 140 000 and a master plan for carefully controlled growth and development that would limit the city to 500 000. Urban planner Lucio Costa and architect Oscar Niemeyer intended that every element—from the layout of the residential and administrative districts to the symmetry of the buildings themselves— should act in harmony with the city’s overall design. This consisted of a birdshaped core with residential areas situated between the encircling “arms” of Lake Paranoá. The city was a landmark in town planning and was recognized as a World Heritage site in 1987. As these images reveal, unplanned urban developments arose at Brasilia’s fringes resulting in a collection of urban “satellites” around the city. Several new reservoirs have been constructed since Brasilia’s birth, but the National Park of Brasilia stands out as a densely vegetated expanse of dark green that has remained relatively unchanged. In 1970, the population of Brasilia and its satellites was roughly 500 000. The population now exceeds 2 000 000.
  • #18 Santiago, the capital of Chile, is home to more than one-third of the country’s total population of 15 million. Santiago’s rapid growth is part of a national trend, but it is also a reflection of the large numbers of immigrants who are moving into the city. Santiago’s population growth has led to a horizontal expansion of the city, principally towards the south and southeast. Chilean urban scholars speak of this expansion as the “urban stain” that continually exceeds and expands the limits of the Metropolitan Region of Santiago (MRS) while incorporating previously rural areas into it. Characteristics of Santiago’s urban sprawl are haphazard growth, low-density housing, poor transportation, and air pollution. In the time frame illustrated by these images, Santiago’s population has nearly doubled.
  • #19 Mexico City is one of the fastest growing megalopolis cities in the world. These satellite images show the transformation Mexico City underwent between 1973 and 2000. Areas of urban infrastructure appear as shades of purple while natural vegetation is shown in green. In 1973 Mexico City had a population of about 9 million. In the ensuing years, the city expanded into surrounding areas. The forests in the mountains west and south of the city suffered significant deforestation as the urban sprawl progressed. By 1986, Mexico City’s population had soared to 14 million. In 1999, Mexico City had a population of 17.9 million, making it the second largest metropolitan area in the world behind Tokyo, Japan. The Mexican megalopolis is expected to reach 20 million in the next few years.
  • #20 Vancouver is bounded by the Pacific Ocean to the west, the Fraser River to the south, the Coast Mountains to the north and the Fraser Valley to the east. With a population of about 2 160 000 (based on the 2004 census), Vancouver is the largest city in the province of British Columbia and the third largest in Canada. While English is the main language, Vancouver residents speak more than 70 languages, making the city ethnically diverse. Vancouver grew by about 450 000 to 500 000 people during the 1990s, on average developing 1.6 ha of previously undeveloped land per day. The Vancouver, B.C., urban area has also become denser since the 1980s. Compact, pedestrian-friendly neighborhoods contained 80 per cent of the city’s growth between 1986 and 1996. The population by 2001 was nearly 2 million compared to 1.3 million in 1976. The 2000 satellite image shows the increased urban area in the Vancouver.
  • #21 Las Vegas is the fastest growing metropolitan area in the United States. Its growth was fairly slow during the first half of the 20th century, but as the gaming and tourism industry blossomed the population increased more rapidly. In 1950, Las Vegas was home to 24 624 people. Today, the population of the Las Vegas Valley tops one million, not including the tourists. According to one estimate, it may double by 2015. This population growth has put a strain on water supplies. Satellite imagery of Las Vegas provides a dramatic illustration of the spatial patterns and rates of change resulting from the city’s urban sprawl. Las Vegas is shown in the central portion of these images from 1973 and 2000. Note the profound modifications to the landscape—specifically the proliferation of asphalt and concrete roads and other infrastructure, along with the displacement of the few vegetated lands. By 2000, Las Vegas’ growth had sprawled in every direction, with the greatest expansion to the northwest and southeast. As the city expanded, several new transportation networks emerged to serve the city’s inhabitants.
  • #26 Seattle is the largest city in the Pacific Northwest region of the United States. It is located in the U.S. state of Washington between Puget Sound and Lake Washington, nearly 108 miles (174 km) south of the United States–Canadian border. Seattle has sprawled since 1980s. Low density residential areas made up three-fifths of the Seattle-Tacoma urban area’s growth during the 1990s. During the decade, the Seattle-Tacoma metro area lost an average of 4 hectare of open space per day to suburban development, as measured by satellite imagery. There was an overall increase of 500 000 people from 1990-2000. The current metropolitan population is estimated at 3.8 million, with estimated 573 000 living in the city area. The Seattle region’s economy includes leading-edge clusters such as aerospace, information technology, life sciences/biotechnology, clean technology/environmental industries, logistics and international trade. The clean technology/environmental engineering and services sector includes 400 companies employing about 16,000 people. Seattle is the center of a thriving gourmet coffee industry; a dynamic recreation equipment sector; the nation’s largest marine and fisheries sector; a dynamic film and video industry employing 5 000 people, and a vibrant music industry supporting 9 000 jobs.
  • #29 Vast reserves of low quality oil underlie the Boreal Forest surrounding Fort McMurray in northern Alberta, Canada in the form of “oil sands.” The oil held in these reserves raises Canada to second place on the list of oil rich countries, behind only Saudi Arabia in total reserves. Rapid urbanization, one of the many causes of increased oil consumption, is driving up the oil prices, thus creating an oil boom in northern Alberta. Local people including the Native American population are concerned that exploitation will come at too great a cost to the environment. In 2001 oil extracted from oil sands (271 million barrels) exceeded oil extracted by conventional means (264 million barrels) for the first time. In 1967 The Great Canadian Oil Sands Company began construction at its Mildred Lake site. In 1974 they were joined by the Syncrude Corporation which began construction of a mine in the same area. By early 2006 the mining operations had expanded to cover an area roughly 30 km by 20 km. Syncrude operates a second mine, the Aurora, approximately 30 km to the north of Mildred Lake. With the increase in urban population and their dependency to individual vehicle, the mining operations are likely to expand even further. Sources: Oil and Gas Journal, 2004; 2002-2003 Canadian Centre for Energy Information