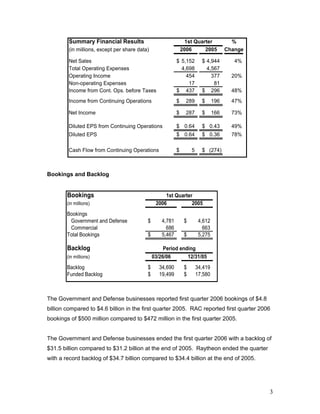
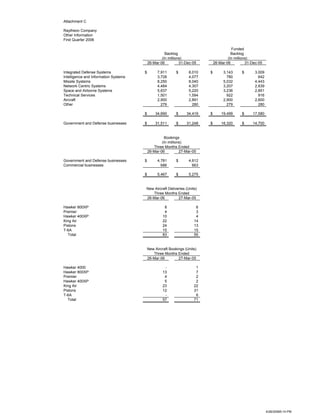
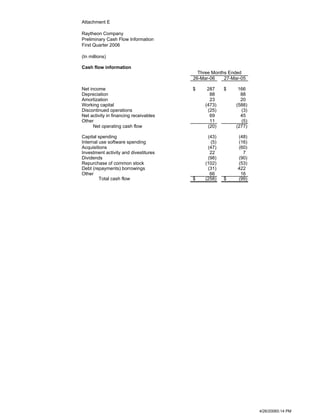
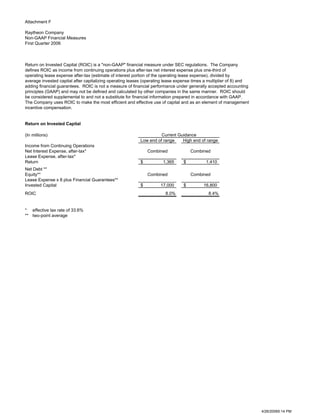
Raytheon reported strong financial results for the first quarter of 2006. Key highlights included earnings per share increasing 49% to $0.64, record backlog of $34.7 billion, and increased full-year guidance for EPS and operating cash flow. Segment results were positive across all business units. For the full year, Raytheon increased EPS guidance to $2.55-$2.65 and operating cash flow guidance to $1.9-$2.1 billion.
Raytheon reported strong financial results for the second quarter of 2006, with earnings per share up 35% and sales up 6%. The company increased its full-year guidance for earnings per share, operating cash flow, and return on invested capital. Raytheon also announced its intention to explore strategic alternatives for its Raytheon Aircraft Company business unit, including a potential sale. Segment results were positive across most business units, with higher sales, bookings, and operating income compared to the second quarter of 2005.
Raytheon reported strong financial results for the fourth quarter and full year of 2007. Quarterly sales increased 8% to $6 billion and income from continuing operations was up 84% to $634 million. For the full year, sales rose 8% to $21.3 billion while income from continuing operations grew 43% to $1.7 billion. Raytheon also increased its bookings guidance for 2008 based on record backlog of $36.6 billion in the fourth quarter.
Raytheon reported strong financial results for the fourth quarter and full year 2006. Quarterly sales increased 12% to $5.7 billion due to growth at Integrated Defense Systems, Missile Systems, and Network Centric Systems. Earnings per share from continuing operations increased 27% to $0.65 for the quarter. For the full year, sales increased 7% to $20.3 billion and earnings per share from continuing operations increased 37% to $2.46. Raytheon also provided guidance for 2007, forecasting earnings per share from continuing operations between $2.85 to $3.00 on sales between $21.4 to $21.9 billion.
Raytheon reported strong financial results for Q3 2006, with EPS up 41% and bookings of $6.1 billion. The company increased full-year 2006 guidance for EPS, bookings, operating cash flow and ROIC. Segments such as IDS, MS and RAC saw higher sales and improved operating performance compared to Q3 2005. Raytheon also provided initial guidance for 2007 with projected continued growth.
Raytheon reported financial results for Q4 2005 and full year 2005. Key highlights included 9% revenue growth in Q4 and 8% for the full year. Free cash flow was $1 billion for Q4 and $2.1 billion for the full year. Raytheon also provided financial guidance for 2006, forecasting revenue between $23.1-23.6 billion and GAAP EPS between $2.45-2.55. The company expects continued growth in bookings and backlog while further reducing debt levels.
Raytheon reported strong financial results for the first quarter of 2007, with sales up 6% to $4.9 billion and operating income up 18% to $510 million compared to the first quarter of 2006. Earnings per share from continuing operations were up 13% to $0.69. The company also achieved record backlog of $33.9 billion and solid bookings of $5.3 billion in the quarter. Raytheon reaffirmed its full-year 2007 financial outlook and announced it had initiated a $1 billion debt redemption following the completion of the sale of its aircraft unit Raytheon Aircraft Company.
Raytheon reported Q4 earnings. Key highlights included bookings of $5.5 billion, sales growth of 12% to $5.7 billion, and earnings per share of $0.54. Segment results were positive, with most experiencing sales growth in the high single digit to low double digit range compared to Q4 2003. For 2005, Raytheon expects bookings of $22.5-$23.5 billion, sales of $21.5-$22 billion, and GAAP EPS of $1.80-$1.90. Free cash flow is projected at $1.2-$1.4 billion.
Raytheon reported strong financial results for the fourth quarter and full year 2005. Fourth quarter sales increased 9% to $6.2 billion and income from continuing operations grew 15% to $282 million. For the full year, sales rose 8% to $21.9 billion and income from continuing operations increased 115% to $942 million. Raytheon also reduced its net debt by $1.3 billion in 2005 to $3.3 billion, the lowest level in ten years, and generated $2.1 billion in free cash flow from continuing operations for the full year. Looking ahead, Raytheon expects 2006 sales between $23.1-23.6 billion and earnings per share from continuing operations of $
- Raytheon reported strong second quarter 2007 results with EPS from continuing operations up 30% and sales up 9%.
- They completed the sale of Raytheon Aircraft Company, resulting in $2.4 billion in after-tax proceeds.
- For the full year, Raytheon increased guidance for EPS, bookings, and return on invested capital.
- Segment results were positive with Integrated Defense Systems sales up 12% and operating income up 20% compared to the second quarter of 2006.
Raytheon Reports 2004 First Quarter Resultsfinance12
Raytheon reported first quarter earnings for 2004. Revenue increased 11% year-over-year to $4.676 billion, driven by double-digit growth at IDS, IIS, and SAS. Operating income increased 9% to $372 million excluding pension adjustments. Strong bookings resulted in a record backlog of $31.2 billion. The company reiterated its full-year guidance for revenue over $20 billion, GAAP EPS from continuing operations of $1.30-1.40, and free cash flow over $1 billion.
Raytheon reported strong third quarter 2007 results with bookings of $6.5 billion and sales of $5.4 billion, up 8% from the prior year. Earnings per share from continuing operations were $0.69, up 17% year-over-year. Raytheon also announced a new $2 billion share repurchase program and the pending sale of its Flight Options subsidiary. Segment results were positive across Integrated Defense Systems, Missile Systems, Network Centric Systems and Intelligence and Information Systems on higher sales and margins.
Burlington Northern Santa Fe Corporation reported record quarterly and annual earnings in 2006. For the fourth quarter, earnings per share increased 26% compared to the previous year. Freight revenues increased 9% to $3.77 billion due to a 4% rise in volume. Operating income rose 18% to $942 million and the operating ratio improved to 75.0%. For the full year 2006, earnings per share increased 27% and the company exceeded $1 billion in free cash flow before dividends.
This document summarizes Raytheon's financial results for the fourth quarter and full year of 2008. Key points include: Raytheon reported solid financial results for Q4 and full year 2008, with record backlog of $38.9 billion; Q4 sales were $6.1 billion and adjusted EPS was $1.13; Full year sales grew 9% to $23.2 billion and adjusted EPS grew 23% to $4.06; Raytheon reaffirmed its financial guidance for 2009 and expects continued growth.
hess 01/30/2008 Estimated Results for the Fourth Quarter of 2007finance8
Hess Corporation reported its estimated results for the fourth quarter of 2007. Key highlights include:
- Net income was $510 million compared to $359 million in the fourth quarter of 2006.
- Oil and gas production increased to 390,000 barrels per day, up from 366,000 in the fourth quarter of 2006.
- Reserve replacement was 167% in 2007 and reserve life increased to 9.5 years.
- Exploration and Production earnings were $583 million, up from $350 million in the fourth quarter of 2006.
- Major brands in the Consumer Foods segment that posted sales growth in Q4 FY06 included Blue Bonnet, Chef Boyardee, DAVID, Egg Beaters, Hebrew National, and Hunt's. Brands that posted sales declines included ACT II, Banquet, Healthy Choice, Peter Pan, Slim Jim, Snack Pack, and Van Camp's.
- Consumer Foods volume declined 2% in Q4 while Food and Ingredients volume increased 1%.
- Total depreciation and amortization for Q4 was approximately $85 million and approximately $353 million for all of FY06. Capital expenditures were approximately $92 million for Q4 and $288 million for FY
The document provides earnings information for Raytheon Company for the fourth quarter and full year 2006. It summarizes key financial metrics including strong bookings, record backlog, increased sales and earnings per share, and record operating cash flow. It also provides Raytheon's financial outlook for 2007 with projections for sales, earnings per share, operating cash flow, and return on invested capital.
The document provides the questions and answers from the Q1 FY06 earnings call for ConAgra Foods. Some key details from the summary include:
- Sales grew for major brands like Butterball but declined for brands like ACT II. Retail Products volume declined 3% while Foodservice increased 4%.
- Depreciation and amortization was $89 million. Capital expenditures were $71 million and net interest expense was $68 million. Corporate expense was $73 million.
- Gross margin was 21.6% and operating margin was 10.9%. The effective tax rate for FY06 is estimated to be 36%.
Hexion Chemicals held a conference on March 25, 2008 to discuss its financial results and outlook. The presentation contained forward-looking statements and non-GAAP financial measures with reconciliations provided. Hexion achieved strong revenue and earnings growth in 2007 driven by diversification across segments, geographies, and end markets. Management expects volatility in raw material costs to continue into 2008 and remains focused on productivity initiatives, synergies, and strategic acquisitions to fuel further growth.
Celanese Corporation reported record fourth quarter and full year results for 2007. Key highlights include a 23% increase in fourth quarter net sales compared to the prior year and operating profit more than doubling. For the full year, net sales increased 12% and operating profit increased 21% compared to 2006. Based on continued strength in global markets, the company raised its full year 2008 outlook for adjusted earnings per share and operating EBITDA.
YRC Worldwide Inc. announced its second quarter 2007 earnings. Reported EPS was $0.95 compared to $1.58 in 2006. Revenue was $2.5 billion compared to $2.6 billion last year. National Transportation performed strongly with an operating ratio of 94.6%. However, overall results were impacted by a weak shipping market. For the full year, the company expects interest expense of $90 million, a tax rate of 36.9%, and free cash flow over $200 million.
CBS reported strong financial results for Q4 2006 and full year 2006. Q4 operating income increased 14% and net earnings from continuing operations increased 44% compared to the prior year. For the full year, operating income increased 5% and net earnings from continuing operations increased 16%. Television, Outdoor, and Publishing saw increased revenues and profits, while Radio declined. CBS expects continued growth in the long term through expanding its existing businesses and capitalizing on digital opportunities.
Danaher Corporation announced record first quarter results for 2006, with net earnings of $216 million, a 15% increase from 2005. Total sales increased 17.5% to $2.14 billion due to 12.5% growth from acquisitions and 7.5% core revenue growth. Operating cash flow was also up 8% from the previous record set in 2005. The company's CEO stated that the broad-based strength across businesses reinforces confidence in delivering positive results for the rest of 2006.
Bank of America reported record first quarter 2006 earnings of $5 billion, up 14% from the same period in 2005. Net income grew 1% excluding merger charges. Total revenue increased 10% driven by a 55% rise in market sensitive revenue and 5% growth in other revenue. Expenses grew 5% while operating leverage was positive at 5%. The financial results reflected strong performance across global consumer and small business banking and card services.
shaw group 8C04E297-E3DD-4F1E-8BB2-56C5BB51CEDA_SGR_AnnualShareholdersMeeting...finance36
The document summarizes The Shaw Group Inc.'s annual meeting for fiscal year 2008. It provides key financial results including record revenue, EBITDA, net income, and EPS. It also discusses major projects, growth in backlog to $15.6 billion, and guidance for fiscal year 2009 revenues of $7.1-7.3 billion and EPS of $2.50-2.70 per share.
The document provides the quarterly and annual financial results for a company. Some key highlights include:
- Several consumer brands posted sales growth for the quarter including Banquet, Blue Bonnet, and Chef Boyardee, while others like ACT II and Eckrich saw declines.
- Total depreciation and amortization was around $93 million for the quarter and $352 million for the fiscal year.
- Capital expenditures were around $106 million for the quarter and $352 million for the fiscal year.
- Net interest expense was $80 million for the quarter and $275 million for the fiscal year.
- Corporate expenses were around $95 million for the quarter and $342 million
This document summarizes the political landscape and top environmental issues in Ohio for 2013. It identifies the key political figures like the Governor and legislative leaders. It also outlines the major committees that will consider environmental legislation. Ten top issues are highlighted, such as clean water, energy, transportation, and fracking. The document suggests challenges like new lawmakers could become opportunities with education. It indicates important deadlines and resources for advocates to influence policy debates.
Do you really understand what happens to your students' careers after they graduate? Find out about how Path 101 can help. Contact Charlie O'Donnell at charlie@path101.com.
This document discusses different methods of perspective in images including computer generated perspective, perspective of a photo of a model, perspective of a known space from a photo, and geometric projection perspective. Geometric projection perspective involves using geometric rules to project three dimensional space onto a two dimensional surface.
This document lists 5 projects: an app for canned tuna company Greenpeace, an annual report for Tourism Australia, a youth brand for Tourism Australia, an identity and website for furniture company Möbelstuck, and an illustrated map and design project for Tourism Australia.
Este documento apresenta um guia de atividades experimentais para alunos do 12o ano de química no Externato Delfim Ferreira em Riba d'Ave. O guia inclui onze experimentos e destina-se a apoiar os trabalhos experimentais dos alunos, sem esgotar a pesquisa que devem realizar. Foi elaborado por Cristina Ferreira e Carlos Folhadela em outubro de 2002.
This document discusses asynchronous requests in jQuery. It introduces AJAX and its benefits, describes how to make basic AJAX calls with jQuery's $.ajax() method, outlines shortcuts like $.get() and $.post(), explains how to use global event handlers, and provides tips for AJAX application design considerations. The document also lists tools for AJAX development and provides examples of making AJAX calls with jQuery.
The document summarizes the causes and likely outcomes of the Financial Panic of 2007. It identifies the proximate causes as the credit crisis in the subprime mortgage market, the ensuing recession, changes in accounting rules that reduced bank capital, and the resulting liquidity crisis. A probable outcome mentioned is that there will be both winners and losers in the stock market, and increased regulation of financial institutions and transactions.
This document provides an introduction to metadata, including what it is, its purposes, and types. Metadata is data that describes other data, such as author, title, and subject for a document. It helps identify, manage, retrieve, and connect related content. There are three main types - descriptive, structural, and administrative. Metadata standards like Dublin Core and taxonomies help ensure consistency and enable interoperability across collections. High quality metadata requires careful planning, structure, and maintenance.
wyeth UBS Global Life Sciences Conferencefinance12
The document is a presentation from Mary Katherine Wold, Senior Vice President of Taxes and Treasury at UBS Global Life Sciences Conference on September 26, 2006. It discusses Wyeth's financial performance for the first half of 2006, with net revenue increasing 8% to $10 billion and net income increasing 15% to $1.94 billion. It also provides updates on several of Wyeth's key marketed products, including Enbrel, Effexor, Prevnar, Protonix, and Premarin.
Raytheon Reports 2006 Third Quarter Resultsfinance12
The document provides an earnings summary and outlook for Q3 2006 and full year 2006-2007. It summarizes that earnings per share increased 41% in Q3 2006, bookings remained strong, and guidance was increased for EPS, bookings, operating cash flow and ROIC. The summary also mentions that net debt declined to its lowest point in over 11 years and over 5.5 million shares were repurchased in the quarter.
The document discusses negotiations to amend the Great Lakes Water Quality Agreement (GLWQA). Key points include:
1) Negotiations are taking place to update the GLWQA through a phased public engagement process.
2) The amendments aim to streamline processes, improve governance, enhance protection of nearshore areas, and clarify roles of stakeholders and the International Joint Commission.
3) The renewed agreement will retain the goal of restoring ecosystem health, and strengthen commitments to remediating contaminated sites and managing issues across entire lakes.
This document discusses vernal pools as important amphibian breeding habitat. It notes that vernal pools are seasonal forest depressions fed by surface water and groundwater. They provide habitat for many amphibian species but are disappearing. The document summarizes the habitat needs of various amphibian species that use vernal pools, including woodlands surrounding the pools, seasonal hydrology, an absence of fish, and leaf litter. It emphasizes that protecting existing vernal pool habitats and creating new habitats is important for reversing the decline of amphibian populations that rely on these ephemeral wetlands.
This document lists various articles of clothing in a single paragraph without descriptions. It mentions common clothing items like t-shirts, hats, shorts, skirts, socks, shoes, ties, shirts, dresses, trousers, pajamas, swimsuits, gloves, mittens and coats.
Manpower Inc. had record revenues and earnings in 2007. Revenues increased 17% to $20.5 billion while net earnings grew 22% to $484.7 million. The company has diversified its services over the past decade to include specialty services beyond temporary staffing, such as permanent recruitment and leadership development. This has improved profit margins and reduced sensitivity to economic cycles. Investments in new services like recruitment process outsourcing have positioned Manpower for continued growth.
The document discusses ways for individuals to get involved with and contribute to the WordPress community. It outlines that there are two types of community members - subscribers and contributors. While there is nothing wrong with only being a subscriber, the document encourages people to become contributors by sharing their knowledge, skills and time. Specific opportunities mentioned for contributing include translating, creating videos, improving accessibility, testing beta releases, volunteering at events, applying to speak at events, and participating in local meetup groups. Common myths about not having enough skills, being an introvert, or not having enough time are addressed and dismissed. The overall message is that everyone has something valuable to offer the WordPress community.
Tom Jones, Head of Media at iCrossing, presentation from SES 2011 - PPC Beyond Search. Looking at today's PPC landscape; beyond the text ad; the importance of creativity and approaches & mindsets for success
Raytheon reported financial results for Q4 2005 and full year 2005. Key highlights included 9% revenue growth in Q4 and 8% for the full year. Free cash flow was $1 billion for Q4 and $2.1 billion for the full year. Raytheon also provided financial guidance for 2006, forecasting revenue between $23.1-23.6 billion and GAAP EPS between $2.45-2.55. The company expects continued growth in bookings and backlog while further reducing debt levels.
Raytheon reported strong financial results for the third quarter of 2008, with sales up 12% and earnings per share up 17%. The company increased its full-year earnings guidance and announced a new $2 billion share repurchase plan. All of Raytheon's business segments experienced sales growth in the quarter.
Major brands in the Retail Products segment that posted sales growth included ACT II, Blue Bonnet, Butterball, Kid Cuisine, Marie Callender's, Reddi-wip and Ro*Tel. Brands that posted sales declines included Armour, Banquet, Cook's, DAVID, Eckrich, Egg Beaters, Healthy Choice, Hebrew National, Hunt's, LaChoy, Orville Redenbacher, PAM, Parkay, Peter Pan, Slim Jim, Snack Pack, Swiss Miss, Van Camp's and Wesson. Retail Products volume declined 5% for the quarter while Foodservice Products volume increased 2%. Corporate expense for the quarter was approximately $103 million
- Goodrich Corporation reported fourth quarter 2006 results with sales growth of 10% and segment operating margin increase from 11.2% to 12.5% compared to fourth quarter 2005.
- Net income per diluted share was $0.78, reflecting 39% growth including tax adjustments and stock-based compensation expenses.
- For full year 2006, sales grew 9% and segment operating margin increased from 11.5% to 13.0% compared to full year 2005. Net income per diluted share grew 79%.
Goodrich Corporation reported fourth quarter and full year 2006 results on February 1, 2007. Some key highlights include:
- Fourth quarter 2006 sales grew 10% year-over-year with growth in all segments and major market channels. Segment operating margin increased from 11.2% to 12.5%.
- Net income per diluted share was $0.78, reflecting 39% growth over fourth quarter 2005.
- For the full year 2006, sales grew 9% year-over-year. Segment operating income increased 22% and margin increased 1.5% to 13.0%. Net income increased 83%.
- The company cautions that any forward-looking statements are subject to risks and uncertainties that could cause
Goodrich Corporation reported first quarter 2008 results with sales growth of 13% and segment operating income margin increasing from 14.9% to 17.3%. Net income per diluted share increased 59% to $1.24, including $0.03 from discontinued operations. For full-year 2008, Goodrich increased its sales outlook to $7.2-7.3 billion (13-14% growth) and net income per diluted share outlook to $4.30-$4.45 (14-18% growth). Key drivers included strong commercial aircraft production and aftermarket demand as well as positions on new defense platforms.
Goodrich Corporation reported first quarter 2008 results with sales growth of 13% and segment operating income margin increasing from 14.9% to 17.3%. Net income per diluted share increased 59% to $1.24, which includes $0.03 from discontinued operations. For full-year 2008, Goodrich increased its sales outlook to $7.2-7.3 billion (13-14% growth) and net income per diluted share outlook to $4.30-$4.45 (14-18% growth). Key drivers include strong demand for commercial aircraft and aftermarket services as well as defense programs.
- 3M reported strong financial results for the first quarter of 2006, with sales growth of 8.3% and EPS growth of 20.6% compared to the first quarter of 2005.
- All six of 3M's business segments saw operating income increases, led by the Safety, Security & Protection Services segment with a 30.3% increase.
- For the second quarter of 2006, 3M expects local currency sales growth of 5-8% and EPS between $1.14-$1.17, and for the full year expects local currency sales growth of 5.5-8% and EPS of $4.55-$4.65.
U.S. Bancorp reported record net income for 2006 of $4.8 billion, up 5.8% from 2005. Net income for Q4 2006 was $1.2 billion, a 4.5% increase from Q4 2005, driven by growth in fee income and lower credit costs, partially offset by lower net interest income. The net interest margin declined from 3.88% in Q4 2005 to 3.56% in Q4 2006 due to competitive lending pressures and changes in the yield curve. Return on assets and equity remained strong at 2.18% and 23.2% respectively for Q4 2006.
This document summarizes ConAgra Foods' earnings results for fiscal year 2005 (FY05) in a question and answer format. Some key details include:
- FY05 diluted EPS was $1.23, including $0.12 in expenses that impacted comparability.
- Major brands in the Retail Products segment that saw sales growth included ACT II, Banquet, and Blue Bonnet. Brands that saw declines included Armour and Butterball.
- Retail Products volume increased 2% while Foodservice Products volume decreased 2% in Q4.
- Total depreciation and amortization was approximately $351 million for FY05 and $90 million for Q4. Capital expenditures
Raytheon reported strong financial results for the first quarter of 2008. Sales increased 11% to $5.4 billion compared to the first quarter of 2007, driven by growth across all business segments. Operating income rose 17% to $608 million due to increased volume and lower expenses. Earnings per share from continuing operations increased 31% to $0.93. The company also achieved record backlog of $37.7 billion and solid bookings of $6.5 billion during the quarter. Raytheon reaffirmed its full-year 2008 guidance and expects continued growth.
- Bank of America reported third quarter 2006 results with total revenue of $18.961 billion, an 11% increase from third quarter 2005, and net income of $5.416 billion, a 20% increase.
- Net interest income was $8.894 billion, a 1% increase, impacted by the sale of Brazilian operations and prior year FAS 133 impact. Noninterest income increased 20% to $10.067 billion.
- Global Consumer & Small Business Banking reported net income of $2.889 billion, a 13% increase, driven by increases in cards, deposits, and debit purchase volume.
El Paso Corporation reported financial and operational results for the first quarter of 2006. Key highlights included:
- EBIT of $888 million, up significantly from $463 million in the first quarter of 2005.
- Pipelines segment EBIT of $478 million, up 16% year-over-year, driven by growth projects and acquisitions.
- Exploration and Production segment EBIT of $199 million, in line with prior year despite lower production volumes impacted by hurricanes.
- $1.3 billion in gross debt reduction year-to-date through asset sales and cash flow. Balance sheet metrics continue to improve.
- 130 Bcf of 2007 production hedged to provide
Goodrich Corporation reported third quarter 2006 results with the following highlights:
- Sales grew 5% year-over-year to $1.436 billion, with growth in all segments.
- Net income per diluted share was $0.80, a 63% increase from third quarter 2005.
- Segment operating margins improved in all segments compared to third quarter 2005.
- The company initiated a $300 million share repurchase program to reduce dilution from equity compensation programs.
Goodrich Corporation reported third quarter 2006 results with the following highlights:
- Sales grew 5% year-over-year to $1.436 billion, with growth in all segments.
- Net income per diluted share was $0.80, a 63% increase from third quarter 2005.
- The company authorized a $300 million share repurchase program to reduce dilution from equity programs.
- Segment operating margins improved in all segments compared to third quarter 2005.
Goodrich Corporation reported fourth quarter 2007 results with the following highlights:
- Sales grew 12% to $1.668 billion compared to fourth quarter 2006, driven by strong commercial aftermarket sales.
- Segment operating income margin increased from 13.0% to 15.9% year-over-year.
- Net income per diluted share increased 33% to $1.04, including $0.09 per share related to a settlement.
- For full year 2008, Goodrich expects sales to grow 11-13% to $7.1-7.2 billion and net income per diluted share to increase 10-14% to $4.15-$4.30, reflecting continued strong demand in commercial
Goodrich Corporation reported fourth quarter 2007 results with the following highlights:
- Sales grew 12% to $1.668 billion compared to fourth quarter 2006, driven by strong commercial aftermarket sales.
- Segment operating income margin increased from 13.0% to 15.9% over the same period.
- Net income per diluted share increased 33% to $1.04, including $0.09 per share related to a settlement.
- For full year 2008, Goodrich expects sales growth of 11-13% to $7.1-7.2 billion and net income per diluted share growth of 10-14% to $4.15-$4.30, reflecting expected increases in commercial aircraft deliver
Services - GMAC Annual and Fourth Quarter Earnings finance8
GMAC reported full year net income of $2.1 billion in 2006, down from $2.3 billion in 2005. The residential mortgage market experienced a slowdown due to declining home prices and weakness in nonprime credit. Auto finance results were stable despite one-time costs. Insurance reported record earnings through robust underwriting. ResCap results were negatively impacted by $839 million due to homebuilder equity sales and nonprime mortgage market deterioration.
Danaher Corporation announced record results for the second quarter and first half of 2005. Net earnings for the second quarter increased 25.5% compared to 2004, and sales increased 19%. For the first six months, net earnings increased 27.5% and sales increased 19%. The company's president stated that growth from existing businesses accounted for 5.5% sales growth in the quarter and that the company saw broad-based strength across its businesses.
View Summary Manpower Inc. Withdraws Fourth Quarter 2008 Guidance 12/22/2008finance12
Manpower Inc. withdrew its fourth quarter 2008 guidance due to continued declines in the global labor markets and changes in foreign currencies. The company experienced a 20% revenue decline in the two months ended November 30, 2008 compared to the prior year. As a result of the weaker operating environment, Manpower Inc. will take restructuring charges related to employee severance and office closures in the fourth quarter. Despite the economic challenges, the company's liquidity and financial strength remains strong with $675 million in cash and $182 million in net debt as of the end of November.
The document is the 1999 annual report of Manpower Inc. It discusses the company's financial highlights for 1999, including increased systemwide sales, revenues, and operating margin compared to previous years. It summarizes the company's strategies to focus on providing workforce solutions, investing in technology, improving efficiency, and expanding in professional and specialty staffing. The report discusses how these strategies helped drive growth while improving profitability in 1999.
Manpower provided staffing solutions for a variety of clients around the world in 2000. Some key examples include:
1) Manpower Venezuela used a performance-based compensation model to win staffing contracts for three call centers in Venezuela.
2) In Australia, the Defense Force outsourced its military recruitment to Manpower due to their ability to provide a full-service solution.
3) In North Carolina, Manpower's workforce program helped IBM achieve significant contractor staffing cost savings.
This document highlights Manpower's global reach and ability to customize staffing solutions to meet the diverse needs of clients around the world.
The document is Manpower Inc.'s 2001 annual report. It summarizes that in 2001:
- Systemwide sales decreased 5.3% to $11.8 billion due to a weaker global economy and strengthening US dollar.
- Revenues decreased 3.3% and operating profit declined 23.6% as revenue growth slowed but investments continued.
- Earnings per share decreased 27% to $1.62 primarily due to currency exchange impacts. The company remained focused on providing skilled employees and workforce solutions to customers during economic uncertainty.
The document discusses Manpower's performance and strategies during a period of economic uncertainty in 2002. It summarizes that Manpower strengthened its financial position, improved efficiency, expanded services, and increased customer relationships despite challenging market conditions. Manpower emerged stronger and confident in its leadership position. The speed of work increased pressure on companies, but Manpower provided flexibility and quality service to help customers.
This document contains a long list of place names from around the world arranged in no clear order. The places span multiple continents and countries, including locations in France, Italy, Germany, Japan, Canada, Mexico, Argentina and many others.
The document is Manpower Inc.'s 2004 annual report. It discusses Manpower's 57-year history of providing temporary staffing solutions and how it has expanded its services over time. It also discusses how the world of work is constantly changing and how Manpower continues to adapt its solutions to help clients with their HR strategies and market competition. The report features perspectives from clients, including IBM's vice president of global talent discussing how IBM partners with Manpower for just-in-time talent management to source skills globally on demand.
This document is Manpower Inc.'s 2005 annual report. It summarizes the company's financial performance for 2005, noting revenues exceeded $16 billion, a 7.7% increase over 2004. Net income increased 8% to $260 million. It also discusses strategic moves taken in 2005 to expand operations in emerging markets like China and India. Finally, it describes the company's rebranding effort, launching a new logo and tagline - "What do you do?" - to reflect its expanded services beyond temporary staffing.
Manpower Inc. reported record financial results in 2006. Revenues increased 10.8% to $17.6 billion and net earnings increased 53% to $398 million. The company's stock price rose 61% in 2006, outperforming the broader market. Operating profit increased 24% to $532 million due to growth in business and effective cost management across regions. The company has transitioned to focus on providing a wider range of employment services beyond temporary staffing alone. The rebranding launched in 2006 aligned the company's image with this strategic transition and positioned Manpower for continued strong performance.
The document is a Form 8-K filed by The Goodyear Tire & Rubber Company with the SEC on May 22, 2007. It announces that the company entered into an underwriting agreement to sell over 22 million shares of its common stock in a public offering at $33 per share, for total proceeds of over $750 million. The underwriters exercised their option to purchase additional shares. The company's general counsel issued a legality opinion on the shares offering. The proceeds will be used for general corporate purposes.
The Goodyear Tire & Rubber Company issued notices to partially redeem outstanding notes. It will redeem $140 million of its 9% Senior Notes due 2015 at 109% of par value, and $175 million of its 8.625% Senior Notes due 2011 at 108.625% of par value. Both redemptions will occur on June 29, 2007. Goodyear is using proceeds from a recent equity offering of common stock to fund the redemptions, as allowed under provisions permitting redemption of up to 35% of notes with equity offering proceeds.
The document is an SEC filing by The Goodyear Tire & Rubber Company that provides an adjusted Item 6 of their 2006 Annual Report on Form 10-K. The adjustments correct references in certain footnotes to Item 6 from "income/loss from continuing operations" to "net income/loss" as the results included discontinued operations. Item 6 provides selected financial data for Goodyear from 2002-2006, including net sales, income/loss, income/loss per share, total assets, long term debt, and shareholders' equity. Footnotes provide additional details on items affecting results in certain years.
The Rise and Fall of Ponzi Schemes in America.pptxDiana Rose
Ponzi schemes, a notorious form of financial fraud, have plagued America’s investment landscape for decades. Named after Charles Ponzi, who orchestrated one of the most infamous schemes in the early 20th century, these fraudulent operations promise high returns with little or no risk, only to collapse and leave investors with significant losses. This article explores the nature of Ponzi schemes, notable cases in American history, their impact on victims, and measures to prevent falling prey to such scams.
Understanding Ponzi Schemes
A Ponzi scheme is an investment scam where returns are paid to earlier investors using the capital from newer investors, rather than from legitimate profit earned. The scheme relies on a constant influx of new investments to continue paying the promised returns. Eventually, when the flow of new money slows down or stops, the scheme collapses, leaving the majority of investors with substantial financial losses.
Historical Context: Charles Ponzi and His Legacy
Charles Ponzi is the namesake of this deceptive practice. In the 1920s, Ponzi promised investors in Boston a 50% return within 45 days or 100% return in 90 days through arbitrage of international reply coupons. Initially, he paid returns as promised, not from profits, but from the investments of new participants. When his scheme unraveled, it resulted in losses exceeding $20 million (equivalent to about $270 million today).
Notable American Ponzi Schemes
1. Bernie Madoff: Perhaps the most notorious Ponzi scheme in recent history, Bernie Madoff’s fraud involved $65 billion. Madoff, a well-respected figure in the financial industry, promised steady, high returns through a secretive investment strategy. His scheme lasted for decades before collapsing in 2008, devastating thousands of investors, including individuals, charities, and institutional clients.
2. Allen Stanford: Through his company, Stanford Financial Group, Allen Stanford orchestrated a $7 billion Ponzi scheme, luring investors with fraudulent certificates of deposit issued by his offshore bank. Stanford promised high returns and lavish lifestyle benefits to his investors, which ultimately led to a 110-year prison sentence for the financier in 2012.
3. Tom Petters: In a scheme that lasted more than a decade, Tom Petters ran a $3.65 billion Ponzi scheme, using his company, Petters Group Worldwide. He claimed to buy and sell consumer electronics, but in reality, he used new investments to pay off old debts and fund his extravagant lifestyle. Petters was convicted in 2009 and sentenced to 50 years in prison.
4. Eric Dalius and Saivian: Eric Dalius, a prominent figure behind Saivian, a cashback program promising high returns, is under scrutiny for allegedly orchestrating a Ponzi scheme. Saivian enticed investors with promises of up to 20% cash back on everyday purchases. However, investigations suggest that the returns were paid using new investments rather than legitimate profits. The collapse of Saivian l
Monthly Market Risk Update: June 2024 [SlideShare]Commonwealth
Markets rallied in May, with all three major U.S. equity indices up for the month, said Sam Millette, director of fixed income, in his latest Market Risk Update.
For more market updates, subscribe to The Independent Market Observer at https://blog.commonwealth.com/independent-market-observer.
What Lessons Can New Investors Learn from Newman Leech’s Success?Newman Leech
Newman Leech's success in the real estate industry is based on key lessons and principles, offering practical advice for new investors and serving as a blueprint for building a successful career.
13 Jun 24 ILC Retirement Income Summit - slides.pptxILC- UK
ILC's Retirement Income Summit was hosted by M&G and supported by Canada Life. The event brought together key policymakers, influencers and experts to help identify policy priorities for the next Government and ensure more of us have access to a decent income in retirement.
Contributors included:
Jo Blanden, Professor in Economics, University of Surrey
Clive Bolton, CEO, Life Insurance M&G Plc
Jim Boyd, CEO, Equity Release Council
Molly Broome, Economist, Resolution Foundation
Nida Broughton, Co-Director of Economic Policy, Behavioural Insights Team
Jonathan Cribb, Associate Director and Head of Retirement, Savings, and Ageing, Institute for Fiscal Studies
Joanna Elson CBE, Chief Executive Officer, Independent Age
Tom Evans, Managing Director of Retirement, Canada Life
Steve Groves, Chair, Key Retirement Group
Tish Hanifan, Founder and Joint Chair of the Society of Later life Advisers
Sue Lewis, ILC Trustee
Siobhan Lough, Senior Consultant, Hymans Robertson
Mick McAteer, Co-Director, The Financial Inclusion Centre
Stuart McDonald MBE, Head of Longevity and Democratic Insights, LCP
Anusha Mittal, Managing Director, Individual Life and Pensions, M&G Life
Shelley Morris, Senior Project Manager, Living Pension, Living Wage Foundation
Sarah O'Grady, Journalist
Will Sherlock, Head of External Relations, M&G Plc
Daniela Silcock, Head of Policy Research, Pensions Policy Institute
David Sinclair, Chief Executive, ILC
Jordi Skilbeck, Senior Policy Advisor, Pensions and Lifetime Savings Association
Rt Hon Sir Stephen Timms, former Chair, Work & Pensions Committee
Nigel Waterson, ILC Trustee
Jackie Wells, Strategy and Policy Consultant, ILC Strategic Advisory Board
In World Expo 2010 Shanghai – the most visited Expo in the World History
https://www.britannica.com/event/Expo-Shanghai-2010
China’s official organizer of the Expo, CCPIT (China Council for the Promotion of International Trade https://en.ccpit.org/) has chosen Dr. Alyce Su as the Cover Person with Cover Story, in the Expo’s official magazine distributed throughout the Expo, showcasing China’s New Generation of Leaders to the World.
Fabular Frames and the Four Ratio ProblemMajid Iqbal
Digital, interactive art showing the struggle of a society in providing for its present population while also saving planetary resources for future generations. Spread across several frames, the art is actually the rendering of real and speculative data. The stereographic projections change shape in response to prompts and provocations. Visitors interact with the model through speculative statements about how to increase savings across communities, regions, ecosystems and environments. Their fabulations combined with random noise, i.e. factors beyond control, have a dramatic effect on the societal transition. Things get better. Things get worse. The aim is to give visitors a new grasp and feel of the ongoing struggles in democracies around the world.
Stunning art in the small multiples format brings out the spatiotemporal nature of societal transitions, against backdrop issues such as energy, housing, waste, farmland and forest. In each frame we see hopeful and frightful interplays between spending and saving. Problems emerge when one of the two parts of the existential anaglyph rapidly shrinks like Arctic ice, as factors cross thresholds. Ecological wealth and intergenerational equity areFour at stake. Not enough spending could mean economic stress, social unrest and political conflict. Not enough saving and there will be climate breakdown and ‘bankruptcy’. So where does speculative design start and the gambling and betting end? Behind each fabular frame is a four ratio problem. Each ratio reflects the level of sacrifice and self-restraint a society is willing to accept, against promises of prosperity and freedom. Some values seem to stabilise a frame while others cause collapse. Get the ratios right and we can have it all. Get them wrong and things get more desperate.
University of North Carolina at Charlotte degree offer diploma Transcripttscdzuip
办理美国UNCC毕业证书制作北卡大学夏洛特分校假文凭定制Q微168899991做UNCC留信网教留服认证海牙认证改UNCC成绩单GPA做UNCC假学位证假文凭高仿毕业证GRE代考如何申请北卡罗莱纳大学夏洛特分校University of North Carolina at Charlotte degree offer diploma Transcript
A toxic combination of 15 years of low growth, and four decades of high inequality, has left Britain poorer and falling behind its peers. Productivity growth is weak and public investment is low, while wages today are no higher than they were before the financial crisis. Britain needs a new economic strategy to lift itself out of stagnation.
Scotland is in many ways a microcosm of this challenge. It has become a hub for creative industries, is home to several world-class universities and a thriving community of businesses – strengths that need to be harness and leveraged. But it also has high levels of deprivation, with homelessness reaching a record high and nearly half a million people living in very deep poverty last year. Scotland won’t be truly thriving unless it finds ways to ensure that all its inhabitants benefit from growth and investment. This is the central challenge facing policy makers both in Holyrood and Westminster.
What should a new national economic strategy for Scotland include? What would the pursuit of stronger economic growth mean for local, national and UK-wide policy makers? How will economic change affect the jobs we do, the places we live and the businesses we work for? And what are the prospects for cities like Glasgow, and nations like Scotland, in rising to these challenges?
Every business, big or small, deals with outgoing payments. Whether it’s to suppliers for inventory, to employees for salaries, or to vendors for services rendered, keeping track of these expenses is crucial. This is where payment vouchers come in – the unsung heroes of the accounting world.
Economic Risk Factor Update: June 2024 [SlideShare]Commonwealth
May’s reports showed signs of continued economic growth, said Sam Millette, director, fixed income, in his latest Economic Risk Factor Update.
For more market updates, subscribe to The Independent Market Observer at https://blog.commonwealth.com/independent-market-observer.
Madhya Pradesh, the "Heart of India," boasts a rich tapestry of culture and heritage, from ancient dynasties to modern developments. Explore its land records, historical landmarks, and vibrant traditions. From agricultural expanses to urban growth, Madhya Pradesh offers a unique blend of the ancient and modern.
KYC Compliance: A Cornerstone of Global Crypto Regulatory FrameworksAny kyc Account
This presentation explores the pivotal role of KYC compliance in shaping and enforcing global regulations within the dynamic landscape of cryptocurrencies. Dive into the intricate connection between KYC practices and the evolving legal frameworks governing the crypto industry.
Tdasx: Interpreting the 2024 Cryptocurrency Market Funding Trends and Technol...
raytheonQ1 Earnings Release
1. Media Relations
News release
Media Contact: Investor Relations Contact:
Steve Brecken Greg Smith
781-522-5127 781-522-5141
Raytheon Reports Strong First Quarter 2006 Results and Increases Full-year
Guidance for EPS and Operating Cash Flow
First Quarter Highlights
• EPS from continuing operations of $0.64, up 49 percent
• Strong bookings of $5.5 billion, record backlog of $34.7 billion
• Increased full-year guidance for EPS by $0.10 and operating cash flow by
$200 million
• Dividend increased 9 percent, new share repurchase program announced
WALTHAM, Mass., (Apr. 27, 2006) – Raytheon Company (NYSE: RTN) reported first
quarter 2006 income from continuing operations of $289 million or $0.64 per diluted
share compared to $196 million or $0.43 per diluted share in the first quarter 2005. First
quarter 2006 income from continuing operations included an after-tax $14 million gain
($21 million pretax) or $0.03 per diluted share for the sale of the Company’s investment
in Space Imaging. First quarter 2005 income from continuing operations included a $12
million charge or $0.03 per diluted share for a legal settlement. First quarter 2006
income from continuing operations was higher due to improved operating results at the
Company’s Government and Defense businesses and at Raytheon Aircraft Company
(RAC) combined with lower net interest expense and lower non-cash pension expense.
“Our strong earnings and cash flow allow us to increase guidance for the year,” said
William H. Swanson, Raytheon's Chairman and CEO. “Our financial performance in the
first quarter, along with our record backlog, continues to demonstrate our focus on
strong execution throughout the Company.”
1
2. First quarter 2006 net income was $287 million or $0.64 per diluted share compared to
$166 million or $0.36 per diluted share in the first quarter 2005. Net income for the first
quarter of 2005 included a $30 million after-tax loss in discontinued operations or $0.07
per diluted share primarily attributable to an after-tax charge for the settlement of a class
action shareholder lawsuit.
Net sales for the first quarter 2006 were $5.2 billion, up 4 percent from $4.9 billion in the
first quarter 2005. Government and Defense sales for the quarter (after the elimination
of intercompany sales) increased 4 percent to $4.5 billion from $4.3 billion in the first
quarter 2005. RAC sales for the quarter increased 12 percent to $493 million from $442
million in the first quarter 2005.
Operating cash flow from continuing operations for the first quarter 2006 was a positive
$5 million versus an outflow of $274 million for the first quarter 2005. The improvement
in cash flow was driven by higher income as well as a prior year delay in billings and
collections resulting from a financial system implementation. The Company made a
$200 million discretionary cash contribution to its pension plans in the first quarters of
both 2006 and 2005.
During the first quarter 2006, the Company repurchased 2.4 million shares of common
stock for $102 million as part of the Company’s previously announced (December 2004)
$700 million share repurchase program. The Company has repurchased 13.6 million
shares of common stock since the program’s inception for a total of $538 million. As
previously announced (March 2006), the Company’s Board of Directors authorized the
repurchase of up to an additional $750 million of the Company's outstanding common
stock, as well as a 9 percent increase to the Company’s annual dividend, from $0.88 to
$0.96 per share.
Net debt was $3.5 billion at the end of the first quarter 2006 compared with $3.3 billion at
the end of 2005 and $5.1 billion at the end of the first quarter 2005. Net debt is defined
as total debt less cash and cash equivalents.
2
3. Summary Financial Results 1st Quarter %
2006 2005 Change
(in millions, except per share data)
Net Sales $ 5,152 $ 4,944 4%
Total Operating Expenses 4,698 4,567
Operating Income 454 377 20%
Non-operating Expenses 17 81
Income from Cont. Ops. before Taxes $ 437 $ 296 48%
Income from Continuing Operations $ 289 $ 196 47%
Net Income $ 287 $ 166 73%
Diluted EPS from Continuing Operations $ 0.64 $ 0.43 49%
Diluted EPS $ 0.64 $ 0.36 78%
Cash Flow from Continuing Operations $ 5 $ (274)
Bookings and Backlog
Bookings 1st Quarter
2006 2005
(in millions)
Bookings
Government and Defense $ 4,781 $ 4,612
Commercial 686 663
Total Bookings $ 5,467 $ 5,275
Backlog Period ending
03/26/06 12/31/05
(in millions)
Backlog $ 34,690 $ 34,419
Funded Backlog $ 19,499 $ 17,580
The Government and Defense businesses reported first quarter 2006 bookings of $4.8
billion compared to $4.6 billion in the first quarter 2005. RAC reported first quarter 2006
bookings of $500 million compared to $472 million in the first quarter 2005.
The Government and Defense businesses ended the first quarter 2006 with a backlog of
$31.5 billion compared to $31.2 billion at the end of 2005. Raytheon ended the quarter
with a record backlog of $34.7 billion compared to $34.4 billion at the end of 2005.
3
4. Outlook
2006 Financial Outlook Current Prior *
Bookings $22.0B - $23.0B $22.0B - $23.0B
Net Sales $23.1B - $23.6B $23.1B - $23.6B
FAS/CAS Pension Expense $360M $360M
Interest Expense, net $220M - $230M $245M - $255M
Diluted Shares 449M - 451M 449M
EPS from Cont. Ops. $2.55 - $2.65 $2.45 - $2.55
Net Debt $2.4B - $2.6B $2.6B - $2.8B
Operating Cash Flow $1.9B - $2.1B $1.7B - $1.9B
ROIC 8.0% - 8.4% 7.8% - 8.2%
* As of February 2, 2006
The Company has increased full-year 2006 guidance for earnings per share from
continuing operations, operating cash flow, and Return on Invested Capital (ROIC), as
well as improved full-year 2006 guidance for net interest expense. See attachment F for
the Company's calculation and use of ROIC, a non-GAAP financial measure. Charts
containing additional information on the Company’s 2006 guidance are available on the
Company's website at www.raytheon.com.
Segment Results
Integrated Defense Systems
1st Quarter %
2006 2005 Change
(in millions, except margin percent)
Net Sales $ 963 $ 906 6%
Operating Income $ 158 $ 121 31%
Operating Margin 16.4% 13.4%
Integrated Defense Systems (IDS) had first quarter 2006 net sales of $963 million, up 6
percent compared to $906 million in the first quarter 2005, primarily due to growth in
DD(X) (now formally designated DDG 1000) and international programs. IDS recorded
$158 million of operating income compared to $121 million in the first quarter 2005.
4
5. Operating income was higher primarily due to increased sales on international programs
and strong program execution.
During the quarter, IDS booked $363 million for ship integration and detail design for the
U.S. Navy’s DDG 1000 Destroyer. IDS also booked $148 million to provide engineering
services support to the Patriot air and missile defense program for the U.S. Army.
Intelligence and Information Systems
1st Quarter %
2006 2005 Change
(in millions, except margin percent)
Net Sales $ 611 $ 542 13%
Operating Income $ 55 $ 50 10%
Operating Margin 9.0% 9.2%
Intelligence and Information Systems (IIS) had first quarter 2006 net sales of $611
million, up 13 percent compared to $542 million in the first quarter 2005, primarily due to
continued growth in classified programs. IIS recorded $55 million of operating income
compared to $50 million in the first quarter 2005.
During the quarter, IIS booked $220 million on a number of classified contracts. After
the end of the quarter, IIS booked an additional $276 million on a major classified
contract.
Missile Systems
1st Quarter %
2006 2005 Change
(in millions, except margin percent)
Net Sales $ 989 $ 990 N.M.
Operating Income $ 110 $ 105 5%
Operating Margin 11.1% 10.6%
Missile Systems (MS) had first quarter 2006 net sales of $989 million compared to $990
million in the first quarter 2005. MS recorded $110 million of operating income
compared to $105 million in the first quarter 2005.
5
6. During the quarter, MS booked $346 million for the production of 473 Block IV Tactical
Tomahawk cruise missiles for the U.S. and United Kingdom navies. MS also booked
$140 million for the production of Standard Missile-2 (SM-2) for the U.S. Navy.
Network Centric Systems
1st Quarter %
2006 2005 Change
(in millions, except margin percent)
Net Sales $ 791 $ 762 4%
Operating Income $ 84 $ 79 6%
Operating Margin 10.6% 10.4%
Network Centric Systems (NCS) had first quarter 2006 net sales of $791 million, up 4
percent compared to $762 million in the first quarter 2005, primarily due to growth in the
Combat Systems business area. NCS recorded operating income of $84 million
compared to $79 million in the first quarter 2005.
During the quarter, NCS booked $102 million to provide a Perimeter Intrusion Detection
System (PIDS) for the Port Authority of New York and New Jersey to safeguard the
region’s four airports.
Space and Airborne Systems
1st Quarter %
2006 2005 Change
(in millions, except margin percent)
Net Sales $ 1,018 $ 957 6%
Operating Income $ 145 $ 155 -6%
Operating Margin 14.2% 16.2%
Space and Airborne Systems (SAS) had first quarter 2006 net sales of $1,018 million, up
6 percent compared to $957 million in the first quarter 2005, primarily due to growth in
the Advanced Targeting Forward-Looking Infrared (ATFLIR) program. SAS recorded
$145 million of operating income compared to $155 million in the first quarter 2005.
6
7. Operating income was lower primarily due to favorable program profit and cost
adjustments recorded in the prior year.
During the quarter, SAS booked $535 million on a number of classified contracts.
Technical Services
1st Quarter %
2006 2005 Change
(in millions, except margin percent)
Net Sales $ 460 $ 467 -1%
Operating Income $ 32 $ 31 3%
Operating Margin 7.0% 6.6%
Technical Services (TS) had first quarter 2006 net sales of $460 million compared to
$467 million in the first quarter 2005. TS recorded operating income of $32 million in the
first quarter of 2006 compared to $31 million in the first quarter 2005.
During the quarter, TS was downselected for a contract from the Defense Threat
Reduction Agency to eliminate three weapons storage areas in the Ukraine under the
Cooperative Threat Reduction Program. This contract is expected to be booked in the
second quarter.
Aircraft
1st Quarter %
2006 2005 Change
(in millions, except margin percent)
Net Sales $ 493 $ 442 12%
Operating Income $ 16 $ 2 700%
Operating Margin 3.2% 0.5%
Raytheon Aircraft Company (RAC) had first quarter 2006 net sales of $493 million, up 12
percent compared to $442 million in the first quarter 2005, primarily due to higher new
aircraft deliveries. RAC recorded operating income of $16 million compared to $2 million
7
8. in the first quarter 2005. Operating income was higher due to new aircraft deliveries and
mix, and continued improved operating performance.
Other
Net sales for the Other segment in the first quarter 2006 were $190 million compared to
$192 million in the first quarter 2005. The segment recorded an operating loss of $13
million in the first quarter 2006 compared to an operating loss of $21 million in the first
quarter 2005.
Discontinued Operations
During the quarter, the Company recorded an after-tax loss from discontinued
operations of $2 million related to its former engineering and construction and Aircraft
Integration Systems businesses.
Raytheon Company (NYSE: RTN), with 2005 sales of $21.9 billion, is an industry leader
in defense and government electronics, space, information technology, technical
services, and business and special mission aircraft. With headquarters in Waltham,
Mass., Raytheon employs 80,000 people worldwide.
Disclosure Regarding Forward-looking Statements
This release and the attachments contain forward-looking statements, including
information regarding the Company’s 2006 financial outlook, future plans, objectives,
business prospects and anticipated financial performance. These forward-looking
statements are not statements of historical facts and represent only the Company’s
current expectations regarding such matters. These statements inherently involve a
wide range of known and unknown risks and uncertainties. The Company’s actual
actions and results could differ materially from what is expressed or implied by these
statements. Specific factors that could cause such a difference include, but are not
limited to: risks associated with the Company’s U.S. government sales, including
changes or shifts in defense spending, uncertain funding of programs, potential
termination of contracts, and difficulties in contract performance; the ability to procure
new contracts; the risks of conducting business in foreign countries; the ability to comply
with extensive governmental regulation, including import and export policies and
procurement, aircraft manufacturing and other regulations; the impact of competition; the
ability to develop products and technologies; the risk of cost overruns, particularly for the
Company’s fixed-price contracts; dependence on component availability, subcontractor
performance and key suppliers; risks of a negative government audit; the use of
accounting estimates in the Company’s financial statements; the potential impairment of
8
9. the Company’s goodwill; risks associated with the general aviation, commuter and
fractional ownership aircraft markets; accidents involving the Company’s aircraft; the
outcome of contingencies and litigation matters, including government investigations; the
ability to recruit and retain qualified personnel; risks associated with acquisitions, joint
ventures and other business arrangements; the impact of changes in the Company’s
credit ratings; and other factors as may be detailed from time to time in the Company’s
public announcements and Securities and Exchange Commission filings. The Company
undertakes no obligation to make any revisions to the forward-looking statements
contained in this release and the attachments or to update them to reflect events or
circumstances occurring after the date of this release.
Conference Call on the First Quarter 2006 Financial Results
Raytheon’s financial results conference call will be Thursday, April 27, 2006 at 9 a.m.
ET. Participants will be William H. Swanson, Chairman and CEO, David C. Wajsgras,
senior vice president and CFO, and other Company executives.
The dial-in number for the conference call will be (866) 800 - 8651. The conference call
will also be audiocast on the Internet at www.raytheon.com. Individuals may listen to the
call and download charts that will be used during the call. These charts will be available
for printing prior to the call.
Interested parties are urged to check the website ahead of time to ensure their
computers are configured for the audio stream. Instructions for obtaining the free
required downloadable software are posted on the site.
###
9
10. Attachment A
Raytheon Company
Financial Information
First Quarter 2006
(In millions except per share amounts) Three Months Ended
26-Mar-06 27-Mar-05
Net sales $ 5,152 $ 4,944
Cost of sales 4,218 4,118
Administrative and selling expenses 361 349
Research and development expenses 119 100
Total operating expenses 4,698 4,567
Operating income 454 377
Interest expense 68 76
Interest income (24) (12)
Other (income) expense, net (27) 17
Non-operating expense, net 17 81
Income from continuing operations before taxes 437 296
Federal and foreign income taxes 148 100
Income from continuing operations 289 196
Loss from discontinued operations, net of tax (2) (30)
Net income $ 287 $ 166
Earnings per share from continuing operations
Basic $ 0.65 $ 0.43
Diluted $ 0.64 $ 0.43
Loss per share from discontinued operations
Basic $ - $ (0.07)
Diluted $ - $ (0.07)
Earnings per share
Basic $ 0.65 $ 0.37
Diluted $ 0.64 $ 0.36
Average shares outstanding
Basic 442.3 450.6
Diluted 448.8 456.6
4/26/20065:14 PM
11. Attachment B
Raytheon Company
Segment Information
First Quarter 2006
(In millions)
Operating Income
Net Sales Operating Income As a Percent of Sales
Three Months Ended Three Months Ended Three Months Ended
26-Mar-06 27-Mar-05 26-Mar-06 27-Mar-05 26-Mar-06 27-Mar-05
Integrated Defense Systems $ 963 $ 906 $ 158 $ 121 16.4% 13.4%
Intelligence and Information Systems 611 542 55 50 9.0% 9.2%
Missile Systems 989 990 110 105 11.1% 10.6%
Network Centric Systems 791 762 84 79 10.6% 10.4%
Space and Airborne Systems 1,018 957 145 155 14.2% 16.2%
Technical Services 460 467 32 31 7.0% 6.6%
Aircraft 493 442 16 2 3.2% 0.5%
Other 190 192 (13) (21) -6.8% -10.9%
FAS/CAS Pension Adjustment - - (90) (116)
Corporate and Eliminations (363) (314) (43) (29)
Total $ 5,152 $ 4,944 $ 454 $ 377 8.8% 7.6%
4/26/20065:14 PM
12. Attachment C
Raytheon Company
Other Information
First Quarter 2006
Funded
Backlog Backlog
(In millions) (In millions)
26-Mar-06 31-Dec-05 26-Mar-06 31-Dec-05
Integrated Defense Systems $ 7,911 $ 8,010 $ 3,143 $ 3,009
Intelligence and Information Systems 3,728 4,077 780 642
Missile Systems 8,250 8,040 5,032 4,443
Network Centric Systems 4,484 4,307 3,207 2,839
Space and Airborne Systems 5,637 5,220 3,236 2,851
Technical Services 1,501 1,594 922 916
Aircraft 2,900 2,891 2,900 2,600
Other 279 280 279 280
$ 34,690 $ 34,419 $ 19,499 $ 17,580
Government and Defense businesses $ 31,511 $ 31,248 $ 16,320 $ 14,700
Bookings
(In millions)
Three Months Ended
26-Mar-06 27-Mar-05
Government and Defense businesses $ 4,781 $ 4,612
Commercial businesses 686 663
$ 5,467 $ 5,275
New Aircraft Deliveries (Units)
Three Months Ended
26-Mar-06 27-Mar-05
Hawker 800XP 8 6
Premier 4 3
Hawker 400XP 10 4
King Air 22 14
Pistons 24 13
T-6A 15 15
Total 83 55
New Aircraft Bookings (Units)
Three Months Ended
26-Mar-06 27-Mar-05
Hawker 4000 - 1
Hawker 800XP 13 7
Premier 4 2
Hawker 400XP 5 2
King Air 23 22
Pistons 12 31
T-6A - 6
Total 57 71
4/26/20065:14 PM
13. Attachment D
Raytheon Company
Preliminary Financial Information
First Quarter 2006
(In millions)
Balance sheets
26-Mar-06 31-Dec-05
Assets
Cash and cash equivalents $ 944 $ 1,202
Accounts receivable, less allowance for doubtful accounts 379 425
Contracts in process 3,686 3,469
Inventories 1,951 1,722
Deferred federal and foreign income taxes 408 435
Prepaid expenses and other current assets 260 314
Total current assets 7,628 7,567
Property, plant and equipment, net 2,636 2,675
Goodwill 11,586 11,554
Other assets, net 2,707 2,585
Total assets $ 24,557 $ 24,381
Liabilities and Stockholders' Equity
Notes payable and current portion of long-term debt $ 48 $ 79
Subordinated notes payable 408 408
Advance payments and billings in excess of costs incurred 1,970 2,012
Accounts payable 1,058 962
Accrued salaries and wages 807 987
Other accrued expenses 1,413 1,403
Liabilities from discontinued operations 27 49
Total current liabilities 5,731 5,900
Accrued retiree benefits and other long-term liabilities 3,648 3,559
Deferred federal and foreign income taxes 206 125
Long-term debt 3,962 3,969
Minority interest 132 119
Stockholders' equity 10,878 10,709
Total liabilities and stockholders' equity $ 24,557 $ 24,381
4/26/20065:14 PM
14. Attachment E
Raytheon Company
Preliminary Cash Flow Information
First Quarter 2006
(In millions)
Cash flow information
Three Months Ended
26-Mar-06 27-Mar-05
Net income $ 287 $ 166
Depreciation 88 88
Amortization 23 20
Working capital (473) (588)
Discontinued operations (25) (3)
Net activity in financing receivables 69 45
Other 11 (5)
Net operating cash flow (20) (277)
Capital spending (43) (48)
Internal use software spending (5) (16)
Acquisitions (47) (60)
Investment activity and divestitures 22 7
Dividends (98) (90)
Repurchase of common stock (102) (53)
Debt (repayments) borrowings (31) 422
Other 66 16
Total cash flow $ (258) $ (99)
4/26/20065:14 PM
15. Attachment F
Raytheon Company
Non-GAAP Financial Measures
First Quarter 2006
Return on Invested Capital (ROIC) is a quot;non-GAAPquot; financial measure under SEC regulations. The Company
defines ROIC as income from continuing operations plus after-tax net interest expense plus one-third of
operating lease expense after-tax (estimate of interest portion of the operating lease expense), divided by
average invested capital after capitalizing operating leases (operating lease expense times a multiplier of 8) and
adding financial guarantees. ROIC is not a measure of financial performance under generally accepted accounting
principles (GAAP) and may not be defined and calculated by other companies in the same manner. ROIC should
be considered supplemental to and not a substitute for financial information prepared in accordance with GAAP.
The Company uses ROIC to make the most efficient and effective use of capital and as an element of management
incentive compensation.
Return on Invested Capital
Current Guidance
(In millions)
Low end of range High end of range
Income from Continuing Operations
Net Interest Expense, after-tax* Combined Combined
Lease Expense, after-tax*
Return $ 1,365 $ 1,410
Net Debt **
Equity** Combined Combined
Lease Expense x 8 plus Financial Guarantees**
Invested Capital $ 17,000 $ 16,800
ROIC 8.0% 8.4%
* effective tax rate of 33.6%
** two-point average
4/26/20065:14 PM