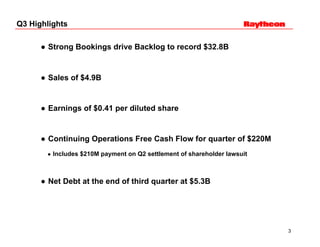
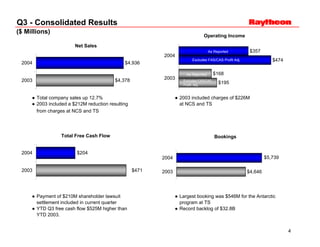
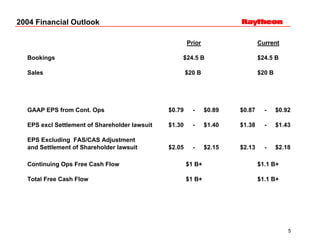
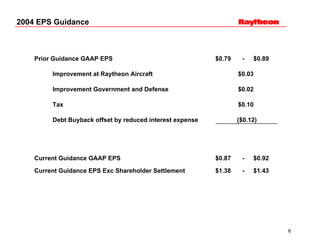
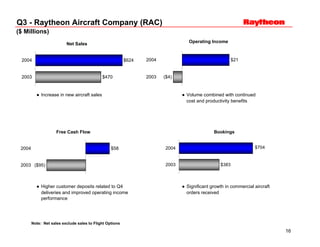
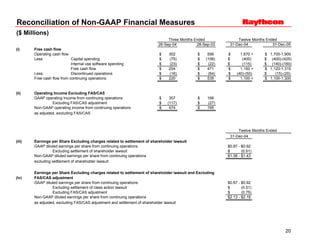
- Raytheon reported Q3 sales of $4.9 billion, up 12.7% from 2003, and earnings of $0.41 per share.
- Backlog reached a record $32.8 billion driven by strong bookings of $5.7 billion in Q3.
- Free cash flow for Q3 was $204 million including a $210 million payment for the settlement of a shareholder lawsuit.
- Guidance for 2004 was increased for GAAP EPS to $0.87-$0.92 and excludes the settlement payment.
How Automation is Driving Efficiency Through the Last Mile of Reporting
Β
Raytheon Q3 Earnings Report Summary
1. Raytheon Company
Third Quarter Earnings
October 28, 2004
Dial In Number
800-265-0241 Domestic
617-847-8704 International
Passcode: 75431896
Replay Number
888-286-8010 Domestic
617-801-6888 International
Reservation Number: 21379326
Available through November 3, 2004
2. Forward-Looking Statements
This presentation contains forward-looking statements and projections. The Company cautions
readers that such forward-looking statements are based on assumptions that the Company
believes are reasonable, but are subject to a wide range of risks, and actual results may differ
materially. The Company expressly disclaims any current intention to provide updates to
forward-looking statements, and the estimates and assumptions associated with them, after the
date of this presentation. Important factors that could cause actual results to differ include, but
are not limited to: the ability to obtain or the timing of obtaining future government awards; the
availability of government funding; changes in government or customer priorities due to
program reviews or revisions to strategic objectives; difficulties in developing and producing
operationally advanced technology systems; termination of government contracts; program
performance, including resolution of claims, timing of contract payments; the performance of
critical subcontractors; government import and export policies and other government
regulations; the ultimate resolution of contingencies and legal matters, including government
investigations; the agreement to settle the shareholder class action lawsuit pending in federal
court in Massachusetts has not received final approval by the court; the ultimate resolution of
insurance coverage for the shareholder litigation; the effect of market conditions, particularly in
relation to the general aviation, commuter and fractional aircraft markets; cost growth risks
inherent with large long-term fixed price contracts; conflicts with other investors in joint
ventures and less than wholly-owned businesses; and risks associated with outstanding letters
of credit, surety bonds, guarantees and similar agreements related to a number of contracts
and leases of our former engineering and construction business unit. Further information
regarding the factors that could cause actual results to differ materially from the projected
results can be found in the Company's filings with the Securities and Exchange Commission,
including the Company's Annual Report on Form 10-K for the year ended December 31, 2003.
2
3. Q3 Highlights
β Strong Bookings drive Backlog to record $32.8B
β Sales of $4.9B
β Earnings of $0.41 per diluted share
β Continuing Operations Free Cash Flow for quarter of $220M
β Includes $210M payment on Q2 settlement of shareholder lawsuit
β Net Debt at the end of third quarter at $5.3B
3
4. Q3 - Consolidated Results
($ Millions)
Operating Income
Net Sales
$357
As Reported
2004
$474
Excludes FAS/CAS Profit Adj.
2004 $4,936
$168
As Reported
2003
$4,378
2003 Excludes FAS/CAS
$195
Profit Adj.
β Total company sales up 12.7% β 2003 included charges of $226M
β 2003 included a $212M reduction resulting at NCS and TS
from charges at NCS and TS
Total Free Cash Flow Bookings
2004 $204
$5,739
2004
2003 $471 2003 $4,646
β Payment of $210M shareholder lawsuit β Largest booking was $546M for the Antarctic
settlement included in current quarter program at TS
β YTD Q3 free cash flow $525M higher than β Record backlog of $32.8B
YTD 2003.
4
5. 2004 Financial Outlook
Prior Current
Bookings $24.5 B $24.5 B
Sales $20 B $20 B
GAAP EPS from Cont. Ops $0.79 - $0.89 $0.87 - $0.92
EPS excl Settlement of Shareholder lawsuit $1.30 - $1.40 $1.38 - $1.43
EPS Excluding FAS/CAS Adjustment
and Settlement of Shareholder lawsuit $2.05 - $2.15 $2.13 - $2.18
Continuing Ops Free Cash Flow $1 B+ $1.1 B+
Total Free Cash Flow $1 B+ $1.1 B+
5
6. 2004 EPS Guidance
Prior Guidance GAAP EPS $0.79 - $0.89
Improvement at Raytheon Aircraft $0.03
Improvement Government and Defense $0.02
Tax $0.10
Debt Buyback offset by reduced interest expense ($0.12)
Current Guidance GAAP EPS $0.87 - $0.92
Current Guidance EPS Exc Shareholder Settlement $1.38 - $1.43
6
7. 2005 Guidance
Sales
Government and Defense $19.6 B - $20.1 B
Elimination of intercompany sales ($1.6 B)
Government and Defense after elims $18.0 B - $18.5 B
Raytheon Aircraft $2.6 B - $2.8 B
Other $0.7 B - $0.8 B
Total Company $21.5 B - $22.0 B
GAAP EPS* $1.80 - $1.90
Free Cash Flow $1.1 B - $1.3 B
* Does not include any change in Pension assumptions from previously disclosed guidance.
Pension will be updated at year-end 2004.
7
8. 2005 FAS/CAS Pension Adjustment
Approximate 2005 FAS/CAS Adjustment ($M)
Estimated Return*
Estimated
Discount
Rate*
0% 3% 5% 8.75% 10.00%
5.75% 523 509 500 483 477
6.00% 483 469 460 443 437
Current
assumption
404
6.25% 443 429 420 397
6.50% 405 391 382 365 359
* Pension expense for 2005 is based upon discount rates as of 12/31/2004 and asset returns for the
calendar year 2004. 2005 Pension expense will be updated at year end 2004, once actual discount
rates and asset returns for 2004 are determined.
Note: The purpose of this chart is to indicate the range of outcomes of the 2005 FAS/CAS Pension adjustment,
based upon the 2004 discount rate and return on assets.
8
10. Q3 - Integrated Defense Systems (IDS)
($ Millions)
Operating Income
Net Sales
2004 $100
2004 $833
2003 $82
2003 $718
β Growth of 16% driven by DD(X) and β Volume related
Cobra Judy
Bookings
Free Cash Flow
2004 $687
2004 $80
2003 $390
2003 $36
β Includes $207M for the definitization of
Cobra Judy and $99M for the definitization
of JLENS Spiral 2 Development
Note: Net sales include intercompany sales
10
11. Q3 - Intelligence & Information Systems (IIS)
($ Millions)
Operating Income
Net Sales
2004 $51
2004 $567
2003 $54
2003 $533
β Growth driven by DCGS and classified
programs
Free Cash Flow Bookings
2004 $71 $641
2004
2003 $43 $743
2003
β Includes $345M of classified bookings
Note: Net sales include intercompany sales
11
12. Q3 - Missile Systems (MS)
($ Millions)
Operating Income
Net Sales
2004 $109
2004 $928
2003 $111
2003 $905
Free Cash Flow
Bookings
$28
2004 $1,111
2004
2003 $196 2003 $923
β β
β YTD Q3 free cash flow over $300M higher β Includes $411M for Standard Missile-6
than YTD 2003. contract
β Includes $287M for next-generation Block IV
Tomahawk Cruise Missile
β Includes $144M for AMRAAM for the U.K.
Ministry of Defence
Note: Net sales include intercompany sales
12
13. Q3 - Network Centric Systems (NCS)
($ Millions)
Net Sales Operating Income
2004 $777 2004 $65
2003 ($138)
2003 $556
β 2003 included a sales reduction of $178M β 2003 included $187M of charges
related to charges taken in the quarter
Free Cash Flow Bookings
2004 $861
$140
2004
$636
2003
2003 $111
β Includes $212M on the Future Combat
Systems GSI program
Note: Net sales include intercompany sales
13
14. Q3 - Space and Airborne Systems (SAS)
($ Millions)
Net Sales Operating Income
$929
2004 2004 $138
$131
2003
2003 $930
β Increase on international programs
Bookings
Free Cash Flow
$635
2004
2004 $50
2003 $1,072
2003 $153
β 2003 included a $64M advance payment on an β Includes $195M on the Radar Modernization
international order program for the B-2 bomber fleet
β Includes $120M of classified bookings
Note: Net sales include intercompany sales
14
15. Q3 - Technical Services (TS)
($ Millions)
Net Sales Operating Income
2004 $512 2004 $38
2003 $447 2003 ($2)
β 2003 included a sales reduction β 2003 included $39M of charges
of $34M related to charges taken in the
quarter
Bookings
Free Cash Flow
$837
2004
2004 $22
2003 $36 2003 $328
β Includes $546M for the Antarctic
program
Note: Net sales include intercompany sales
15
16. Q3 - Raytheon Aircraft Company (RAC)
($ Millions)
Operating Income
Net Sales
2004 $21
2004 $624
2003 ($4)
2003 $470
β Increase in new aircraft sales β Volume combined with continued
cost and productivity benefits
Free Cash Flow Bookings
$704
2004
2004 $58
2003 $383
2003 ($95)
β Higher customer deposits related to Q4 β Significant growth in commercial aircraft
deliveries and improved operating income orders received
performance
Note: Net sales exclude sales to Flight Options
16
17. Q3 - Other
($ Millions)
Operating Income
Net Sales
2004 ($7)
2004 $164
2003 $191 2003 ($5)
17
18. Installments Due on Long-Term Debt and Subordinated Notes
Payable
($ Millions)
As of Dec As of June As of Sept 26, Expected as of
Year 31, 2003 27, 2004 2004 28 October*
2005 $ 1,053 $ 819 $ 809 $ 509
2006 1,091 680 657 417
2007 1,165 1,134 1,074 674
2008 545 519 486 311
2009 1 1 1 1
Thereafter 3,570 3,394 3,315 3,190
Total $ 7,425 $ 6,547 $ 6,342 $ 5,102
* Subject to completion of tender
18
19. Non-GAAP Financial Measures
The following measures are considered quot;non-GAAPquot; financial measures under SEC guidelines:
(i) Free cash flow - Operating cash flow less capital spending and internal use software spending.
(ii) Earnings per share from continuing operations excluding the effect of charges related to the settlement of
the class action lawsuit.
(iii) Operating Income Excluding the FAS/CAS Adjustment - Operating income adjusted for the non-cash
FAS/CAS pension amount.*
(iv) Earnings per Share Excluding the FAS/CAS pension Adjustment* and settlement of shareholder lawsuit.
* The FAS/CAS pension adjustment is the difference between SFAS No. 87 (FAS) pension expense or income and the Cost
Accounting Standards (CAS) (the standards that prescribe the allocation to and recovery of pension costs on U.S.
government contracts), pension expenses.
The Company uses these non-GAAP financial measures to facilitate management's internal comparisons to the
Company's historical operating results, to competitors' operating results, and to provide greater transparency to investors
of supplemental information used by management in its financial and operational decision-making.
The Company uses certain of these non-GAAP financial measures to evaluate its operating performance and to determine
management incentive compensation. The Company also uses non-GAAP financial measures which exclude certain
charges and credits because it believes that such items are not indicative of its core operating results, are not indicative
of trends, and do not provide meaningful comparisons with other reporting periods.
19
20. Reconciliation of Non-GAAP Financial Measures
($ Millions)
Three Months Ended Twelve Months Ended
26-Sep-04 28-Sep-03 31-Dec-04 31-Dec-05
(i) Free cash flow
Operating cash flow $ 302 $ 599 $ 1,670 + $ 1,700-1,900
Less: Capital spending $ (75) $ (106) $ (400) $ (400)-(425)
Internal use software spending $ (23) $ (22) $ (115) $ (140)-(160)
Free cash flow $ 204 $ 471 $ 1,150 + $ 1,120-1,315
Less: Discontinued operations $ (16) $ (64) $ (40)-(50) $ (15)-(20)
Free cash flow from continuing operations $ 220 $ 535 $ 1,100 + $ 1,100-1,300
(ii) Operating Income Excluding FAS/CAS
GAAP operating income from continuing operations $ 357 $ 168
Excluding FAS/CAS adjustment $ (117) $ (27)
Non-GAAP operating income from continuing operations $ 474 $ 195
as adjusted, excluding FAS/CAS
Twelve Months Ended
31-Dec-04
(iii) Earnings per Share Excluding charges related to settlement of shareholder lawsuit
GAAP diluted earnings per share from continuing operations $0.87 - $0.92
Excluding settlement of shareholder lawsuit $ (0.51)
Non-GAAP diluted earnings per share from continuing operations $1.38 - $1.43
excluding settlement of shareholder lawsuit
Earnings per Share Excluding charges related to settlement of shareholder lawsuit and Excluding
(iv) FAS/CAS adjustment
GAAP diluted earnings per share from continuing operations $0.87 - $0.92
Excluding settlement of class action lawsuit $ (0.51)
Excluding FAS/CAS adjustment $ (0.75)
Non-GAAP diluted earnings per share from continuing operations $2.13 - $2.18
as adjusted, excluding FAS/CAS adjustment and settlement of shareholder lawsuit
20