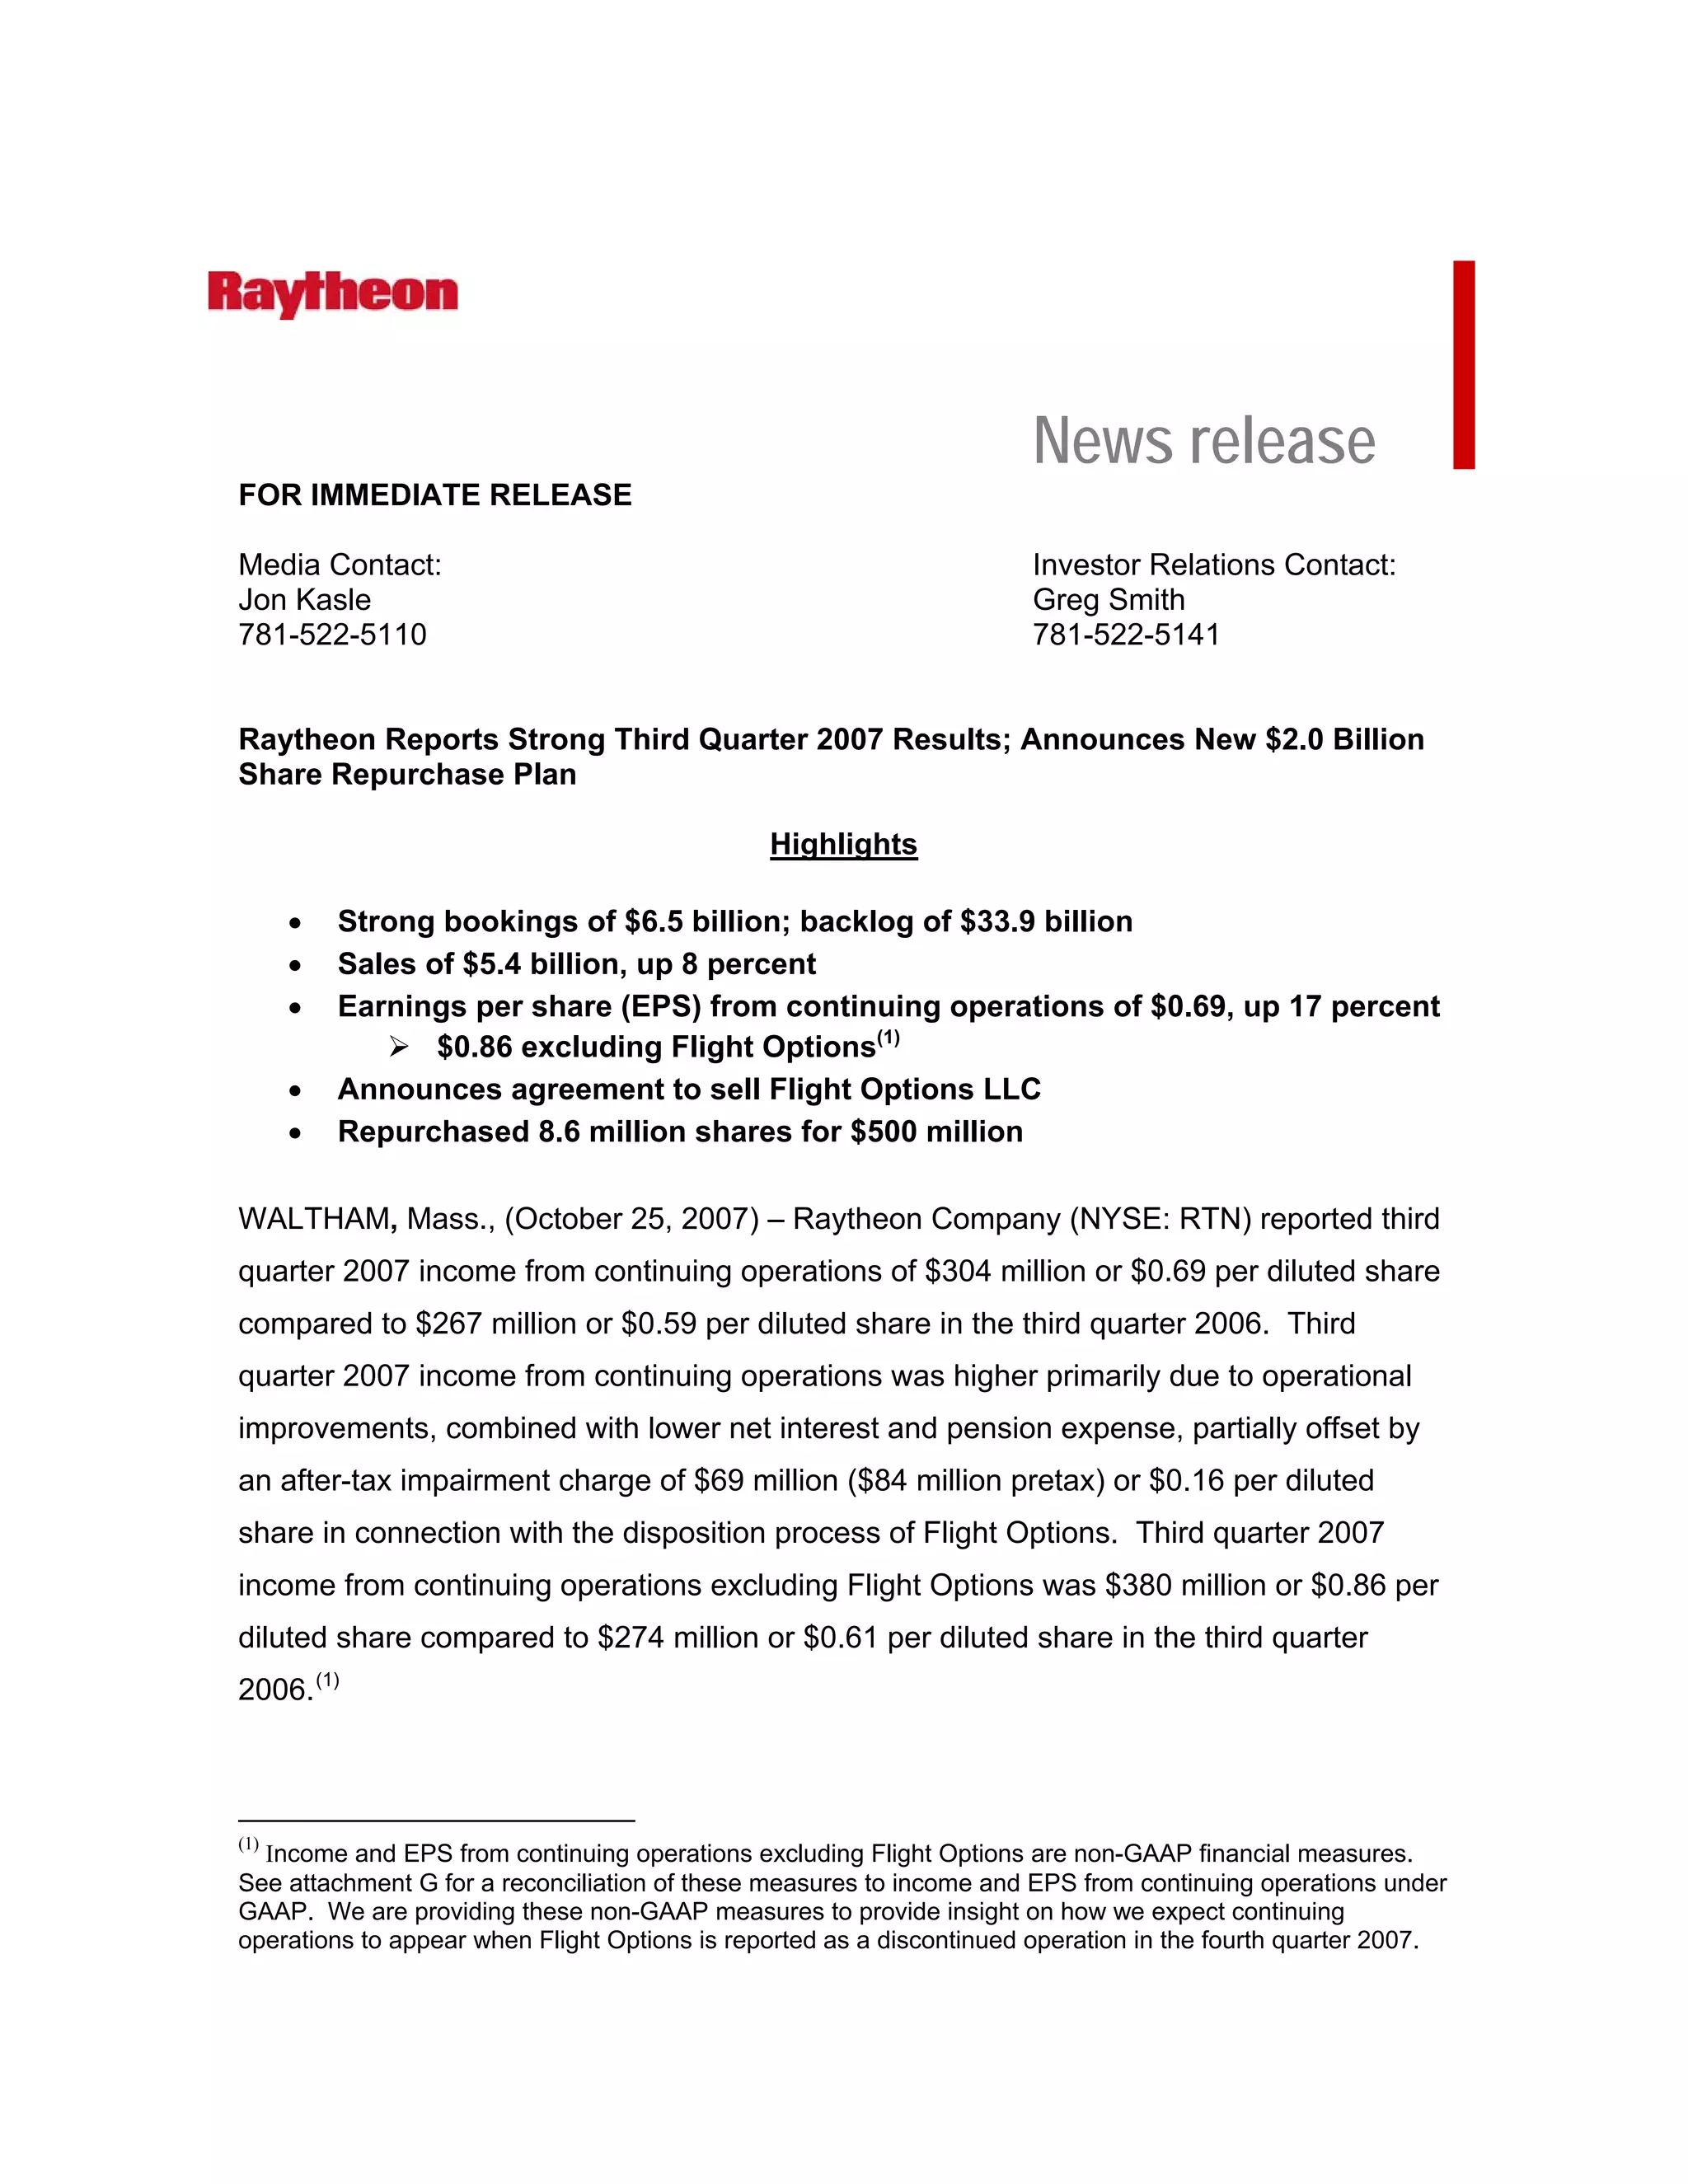
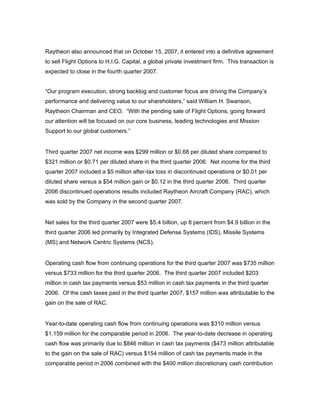
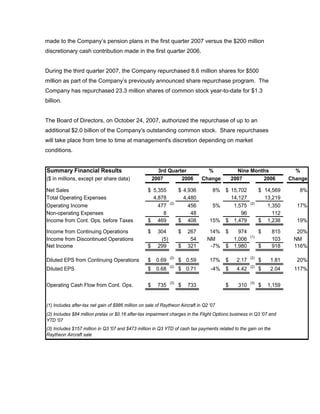
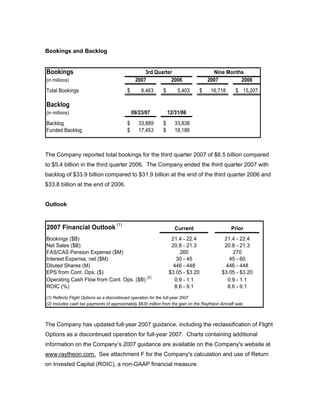
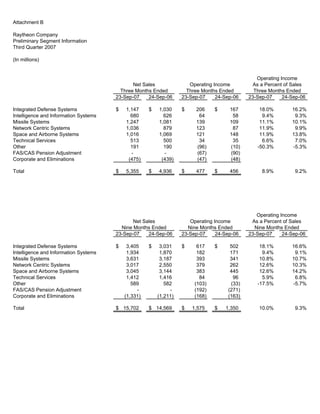
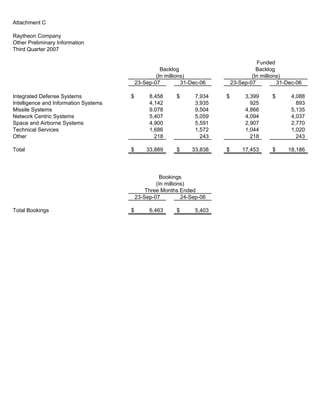
Raytheon reported strong third quarter 2007 results with bookings of $6.5 billion and sales of $5.4 billion, up 8% from the prior year. Earnings per share from continuing operations were $0.69, up 17% year-over-year. Raytheon also announced a new $2 billion share repurchase program and the pending sale of its Flight Options subsidiary. Segment results were positive across Integrated Defense Systems, Missile Systems, Network Centric Systems and Intelligence and Information Systems on higher sales and margins.
Raytheon reported strong financial results for the fourth quarter and full year of 2007. Quarterly sales increased 8% to $6 billion and income from continuing operations was up 84% to $634 million. For the full year, sales rose 8% to $21.3 billion while income from continuing operations grew 43% to $1.7 billion. Raytheon also increased its bookings guidance for 2008 based on record backlog of $36.6 billion in the fourth quarter.
Raytheon reported strong financial results for Q3 2006, with EPS up 41% and bookings of $6.1 billion. The company increased full-year 2006 guidance for EPS, bookings, operating cash flow and ROIC. Segments such as IDS, MS and RAC saw higher sales and improved operating performance compared to Q3 2005. Raytheon also provided initial guidance for 2007 with projected continued growth.
- Raytheon reported strong second quarter 2007 results with EPS from continuing operations up 30% and sales up 9%.
- They completed the sale of Raytheon Aircraft Company, resulting in $2.4 billion in after-tax proceeds.
- For the full year, Raytheon increased guidance for EPS, bookings, and return on invested capital.
- Segment results were positive with Integrated Defense Systems sales up 12% and operating income up 20% compared to the second quarter of 2006.
Raytheon reported strong financial results for the third quarter of 2008, with sales up 12% and earnings per share up 17%. The company increased its full-year earnings guidance and announced a new $2 billion share repurchase plan. All of Raytheon's business segments experienced sales growth in the quarter.
Raytheon reported strong financial results for the first quarter of 2007, with sales up 6% to $4.9 billion and operating income up 18% to $510 million compared to the first quarter of 2006. Earnings per share from continuing operations were up 13% to $0.69. The company also achieved record backlog of $33.9 billion and solid bookings of $5.3 billion in the quarter. Raytheon reaffirmed its full-year 2007 financial outlook and announced it had initiated a $1 billion debt redemption following the completion of the sale of its aircraft unit Raytheon Aircraft Company.
Raytheon reported strong financial results for the second quarter of 2006, with earnings per share up 35% and sales up 6%. The company increased its full-year guidance for earnings per share, operating cash flow, and return on invested capital. Raytheon also announced its intention to explore strategic alternatives for its Raytheon Aircraft Company business unit, including a potential sale. Segment results were positive across most business units, with higher sales, bookings, and operating income compared to the second quarter of 2005.
Raytheon reported strong financial results for the fourth quarter and full year 2006. Quarterly sales increased 12% to $5.7 billion due to growth at Integrated Defense Systems, Missile Systems, and Network Centric Systems. Earnings per share from continuing operations increased 27% to $0.65 for the quarter. For the full year, sales increased 7% to $20.3 billion and earnings per share from continuing operations increased 37% to $2.46. Raytheon also provided guidance for 2007, forecasting earnings per share from continuing operations between $2.85 to $3.00 on sales between $21.4 to $21.9 billion.
Raytheon reported strong financial results for the first quarter of 2006. Key highlights included earnings per share increasing 49% to $0.64, record backlog of $34.7 billion, and increased full-year guidance for EPS and operating cash flow. Segment results were positive across all business units. For the full year, Raytheon increased EPS guidance to $2.55-$2.65 and operating cash flow guidance to $1.9-$2.1 billion.
Raytheon reported strong financial results for Q2 2008, with sales up 11% and EPS up 27%. All business segments saw sales growth. Raytheon increased full-year guidance for sales, EPS, operating cash flow and return on invested capital. The company also reported solid bookings of $6 billion for Q2 and a backlog of $37.5 billion.
hess 01/30/2008 Estimated Results for the Fourth Quarter of 2007finance8
Hess Corporation reported its estimated results for the fourth quarter of 2007. Key highlights include:
- Net income was $510 million compared to $359 million in the fourth quarter of 2006.
- Oil and gas production increased to 390,000 barrels per day, up from 366,000 in the fourth quarter of 2006.
- Reserve replacement was 167% in 2007 and reserve life increased to 9.5 years.
- Exploration and Production earnings were $583 million, up from $350 million in the fourth quarter of 2006.
Raytheon Reports 2004 First Quarter Resultsfinance12
Raytheon reported first quarter earnings for 2004. Revenue increased 11% year-over-year to $4.676 billion, driven by double-digit growth at IDS, IIS, and SAS. Operating income increased 9% to $372 million excluding pension adjustments. Strong bookings resulted in a record backlog of $31.2 billion. The company reiterated its full-year guidance for revenue over $20 billion, GAAP EPS from continuing operations of $1.30-1.40, and free cash flow over $1 billion.
Burlington Northern Santa Fe Corporation reported record quarterly and annual earnings in 2006. For the fourth quarter, earnings per share increased 26% compared to the previous year. Freight revenues increased 9% to $3.77 billion due to a 4% rise in volume. Operating income rose 18% to $942 million and the operating ratio improved to 75.0%. For the full year 2006, earnings per share increased 27% and the company exceeded $1 billion in free cash flow before dividends.
Bank of America reported record first quarter 2006 earnings of $5 billion, up 14% from the same period in 2005. Net income grew 1% excluding merger charges. Total revenue increased 10% driven by a 55% rise in market sensitive revenue and 5% growth in other revenue. Expenses grew 5% while operating leverage was positive at 5%. The financial results reflected strong performance across global consumer and small business banking and card services.
- Bank of America reported third quarter 2006 results with total revenue of $18.961 billion, an 11% increase from third quarter 2005, and net income of $5.416 billion, a 20% increase.
- Net interest income was $8.894 billion, a 1% increase, impacted by the sale of Brazilian operations and prior year FAS 133 impact. Noninterest income increased 20% to $10.067 billion.
- Global Consumer & Small Business Banking reported net income of $2.889 billion, a 13% increase, driven by increases in cards, deposits, and debit purchase volume.
- Global data center capacity is expected to grow significantly from 0.8 ZB in 2015 to 278 ZB by 2021, driven by increasing cloud adoption.
- AT&T and Digital Realty have partnered to provide colocation services, leveraging Digital Realty's data center capacity and AT&T's global connectivity network.
- Digital Realty completed several financings in 2017, extending debt maturities to 2021-2023 and improving its credit ratings. The company reported first quarter 2017 revenue growth and funds from operations of $236 million.
Danaher Corporation announced its second quarter 2007 results, with net earnings of $311 million compared to $314 million in the second quarter of 2006. Sales increased 13.5% to $2.67 billion. For the first six months of 2007, net earnings were $566 million on sales of $5.23 billion, increases of 5.5% and 16.5% respectively over the same period in 2006. The company stated that core revenue growth was 4.5% in the quarter despite difficult comparisons, and that performance through the first half gives them confidence in achieving positive results for the full year.
- Bank of America reported second quarter 2006 results, with net income of $5.58 billion excluding merger charges, up 4% from the second quarter of 2005.
- The Global Consumer & Small Business Bank saw strong growth, with net income up 42% to $3.11 billion driven by increases in cards and deposits.
- The Global Corporate & Investment Bank reported net income of $1.72 billion, flat compared to the second quarter of 2005.
Omnicom reported its annual financial results for 2003. Key points include:
- Revenue increased 14% to $8.6 billion, with 10% growth domestically and 20% internationally.
- Net income grew 5% to $675.9 million and diluted earnings per share rose 4% to $3.59.
- Operating margins declined slightly to 13.5% due to changes in business mix and increased severance costs.
- The company won over $4 billion in new business and increased its dividend.
- Revenues from the top 250 clients grew over 15%, outpacing total revenue growth.
Goodrich Corporation announced third quarter 2004 results with net income of $50 million, up from $34 million in third quarter 2003. Sales increased to $1.167 billion from $1.064 billion. Goodrich increased its full year 2004 outlook with sales expected to be at the high end of $4.7-4.75 billion range and earnings per share expected to be $1.45-1.50, up from previous estimates. Goodrich saw increased sales across all market channels and gained new contracts for the Boeing 7E7 and Sikorsky UH-60M helicopter.
Digital realty 3 q17 earnings presentation finalir_digitalrealty
This document contains a summary of financial forecasts and metrics for Q3 2017 including:
- Global GDP growth is forecasted to be 3.5% in 2017 and 3.7% in 2018.
- US GDP growth is forecasted to be 2.2% in 2017 and 2.3% in 2018.
- Net income available to common stockholders was $119.8 million for Q3 2017.
- Funds from operations (FFO) per share was $4.16 for Q3 2017.
Omnicom reported its annual financial results for 2004. Key highlights include:
- Revenues increased 13% to a record $9.7 billion from $8.6 billion in 2003. Net income grew 15% to $723.5 million.
- All of Omnicom's marketing services disciplines (media, CRM, specialty communications, PR) contributed to revenue growth.
- Omnicom successfully completed its certification under the Sarbanes-Oxley Act, a significant and costly undertaking.
- The company intends to continue investing in its business and people to drive future growth, including potential acquisitions.
Danaher Corporation announced record first quarter results for 2006, with net earnings of $216 million, a 15% increase from 2005. Total sales increased 17.5% to $2.14 billion due to 12.5% growth from acquisitions and 7.5% core revenue growth. Operating cash flow was also up 8% from the previous record set in 2005. The company's CEO stated that the broad-based strength across businesses reinforces confidence in delivering positive results for the rest of 2006.
Dover Corporation reported a 16% increase in EPS to $0.88 for Q3 2007 compared to $0.76 for Q3 2006. Revenue increased 15% to $1.84 billion. For the first nine months of 2007, EPS increased 11% to $2.36 while revenue increased 15% to $5.37 billion. The company achieved organic growth of 3.3% and acquisition growth of 9.6% in Q3. Looking ahead, Dover expects continued solid business in Q4 but with moderating growth and restructuring charges of $0.02-0.03 per share.
Danaher Corporation announced record third quarter results for 2008. Net earnings from continuing operations increased 11% to $372 million compared to $335 million in the third quarter of 2007. Sales increased 17.5% to $3.21 billion. For the first nine months of 2008, net earnings from continuing operations increased 13.2% to $1.01 billion compared to $894 million for the same period in 2007. Sales for the first nine months increased 20.5% to $9.51 billion. The company's president stated they delivered strong performance in the quarter and expect to continue outperforming during challenging economic times due to their portfolio of businesses and operational excellence initiatives.
JPMorgan Chase Second Quarter 2008 Financial Results Conference Callfinance2
The document reports JPMorgan Chase's financial results for the second quarter of 2008. It notes a net income of $2 billion, excluding $540 million in losses from Bear Stearns merger-related items. It also discusses increasing credit reserves, markdowns on leveraged lending and mortgage positions, and the completed acquisition of Bear Stearns on May 30, 2008. For the Investment Bank specifically, it provides revenue and net income numbers and notes strong performance in some areas but markdowns on leveraged lending and mortgage-related positions.
Raytheon reported strong financial results for the fourth quarter and full year 2005. Fourth quarter sales increased 9% to $6.2 billion and income from continuing operations grew 15% to $282 million. For the full year, sales rose 8% to $21.9 billion and income from continuing operations increased 115% to $942 million. Raytheon also reduced its net debt by $1.3 billion in 2005 to $3.3 billion, the lowest level in ten years, and generated $2.1 billion in free cash flow from continuing operations for the full year. Looking ahead, Raytheon expects 2006 sales between $23.1-23.6 billion and earnings per share from continuing operations of $
CC Media Holdings reported financial results for Q4 and full year 2008. Q4 revenue was $1.6 billion, down 14% year-over-year, and full year revenue was $6.7 billion, down 3%. Operating expenses grew 3% in Q4 and 5% for the full year. The company reported a large net loss of $4.99 billion in Q4 and $4.6 billion for the full year, primarily due to a $5.3 billion impairment charge. OIBDAN (operating income before depreciation and amortization) declined 50% in Q4 to $309 million and 21% for the full year to $1.8 billion. The company also announced
GM's preliminary 2007 fourth quarter results showed:
- A GAAP net loss of $0.7 billion compared to an adjusted net income of $46 million, excluding special items.
- Total automotive revenue reached an all-time record of $46.7 billion.
- Adjusted automotive operating cash flow was negative $1.3 billion.
- GMNA's adjusted EBT declined by $0.9 billion from the fourth quarter of 2006 due to lower volume, mix, and pricing partially offset by manufacturing performance.
This document provides a summary of Raytheon Company's earnings for the first quarter of 2008. It includes:
1) Solid bookings of $6.5 billion and record backlog of $37.7 billion for the quarter.
2) Sales increased 11% to $5.4 billion. Operating income grew 17% to $608 million and earnings per share increased 31% to $0.93.
3) The company repurchased 5.5 million shares and increased its dividend by 10% for the year as previously announced.
iCrossing UK: Connectedness in UK Travel iCrossing
iCrossing UK's Chief Strategy Officer, Mark Iremonger, outlines the importance of brands being Connected with their customers, what a connected brands looks like and iCrossing UK measures connectedness. Travolution, London. November 2012
Robust Web APIs with node.js and ExpressKevin Griffin
The document discusses building robust web APIs with Node.js and Express. It introduces the speaker, Kevin Griffin, an independent consultant and CTO. Griffin will discuss RESTful URLs and building APIs with less slides and more code examples using Node.js and Express.
This document discusses validating biomedical scientific publications through a system called PaperMaker. It begins by outlining some key aspects of publishing, including agreeing/disagreeing on current science, bringing new results, and gaining new knowledge. It then describes ongoing work towards integrating literature into bioinformatics resources, supporting different domains, tracking provenance, and enabling inference and reasoning. Several of the presenter's past efforts are outlined, including named entity recognition, terminology resources, annotation formats, corpus annotation, and deploying solutions through services. The talk concludes by introducing PaperMaker as a way to validate scientific literature against these various resources and efforts.
Op 19 mei trapte WNF'er Jaap van der Waarde de WNF-webinar reeks af met een interactieve lezing over de Afrikaanse olifant. Hij vertelde alles over dit grootste landdier ter wereld, over stroperij, over het zero-poachingprogramma en over de resultaten en dilemma’s van het WNF-werk.
NF-Webinar is een interactieve lezing die je via internet kunt volgen. En natuurlijk kon je al je vragen, ideeën en opmerkingen kwijt!
Video-verslag, downloads van dit webinar en de vragen en antwoorden vind je op wnf.nl/webinars.
This document discusses how to be an effective risk manager. It outlines 10 principles for risk management, including only taking risks you understand, avoiding unexplainable price action, knowing that liquidity can disappear, and using risk limits. It also discusses tools like VaR, which can be useful but is subjective. The document emphasizes that the ultimate risk manager is yourself, and discusses how to analyze risks, identify biases, and have dialogue to improve risk management.
Edelman digital + sxsw 2016 lançamentoDaniel Rimoli
O documento descreve a jornada da Edelman Digital desde o Brasil até Austin, Texas, onde participa anualmente da conferência SXSW. Apresenta as principais tendências e tecnologias discutidas na conferência entre 2016-2017, incluindo dados e privacidade, inteligência artificial, realidade virtual e geração Z. Conclui afirmando que a Edelman Digital continuará acompanhando as novas transformações para apoiar seus clientes.
This document is Tesoro Corporation's quarterly report on Form 10-Q for the quarterly period ended March 31, 2007. It provides condensed consolidated financial statements and notes for Tesoro, including the balance sheet, income statement, and cash flow statement. It also summarizes Tesoro's pending acquisition of refining and retail assets in Los Angeles from Shell Oil for $1.63 billion, expected to close in May 2007, and its recent acquisition of 138 USA Petroleum retail stations for $267 million plus inventory.
ADI offersAL Darsouni (ADI) offers in-depth resources and a broad range of services tailored to client requirements. We actively pursue new and innovative ways to assist our clients to excel and exceed in business objectives.
ADI has pioneered the concept of interior designing and project management tailored specifically to the public and private sector needs. We have specialized divisions that include High-Rise Buildings, Commercial Complexes, Interior Architecture and Project Management Services.
This presentation details the 3D modeling portfolio and some of the projects we have designed and constructed. For more infomration do visit our website at www.aldarsouni.com
This document discusses radioactive materials found in shale gas wastes from Marcellus and Utica shale drilling. It notes that black shales naturally contain radioactive elements like uranium, thorium, and radium. Samples of drilling muds, flowback water, and brine from Ohio wells contained elevated levels of radium and uranium, in some cases hundreds to thousands of times above the EPA limit of 5 pCi/g. The document raises concerns about the long-term impacts of disposing of these radioactive wastes in solid waste landfills that are not properly designed for low-level radioactive waste.
The document promotes PBWorks, describing it as an online collaborative workspace that allows users to work together on a wiki. It is signed by Jaye A. H. Lapachet, the Manager of Library Services at Coblentz, Patch, Duffy & Bass LLP, and provides their contact information and links to the law firm's website for any questions about PBWorks or how it could benefit the firm.
The passage discusses how things have changed from the past to the present. In the past, people wrote letters and mailed them through the post office, but now most communication is done through email and text messages. Entertainment and news were once found through newspapers, radio, and television, but the internet now provides endless information and entertainment options online. While technology has advanced communication and media, some things remain the same as families still find ways to bond through quality time together.
The document discusses an optical illusion image containing purple lines and gray squares that appear to move when the eyes move. Tilting the head to the right reveals a man's face and a word beginning with "L" hidden in the image. Staring at a single spot or the black center of each circle causes the apparent motion to stop, demonstrating that it is an optical illusion created by eye movement rather than an animated image.
This document summarizes Raytheon's financial results for the fourth quarter and full year of 2008. Key points include: Raytheon reported solid financial results for Q4 and full year 2008, with record backlog of $38.9 billion; Q4 sales were $6.1 billion and adjusted EPS was $1.13; Full year sales grew 9% to $23.2 billion and adjusted EPS grew 23% to $4.06; Raytheon reaffirmed its financial guidance for 2009 and expects continued growth.
- Boeing reported a Q4 loss of $56 million compared to a profit of $1 billion in Q4 2007, due to impacts of the machinists' strike, a $685 million charge for the 747 program, and $101 million litigation reserve.
- Full year revenues fell 8% to $60.9 billion while net income declined 34% to $2.7 billion, reduced by an estimated $2.56 per share due to special charges.
- Boeing provided guidance for 2009 of revenues between $68-69 billion and EPS of $5.05-5.35 per share, with operating cash flow exceeding $2.5 billion.
Raytheon reported strong financial results for the first quarter of 2008. Sales increased 11% to $5.4 billion compared to the first quarter of 2007, driven by growth across all business segments. Operating income rose 17% to $608 million due to increased volume and lower expenses. Earnings per share from continuing operations increased 31% to $0.93. The company also achieved record backlog of $37.7 billion and solid bookings of $6.5 billion during the quarter. Raytheon reaffirmed its full-year 2008 guidance and expects continued growth.
Fifth Third Bancorp reported 2007 earnings of $1.1 billion, or $2.03 per diluted share, compared to $1.2 billion, or $2.13 per diluted share in 2006. Fourth quarter 2007 earnings were $38 million, or $0.07 per diluted share, compared to $325 million, or $0.61 per diluted share in the third quarter of 2007. Results were impacted by non-cash charges including lowering the value of a Bank-Owned Life Insurance policy and reserves related to potential Visa litigation settlements. Excluding these items, operating earnings were lower due to deterioration in credit performance and increased loan loss reserves in response to challenging credit conditions expected to continue in the near
Fifth Third Bancorp reported earnings for full year 2007 of $1.1 billion, down slightly from 2006. Earnings for Q4 2007 were $38 million, down significantly from previous quarters due to charges including a $155 million non-cash charge related to a decline in the value of a BOLI policy and $94 million in litigation reserves. Excluding these charges, operating earnings were relatively stable. Credit quality deteriorated during the quarter as loan loss provisions increased 105% from the previous quarter. Management expects further deterioration in credit conditions in the near term.
Fifth Third Bancorp reported a net loss for Q2 2008 due to charges related to leveraged leases. Excluding these charges, pre-tax earnings were up 16% year-over-year due to increases in noninterest income and average loans. However, credit costs increased significantly due to deteriorating economic conditions, particularly in real estate loans in Florida and Michigan. In response, Fifth Third raised capital levels and reduced the common dividend to strengthen its position during the economic downturn.
Fifth Third Bancorp reported a net loss for Q2 2008 due to charges related to leveraged leases. Excluding these charges, pre-tax earnings were up 16% year-over-year due to increases in noninterest income and loans. However, credit costs rose significantly due to deteriorating economic conditions, particularly in real estate loans in Florida and Michigan. In response, Fifth Third raised capital levels and reduced dividends to strengthen its position for potential future losses.
The document is Burlington Northern Santa Fe Corporation's second quarter 2007 investors' report. It summarizes that freight revenues increased 4% to $3.74 billion compared to second quarter 2006, but operating income decreased slightly to $841 million due to a $93 million rise in fuel expenses. Earnings per share were $1.20 compared to $1.27 in second quarter 2006. The report also provides details on financial results, operating statistics, and revenues by commodity for the quarter.
Pfizer Quarterly Corporate Performance - Third Quarter 2008finance5
This document summarizes Pfizer's third quarter 2008 earnings teleconference. It discusses Pfizer's financial results for the third quarter and year-to-date, including adjusted revenues increasing 2% for both periods. It also reviews significant items that impacted results, progress on Pfizer's cost reduction target, and select product highlights for the quarter.
In the third quarter 2008 earnings teleconference, Pfizer reported increased revenues and earnings compared to the previous year. Adjusted revenues increased 2% to $12.2 billion while adjusted income and EPS grew 5% and 7% respectively. Key products such as Lyrica, Celebrex and Viagra performed well. Pfizer also exceeded its cost reduction target, achieving $1.7 billion in savings through the third quarter with a goal of $2 billion for 2008 versus 2006. Pfizer narrowed its full-year revenue and EPS guidance ranges.
- Northrop Grumman reported a 7% increase in second quarter 2007 net income compared to the same period in 2006. Diluted earnings per share increased to $1.31.
- Operating margin increased 9% to $744 million, or 9.4% of sales, up from 9% in 2006. Sales increased 4% to $7.9 billion.
- Cash from operations increased 16% to $741 million, driven by higher net income and less cash spent on discontinued operations.
Northrop Grumman reported a 7% increase in second quarter 2007 net income compared to the same period in 2006. Diluted earnings per share increased to $1.31 from $1.26 the previous year. Operating margin rose 9% to $744 million, or 9.4% of sales, up from 9% of sales in 2006. Cash from operations also increased, rising to $741 million from $638 million in the prior year. For 2007, the company expects sales of approximately $31.5 billion, segment operating margin in the mid-9% range, diluted EPS from continuing operations between $4.90-$5.05, and cash from operations and free cash flow to be at the upper end
Goodrich Corporation reported third quarter 2006 results with the following highlights:
- Sales grew 5% year-over-year to $1.436 billion, with growth in all segments.
- Net income per diluted share was $0.80, a 63% increase from third quarter 2005.
- Segment operating margins improved in all segments compared to third quarter 2005.
- The company initiated a $300 million share repurchase program to reduce dilution from equity compensation programs.
Goodrich Corporation reported third quarter 2006 results with the following highlights:
- Sales grew 5% year-over-year to $1.436 billion, with growth in all segments.
- Net income per diluted share was $0.80, a 63% increase from third quarter 2005.
- The company authorized a $300 million share repurchase program to reduce dilution from equity programs.
- Segment operating margins improved in all segments compared to third quarter 2005.
Viacom reported financial results for the first quarter of 2008 that showed increases in revenue, operating income, and earnings per share compared to the first quarter of 2007. Revenue grew 15% to $3.117 billion. Operating income increased 29% to $567 million. Diluted earnings per share from continuing operations rose 45% to $0.42. Media Networks and Filmed Entertainment, Viacom's two business segments, both saw revenue growth for the quarter despite lower theatrical revenues at Filmed Entertainment. Viacom also provided guidance for 2008-2010 of low double-digit annual growth in diluted earnings per share from continuing operations.
This document summarizes Pfizer's fourth quarter 2007 earnings teleconference. It reports that Pfizer exceeded its 2007 revenue and EPS guidance. Key highlights included:
- Revenue increased 4% year-over-year in Q4 2007 and 1% for full year 2007. Adjusted diluted EPS increased 21% in Q4 2007 and 7% for full year.
- New products like Chantix, Lyrica and Sutent grew substantially and partially offset declines from products that lost exclusivity.
- 2008 guidance was increased, with revenue range increased and bottom end of EPS guidance also increased.
- Cost reduction initiatives continued to reduce expenses, with further savings expected in 2008.
This document summarizes Viacom's financial results for the third quarter of 2008. Revenues increased 4% year-over-year to $3.4 billion. Operating income decreased 15% to $689 million due to an 11% increase in expenses. Adjusted net earnings decreased 22% to $339 million, while adjusted diluted EPS decreased 15% to $0.55. Free cash flow was $564 million for the quarter compared to a significant decrease year-to-date. Total debt was $8.95 billion as of September 30, 2008, while cash on hand was $525 million.
- Bank of America reported third quarter 2007 results with net income of $3.7 billion, down 32% from the third quarter of 2006. Earnings per share were $0.82.
- Revenues declined 12% due to a 24% drop in noninterest income driven by losses in Global Corporate and Investment Banking from market turbulence.
- The provision for credit losses increased 74% to $2.03 billion reflecting increased consumer loan loss rates and impacts from the weakened housing market.
Goodrich Corporation reported first quarter 2008 results with sales growth of 13% and segment operating income margin increasing from 14.9% to 17.3%. Net income per diluted share increased 59% to $1.24, including $0.03 from discontinued operations. For full-year 2008, Goodrich increased its sales outlook to $7.2-7.3 billion (13-14% growth) and net income per diluted share outlook to $4.30-$4.45 (14-18% growth). Key drivers included strong commercial aircraft production and aftermarket demand as well as positions on new defense platforms.
Goodrich Corporation reported first quarter 2008 results with sales growth of 13% and segment operating income margin increasing from 14.9% to 17.3%. Net income per diluted share increased 59% to $1.24, which includes $0.03 from discontinued operations. For full-year 2008, Goodrich increased its sales outlook to $7.2-7.3 billion (13-14% growth) and net income per diluted share outlook to $4.30-$4.45 (14-18% growth). Key drivers include strong demand for commercial aircraft and aftermarket services as well as defense programs.
View Summary Manpower Inc. Withdraws Fourth Quarter 2008 Guidance 12/22/2008finance12
Manpower Inc. withdrew its fourth quarter 2008 guidance due to continued declines in the global labor markets and changes in foreign currencies. The company experienced a 20% revenue decline in the two months ended November 30, 2008 compared to the prior year. As a result of the weaker operating environment, Manpower Inc. will take restructuring charges related to employee severance and office closures in the fourth quarter. Despite the economic challenges, the company's liquidity and financial strength remains strong with $675 million in cash and $182 million in net debt as of the end of November.
The document is the 1999 annual report of Manpower Inc. It discusses the company's financial highlights for 1999, including increased systemwide sales, revenues, and operating margin compared to previous years. It summarizes the company's strategies to focus on providing workforce solutions, investing in technology, improving efficiency, and expanding in professional and specialty staffing. The report discusses how these strategies helped drive growth while improving profitability in 1999.
Manpower provided staffing solutions for a variety of clients around the world in 2000. Some key examples include:
1) Manpower Venezuela used a performance-based compensation model to win staffing contracts for three call centers in Venezuela.
2) In Australia, the Defense Force outsourced its military recruitment to Manpower due to their ability to provide a full-service solution.
3) In North Carolina, Manpower's workforce program helped IBM achieve significant contractor staffing cost savings.
This document highlights Manpower's global reach and ability to customize staffing solutions to meet the diverse needs of clients around the world.
The document is Manpower Inc.'s 2001 annual report. It summarizes that in 2001:
- Systemwide sales decreased 5.3% to $11.8 billion due to a weaker global economy and strengthening US dollar.
- Revenues decreased 3.3% and operating profit declined 23.6% as revenue growth slowed but investments continued.
- Earnings per share decreased 27% to $1.62 primarily due to currency exchange impacts. The company remained focused on providing skilled employees and workforce solutions to customers during economic uncertainty.
The document discusses Manpower's performance and strategies during a period of economic uncertainty in 2002. It summarizes that Manpower strengthened its financial position, improved efficiency, expanded services, and increased customer relationships despite challenging market conditions. Manpower emerged stronger and confident in its leadership position. The speed of work increased pressure on companies, but Manpower provided flexibility and quality service to help customers.
This document contains a long list of place names from around the world arranged in no clear order. The places span multiple continents and countries, including locations in France, Italy, Germany, Japan, Canada, Mexico, Argentina and many others.
The document is Manpower Inc.'s 2004 annual report. It discusses Manpower's 57-year history of providing temporary staffing solutions and how it has expanded its services over time. It also discusses how the world of work is constantly changing and how Manpower continues to adapt its solutions to help clients with their HR strategies and market competition. The report features perspectives from clients, including IBM's vice president of global talent discussing how IBM partners with Manpower for just-in-time talent management to source skills globally on demand.
This document is Manpower Inc.'s 2005 annual report. It summarizes the company's financial performance for 2005, noting revenues exceeded $16 billion, a 7.7% increase over 2004. Net income increased 8% to $260 million. It also discusses strategic moves taken in 2005 to expand operations in emerging markets like China and India. Finally, it describes the company's rebranding effort, launching a new logo and tagline - "What do you do?" - to reflect its expanded services beyond temporary staffing.
Manpower Inc. reported record financial results in 2006. Revenues increased 10.8% to $17.6 billion and net earnings increased 53% to $398 million. The company's stock price rose 61% in 2006, outperforming the broader market. Operating profit increased 24% to $532 million due to growth in business and effective cost management across regions. The company has transitioned to focus on providing a wider range of employment services beyond temporary staffing alone. The rebranding launched in 2006 aligned the company's image with this strategic transition and positioned Manpower for continued strong performance.
Manpower Inc. had record revenues and earnings in 2007. Revenues increased 17% to $20.5 billion while net earnings grew 22% to $484.7 million. The company has diversified its services over the past decade to include specialty services beyond temporary staffing, such as permanent recruitment and leadership development. This has improved profit margins and reduced sensitivity to economic cycles. Investments in new services like recruitment process outsourcing have positioned Manpower for continued growth.
The document is a Form 8-K filed by The Goodyear Tire & Rubber Company with the SEC on May 22, 2007. It announces that the company entered into an underwriting agreement to sell over 22 million shares of its common stock in a public offering at $33 per share, for total proceeds of over $750 million. The underwriters exercised their option to purchase additional shares. The company's general counsel issued a legality opinion on the shares offering. The proceeds will be used for general corporate purposes.
The Goodyear Tire & Rubber Company issued notices to partially redeem outstanding notes. It will redeem $140 million of its 9% Senior Notes due 2015 at 109% of par value, and $175 million of its 8.625% Senior Notes due 2011 at 108.625% of par value. Both redemptions will occur on June 29, 2007. Goodyear is using proceeds from a recent equity offering of common stock to fund the redemptions, as allowed under provisions permitting redemption of up to 35% of notes with equity offering proceeds.
Understanding how timely GST payments influence a lender's decision to approve loans, this topic explores the correlation between GST compliance and creditworthiness. It highlights how consistent GST payments can enhance a business's financial credibility, potentially leading to higher chances of loan approval.
Optimizing Net Interest Margin (NIM) in the Financial Sector (With Examples).pdfshruti1menon2
NIM is calculated as the difference between interest income earned and interest expenses paid, divided by interest-earning assets.
Importance: NIM serves as a critical measure of a financial institution's profitability and operational efficiency. It reflects how effectively the institution is utilizing its interest-earning assets to generate income while managing interest costs.
A toxic combination of 15 years of low growth, and four decades of high inequality, has left Britain poorer and falling behind its peers. Productivity growth is weak and public investment is low, while wages today are no higher than they were before the financial crisis. Britain needs a new economic strategy to lift itself out of stagnation.
Scotland is in many ways a microcosm of this challenge. It has become a hub for creative industries, is home to several world-class universities and a thriving community of businesses – strengths that need to be harness and leveraged. But it also has high levels of deprivation, with homelessness reaching a record high and nearly half a million people living in very deep poverty last year. Scotland won’t be truly thriving unless it finds ways to ensure that all its inhabitants benefit from growth and investment. This is the central challenge facing policy makers both in Holyrood and Westminster.
What should a new national economic strategy for Scotland include? What would the pursuit of stronger economic growth mean for local, national and UK-wide policy makers? How will economic change affect the jobs we do, the places we live and the businesses we work for? And what are the prospects for cities like Glasgow, and nations like Scotland, in rising to these challenges?
"Does Foreign Direct Investment Negatively Affect Preservation of Culture in the Global South? Case Studies in Thailand and Cambodia."
Do elements of globalization, such as Foreign Direct Investment (FDI), negatively affect the ability of countries in the Global South to preserve their culture? This research aims to answer this question by employing a cross-sectional comparative case study analysis utilizing methods of difference. Thailand and Cambodia are compared as they are in the same region and have a similar culture. The metric of difference between Thailand and Cambodia is their ability to preserve their culture. This ability is operationalized by their respective attitudes towards FDI; Thailand imposes stringent regulations and limitations on FDI while Cambodia does not hesitate to accept most FDI and imposes fewer limitations. The evidence from this study suggests that FDI from globally influential countries with high gross domestic products (GDPs) (e.g. China, U.S.) challenges the ability of countries with lower GDPs (e.g. Cambodia) to protect their culture. Furthermore, the ability, or lack thereof, of the receiving countries to protect their culture is amplified by the existence and implementation of restrictive FDI policies imposed by their governments.
My study abroad in Bali, Indonesia, inspired this research topic as I noticed how globalization is changing the culture of its people. I learned their language and way of life which helped me understand the beauty and importance of cultural preservation. I believe we could all benefit from learning new perspectives as they could help us ideate solutions to contemporary issues and empathize with others.
1. Elemental Economics - Introduction to mining.pdfNeal Brewster
After this first you should: Understand the nature of mining; have an awareness of the industry’s boundaries, corporate structure and size; appreciation the complex motivations and objectives of the industries’ various participants; know how mineral reserves are defined and estimated, and how they evolve over time.
Falcon stands out as a top-tier P2P Invoice Discounting platform in India, bridging esteemed blue-chip companies and eager investors. Our goal is to transform the investment landscape in India by establishing a comprehensive destination for borrowers and investors with diverse profiles and needs, all while minimizing risk. What sets Falcon apart is the elimination of intermediaries such as commercial banks and depository institutions, allowing investors to enjoy higher yields.
Independent Study - College of Wooster Research (2023-2024) FDI, Culture, Glo...AntoniaOwensDetwiler
"Does Foreign Direct Investment Negatively Affect Preservation of Culture in the Global South? Case Studies in Thailand and Cambodia."
Do elements of globalization, such as Foreign Direct Investment (FDI), negatively affect the ability of countries in the Global South to preserve their culture? This research aims to answer this question by employing a cross-sectional comparative case study analysis utilizing methods of difference. Thailand and Cambodia are compared as they are in the same region and have a similar culture. The metric of difference between Thailand and Cambodia is their ability to preserve their culture. This ability is operationalized by their respective attitudes towards FDI; Thailand imposes stringent regulations and limitations on FDI while Cambodia does not hesitate to accept most FDI and imposes fewer limitations. The evidence from this study suggests that FDI from globally influential countries with high gross domestic products (GDPs) (e.g. China, U.S.) challenges the ability of countries with lower GDPs (e.g. Cambodia) to protect their culture. Furthermore, the ability, or lack thereof, of the receiving countries to protect their culture is amplified by the existence and implementation of restrictive FDI policies imposed by their governments.
My study abroad in Bali, Indonesia, inspired this research topic as I noticed how globalization is changing the culture of its people. I learned their language and way of life which helped me understand the beauty and importance of cultural preservation. I believe we could all benefit from learning new perspectives as they could help us ideate solutions to contemporary issues and empathize with others.
Falcon stands out as a top-tier P2P Invoice Discounting platform in India, bridging esteemed blue-chip companies and eager investors. Our goal is to transform the investment landscape in India by establishing a comprehensive destination for borrowers and investors with diverse profiles and needs, all while minimizing risk. What sets Falcon apart is the elimination of intermediaries such as commercial banks and depository institutions, allowing investors to enjoy higher yields.
OJP data from firms like Vicinity Jobs have emerged as a complement to traditional sources of labour demand data, such as the Job Vacancy and Wages Survey (JVWS). Ibrahim Abuallail, PhD Candidate, University of Ottawa, presented research relating to bias in OJPs and a proposed approach to effectively adjust OJP data to complement existing official data (such as from the JVWS) and improve the measurement of labour demand.
5 Tips for Creating Standard Financial ReportsEasyReports
Well-crafted financial reports serve as vital tools for decision-making and transparency within an organization. By following the undermentioned tips, you can create standardized financial reports that effectively communicate your company's financial health and performance to stakeholders.
Economic Risk Factor Update: June 2024 [SlideShare]Commonwealth
May’s reports showed signs of continued economic growth, said Sam Millette, director, fixed income, in his latest Economic Risk Factor Update.
For more market updates, subscribe to The Independent Market Observer at https://blog.commonwealth.com/independent-market-observer.
Tdasx: In-Depth Analysis of Cryptocurrency Giveaway Scams and Security Strate...
raytheon Q4 Earnings Presentation
1. News release
FOR IMMEDIATE RELEASE
Media Contact: Investor Relations Contact:
Jon Kasle Greg Smith
781-522-5110 781-522-5141
Raytheon Reports Strong Third Quarter 2007 Results; Announces New $2.0 Billion
Share Repurchase Plan
Highlights
• Strong bookings of $6.5 billion; backlog of $33.9 billion
• Sales of $5.4 billion, up 8 percent
• Earnings per share (EPS) from continuing operations of $0.69, up 17 percent
$0.86 excluding Flight Options(1)
• Announces agreement to sell Flight Options LLC
• Repurchased 8.6 million shares for $500 million
WALTHAM, Mass., (October 25, 2007) – Raytheon Company (NYSE: RTN) reported third
quarter 2007 income from continuing operations of $304 million or $0.69 per diluted share
compared to $267 million or $0.59 per diluted share in the third quarter 2006. Third
quarter 2007 income from continuing operations was higher primarily due to operational
improvements, combined with lower net interest and pension expense, partially offset by
an after-tax impairment charge of $69 million ($84 million pretax) or $0.16 per diluted
share in connection with the disposition process of Flight Options. Third quarter 2007
income from continuing operations excluding Flight Options was $380 million or $0.86 per
diluted share compared to $274 million or $0.61 per diluted share in the third quarter
2006. (1)
(1)
Income and EPS from continuing operations excluding Flight Options are non-GAAP financial measures.
See attachment G for a reconciliation of these measures to income and EPS from continuing operations under
GAAP. We are providing these non-GAAP measures to provide insight on how we expect continuing
operations to appear when Flight Options is reported as a discontinued operation in the fourth quarter 2007.
2. Raytheon also announced that on October 15, 2007, it entered into a definitive agreement
to sell Flight Options to H.I.G. Capital, a global private investment firm. This transaction is
expected to close in the fourth quarter 2007.
“Our program execution, strong backlog and customer focus are driving the Company’s
performance and delivering value to our shareholders,” said William H. Swanson,
Raytheon Chairman and CEO. “With the pending sale of Flight Options, going forward
our attention will be focused on our core business, leading technologies and Mission
Support to our global customers.”
Third quarter 2007 net income was $299 million or $0.68 per diluted share compared to
$321 million or $0.71 per diluted share in the third quarter 2006. Net income for the third
quarter 2007 included a $5 million after-tax loss in discontinued operations or $0.01 per
diluted share versus a $54 million gain or $0.12 in the third quarter 2006. Third quarter
2006 discontinued operations results included Raytheon Aircraft Company (RAC), which
was sold by the Company in the second quarter 2007.
Net sales for the third quarter 2007 were $5.4 billion, up 8 percent from $4.9 billion in the
third quarter 2006 led primarily by Integrated Defense Systems (IDS), Missile Systems
(MS) and Network Centric Systems (NCS).
Operating cash flow from continuing operations for the third quarter 2007 was $735 million
versus $733 million for the third quarter 2006. The third quarter 2007 included $203
million in cash tax payments versus $53 million in cash tax payments in the third quarter
2006. Of the cash taxes paid in the third quarter 2007, $157 million was attributable to the
gain on the sale of RAC.
Year-to-date operating cash flow from continuing operations was $310 million versus
$1,159 million for the comparable period in 2006. The year-to-date decrease in operating
cash flow was primarily due to $846 million in cash tax payments ($473 million attributable
to the gain on the sale of RAC) versus $154 million of cash tax payments made in the
comparable period in 2006 combined with the $400 million discretionary cash contribution
3. made to the Company’s pension plans in the first quarter 2007 versus the $200 million
discretionary cash contribution made in the first quarter 2006.
During the third quarter 2007, the Company repurchased 8.6 million shares for $500
million as part of the Company’s previously announced share repurchase program. The
Company has repurchased 23.3 million shares of common stock year-to-date for $1.3
billion.
The Board of Directors, on October 24, 2007, authorized the repurchase of up to an
additional $2.0 billion of the Company's outstanding common stock. Share repurchases
will take place from time to time at management's discretion depending on market
conditions.
Summary Financial Results 3rd Quarter % Nine Months %
2007 2006 Change 2007 2006 Change
($ in millions, except per share data)
Net Sales $ 5,355 $ 4,936 8% $ 15,702 $ 14,569 8%
Total Operating Expenses 4,878 4,480 14,127 13,219
(2) (2)
Operating Income 477 456 5% 1,575 1,350 17%
Non-operating Expenses 8 48 96 112
Income from Cont. Ops. before Taxes $ 469 $ 408 15% $ 1,479 $ 1,238 19%
Income from Continuing Operations $ 304 $ 267 14% $ 974 $ 815 20%
(1)
Income from Discontinued Operations (5) 54 NM 1,006 103 NM
Net Income $ 299 $ 321 -7% $ 1,980 $ 918 116%
(2) (2)
Diluted EPS from Continuing Operations $ 0.69 $ 0.59 17% $ 2.17 $ 1.81 20%
(2) (2)
Diluted EPS $ 0.68 $ 0.71 -4% $ 4.42 $ 2.04 117%
(3) (3)
Operating Cash Flow from Cont. Ops. $ 735 $ 733 $ 310 $ 1,159
(1) Includes after-tax net gain of $986 million on sale of Raytheon Aircraft in Q2 '07
(2) Includes $84 million pretax or $0.16 after-tax impairment charges in the Flight Options business in Q3 '07 and
YTD '07
(3) Includes $157 million in Q3 '07 and $473 million in Q3 YTD of cash tax payments related to the gain on the
Raytheon Aircraft sale
4. Bookings and Backlog
Bookings 3rd Quarter Nine Months
2007 2006 2007 2006
(in millions)
Total Bookings $ 6,463 $ 5,403 $ 16,718 $ 15,207
Backlog
09/23/07 12/31/06
(in millions)
Backlog $ 33,889 $ 33,838
Funded Backlog $ 17,453 $ 18,186
The Company reported total bookings for the third quarter 2007 of $6.5 billion compared
to $5.4 billion in the third quarter 2006. The Company ended the third quarter 2007 with
backlog of $33.9 billion compared to $31.9 billion at the end of the third quarter 2006 and
$33.8 billion at the end of 2006.
Outlook
2007 Financial Outlook (1) Current Prior
Bookings ($B) 21.4 - 22.4 21.4 - 22.4
Net Sales ($B) 20.8 - 21.3 20.8 - 21.3
FAS/CAS Pension Expense ($M) 260 270
Interest Expense, net ($M) 30 - 45 45 - 60
Diluted Shares (M) 446 - 448 446 - 448
EPS from Cont. Ops. ($) $3.05 - $3.20 $3.05 - $3.20
(2)
Operating Cash Flow from Cont. Ops. ($B) 0.9 - 1.1 0.9 - 1.1
ROIC (%) 8.6 - 9.1 8.6 - 9.1
(1) Reflects Flight Options as a discontinued operation for the full-year 2007
(2) Includes cash tax payments of approximately $630 million from the gain on the Raytheon Aircraft sale
The Company has updated full-year 2007 guidance, including the reclassification of Flight
Options as a discontinued operation for full-year 2007. Charts containing additional
information on the Company’s 2007 guidance are available on the Company's website at
www.raytheon.com. See attachment F for the Company's calculation and use of Return
on Invested Capital (ROIC), a non-GAAP financial measure.
5. Outlook (Continued)
2008 Financial Outlook
Net Sales ($B) 22.1 - 22.6
EPS from Cont. Ops. ($) 3.45 - 3.65
Operating Cash Flow ($B) 1.5 - 1.7
Additional information regarding the Company’s 2008 guidance will be provided on the
fourth quarter earnings conference call scheduled for January 31, 2008.
Segment Results
Integrated Defense Systems
3rd Quarter % Nine Months %
2007 2006 Change 2007 2006 Change
($ in millions)
Net Sales $ 1,147 $ 1,030 11% $ 3,405 $ 3,031 12%
Operating Income $ 206 $ 167 23% $ 617 $ 502 23%
Operating Margin 18.0% 16.2% 18.1% 16.6%
Integrated Defense Systems (IDS) had third quarter 2007 net sales of $1,147 million, up
11 percent compared to $1,030 million in the third quarter 2006, primarily due to growth
on Missile Defense Agency and U.S. Army programs, as well as on international
programs. IDS recorded $206 million of operating income compared to $167 million in the
third quarter 2006. The increase in operating income was primarily due to higher volume
and improved performance on several international and domestic programs.
During the quarter, IDS booked $958 million for the production phase of mission support
equipment for the two lead Zumwalt-class destroyers for the U.S. Navy. IDS also booked
$123 million for the Patriot Pure Fleet program for the U.S. Army.
After the quarter close, IDS was awarded $1.2 billion for the Australian Air Warfare
Destroyer contract, which was booked in October 2007.
6. Intelligence and Information Systems
3rd Quarter % Nine Months %
2007 2006 Change 2007 2006 Change
($ in millions)
Net Sales $ 680 $ 626 9% $ 1,934 $ 1,870 3%
Operating Income $ 64 $ 58 10% $ 182 $ 171 6%
Operating Margin 9.4% 9.3% 9.4% 9.1%
Intelligence and Information Systems (IIS) had third quarter 2007 net sales of $680
million, up 9 percent compared to $626 million in the third quarter 2006, primarily due to
increased volume on several U.S. Air Force and information systems programs. IIS
recorded $64 million of operating income compared to $58 million in the third quarter
2006.
During the quarter, IIS booked $781 million for the National Polar-orbiting Operational
Environmental Satellite System (NPOESS) program and $101 million for the U.S. Air
Force’s Consolidated Field Service (CFS) contract to provide global intelligence,
surveillance and reconnaissance support. IIS also booked $279 million on a number of
classified contracts.
After the quarter close, the Company acquired Oakley Networks, a leading developer of
cyber-security technology, which will add to Raytheon’s capabilities in information
operations/information assurance solutions.
Missile Systems
3rd Quarter % Nine Months %
2007 2006 Change 2007 2006 Change
($ in millions)
Net Sales $ 1,247 $ 1,081 15% $ 3,631 $ 3,187 14%
Operating Income $ 139 $ 109 28% $ 393 $ 341 15%
Operating Margin 11.1% 10.1% 10.8% 10.7%
Missile Systems (MS) had third quarter 2007 net sales of $1,247 million, up 15 percent
compared to $1,081 million in the third quarter 2006, primarily due to higher volume on the
7. Standard Missile and Evolved Sea Sparrow Missile (ESSM) programs. MS recorded $139
million of operating income compared to $109 million in the third quarter 2006. The
increase in operating income was primarily due to higher volume and improved
performance.
During the quarter, MS booked $223 million for the production of ESSM and $201 million
for Standard Missile-2 (SM-2). MS also booked $117 million for the production of Javelin
for the U.S. Army and U.S. Marines.
Network Centric Systems
3rd Quarter % Nine Months %
2007 2006 Change 2007 2006 Change
($ in millions)
Net Sales $ 1,036 $ 879 18% $ 3,017 $ 2,550 18%
Operating Income $ 123 $ 87 41% $ 379 $ 262 45%
Operating Margin 11.9% 9.9% 12.6% 10.3%
Network Centric Systems (NCS) had third quarter 2007 net sales of $1,036 million, up 18
percent compared to $879 million in the third quarter 2006, primarily due to increased
volume on certain U.S. Army programs. NCS recorded $123 million of operating income
compared to $87 million in the third quarter 2006. The increase in operating income was
primarily due to higher volume and improved program performance.
During the quarter, NCS booked $116 million to provide Long Range Advanced Scout
Surveillance Systems (LRAS3) and $104 million for Horizontal Technology Integration
(HTI) forward-looking infrared kits to the U.S. Army. NCS also booked $106 million on the
Long Range Radar Service Life Extension Program (LRR SLEP).
Also during the quarter, the U.S. Navy directed Raytheon to proceed with the
development of the Navy Multiband Terminal (NMT).
8. Space and Airborne Systems
3rd Quarter % Nine Months %
2007 2006 Change 2007 2006 Change
($ in millions)
Net Sales $ 1,016 $ 1,069 -5% $ 3,045 $ 3,144 -3%
Operating Income $ 121 $ 148 -18% $ 383 $ 445 -14%
Operating Margin 11.9% 13.8% 12.6% 14.2%
Space and Airborne Systems (SAS) had third quarter 2007 net sales of $1,016 million,
down 5 percent compared to $1,069 million in the third quarter 2006, primarily due to
lower volume on some airborne systems programs and a reduction in classified space
bookings due to customer reprioritization. SAS recorded $121 million of operating income
compared to $148 million in the third quarter 2006. Operating income was lower primarily
due to profit adjustments taken on certain programs in both the third quarter 2006 and
2007 and reduced volume.
During the quarter, SAS booked over $123 million on a number of classified contracts.
Technical Services
3rd Quarter % Nine Months %
2007 2006 Change 2007 2006 Change
($ in millions)
Net Sales $ 513 $ 500 3% $ 1,412 $ 1,416 NM
Operating Income $ 34 $ 35 -3% $ 84 $ 96 -13%
Operating Margin 6.6% 7.0% 5.9% 6.8%
Technical Services (TS) had third quarter 2007 net sales of $513 million compared to
$500 million in the third quarter 2006. TS recorded operating income of $34 million in the
third quarter 2007 compared to $35 million in the third quarter 2006.
Other
Net sales in the third quarter 2007 were $191 million compared to $190 million in the third
quarter 2006. The segment recorded an operating loss of $96 million in the third quarter
9. 2007 compared to an operating loss of $10 million in the third quarter 2006. During the
third quarter 2007, the Company initiated a process to dispose of its Flight Options (FO)
business. The Company recorded an after-tax impairment charge of $69 million ($84
million pretax), which includes all of FO’s remaining goodwill and a portion of its intangible
assets, as a result of the disposition process.
On October 15, 2007, Raytheon entered into a definitive agreement to sell FO to H.I.G.
Capital, a global private investment firm. In the fourth quarter 2007, the Company expects
to record an additional after-tax charge of approximately $45 million, subject to purchase
price adjustments, to write down the net assets of FO to the expected final net sales price.
The Company will present FO as a discontinued operation in the fourth quarter 2007 and
for all periods presented.
Raytheon Company (NYSE: RTN), with 2006 sales of $20.3 billion, is a technology leader
specializing in defense, homeland security and other government markets throughout the
world. With a history of innovation spanning 85 years, Raytheon provides state-of-the-art
electronics, mission systems integration and other capabilities in the areas of sensing;
effects; and command, control, communications and intelligence systems, as well as a
broad range of mission support services. With headquarters in Waltham, Mass.,
Raytheon employs 73,000 people worldwide.
Disclosure Regarding Forward-looking Statements
This release and the attachments contain forward-looking statements, including
information regarding the Company’s 2007 and 2008 financial outlook, future plans,
objectives, business prospects and anticipated financial performance. These forward-
looking statements are not statements of historical facts and represent only the
Company’s current expectations regarding such matters. These statements inherently
involve a wide range of known and unknown risks and uncertainties. The Company’s
actual actions and results could differ materially from what is expressed or implied by
these statements. Specific factors that could cause such a difference include, but are not
limited to: risks associated with the Company’s U.S. government sales, including changes
or shifts in defense spending, uncertain funding of programs, potential termination of
contracts, and difficulties in contract performance; the ability to procure new contracts; the
risks of conducting business in foreign countries; the ability to comply with extensive
governmental regulation, including import and export policies and procurement and other
regulations; the impact of competition; the ability to develop products and technologies;
the risk of cost overruns, particularly for the Company’s fixed-price contracts; dependence
on component availability, subcontractor performance and key suppliers; risks of a
negative government audit; the use of accounting estimates in the Company’s financial
statements; potential further charges relating to Flight Options; risks associated with the
10. Company’s sale of Flight Options; risks associated with the commuter and fractional
ownership aircraft markets; the outcome of contingencies and litigation matters, including
government investigations; the ability to recruit and retain qualified personnel; risks
associated with acquisitions, joint ventures and other business arrangements; the impact
of changes in the Company’s credit ratings; and other factors as may be detailed from
time to time in the Company’s public announcements and Securities and Exchange
Commission filings. In addition, these statements do not give effect to the potential impact
of any acquisitions, divestitures or business combinations that may be announced or
closed after the date hereof. The Company undertakes no obligation to make any
revisions to the forward-looking statements contained in this release and the attachments
or to update them to reflect events or circumstances occurring after the date of this
release. This release and the attachments also contain non-GAAP financial measures. A
GAAP reconciliation and a discussion of the Company's use of these measures are
included in this release or the attachments.
Conference Call on the Third Quarter 2007 Financial Results
Raytheon’s financial results conference call will be held on Thursday, October 25, 2007 at
9 a.m. EDT. Participants will include William H. Swanson, Chairman and CEO, David C.
Wajsgras, senior vice president and CFO, and other Company executives.
The dial-in number for the conference call will be (866) 800 – 8651.. The conference call
will also be audiocast on the Internet at www.raytheon.com. Individuals may listen to the
call and download charts that will be used during the call. These charts will be available
for printing prior to the call.
Interested parties are encouraged to check the website ahead of time to ensure their
computers are configured for the audio stream. Instructions for obtaining the free required
downloadable software are posted on the site.
###
11. Attachment A
Raytheon Company
Preliminary Statement of Operations Information
Third Quarter 2007
Nine Months Ended
(In millions except per share amounts) Three Months Ended
23-Sep-07 24-Sep-06 23-Sep-07 24-Sep-06
Net sales $ 5,355 $ 4,936 $ 15,702 $ 14,569
Cost of sales 4,276 4,047 12,583 11,886
Administrative and selling expenses 460 327 1,167 991
Research and development expenses 142 106 377 342
Total operating expenses 4,878 4,480 14,127 13,219
Operating income 477 456 1,575 1,350
Interest expense 41 65 155 202
Interest income (42) (15) (127) (49)
Other expense (income), net 9 (2) 68 (41)
Non-operating expense, net 8 48 96 112
Income from continuing operations before taxes 469 408 1,479 1,238
Federal and foreign income taxes 165 141 505 423
Income from continuing operations 304 267 974 815
(Loss) income from discontinued operations, net of tax (5) 54 20 103
Gain on sale, net of tax - - 986 -
(Loss) income from discontinued operations (5) 54 1,006 103
Net income $ 299 $ 321 $ 1,980 $ 918
Earnings per share from continuing operations
Basic $ 0.70 $ 0.60 $ 2.23 $ 1.84
Diluted $ 0.69 $ 0.59 $ 2.17 $ 1.81
(Loss) earnings per share from discontinued operations
Basic $ (0.01) $ 0.12 $ 2.31 $ 0.23
Diluted $ (0.01) $ 0.12 $ 2.24 $ 0.23
Earnings per share
Basic $ 0.69 $ 0.73 $ 4.54 $ 2.08
Diluted $ 0.68 $ 0.71 $ 4.42 $ 2.04
Average shares outstanding
Basic 431.2 441.9 436.3 442.3
Diluted 443.0 451.6 448.2 450.5
12. Attachment B
Raytheon Company
Preliminary Segment Information
Third Quarter 2007
(In millions)
Operating Income
Net Sales Operating Income As a Percent of Sales
Three Months Ended Three Months Ended Three Months Ended
23-Sep-07 24-Sep-06 23-Sep-07 24-Sep-06 23-Sep-07 24-Sep-06
Integrated Defense Systems $ 1,147 $ 1,030 $ 206 $ 167 18.0% 16.2%
Intelligence and Information Systems 680 626 64 58 9.4% 9.3%
Missile Systems 1,247 1,081 139 109 11.1% 10.1%
Network Centric Systems 1,036 879 123 87 11.9% 9.9%
Space and Airborne Systems 1,016 1,069 121 148 11.9% 13.8%
Technical Services 513 500 34 35 6.6% 7.0%
Other 191 190 (96) (10) -50.3% -5.3%
FAS/CAS Pension Adjustment - - (67) (90)
Corporate and Eliminations (475) (439) (47) (48)
Total $ 5,355 $ 4,936 $ 477 $ 456 8.9% 9.2%
Operating Income
Net Sales Operating Income As a Percent of Sales
Nine Months Ended Nine Months Ended Nine Months Ended
23-Sep-07 24-Sep-06 23-Sep-07 24-Sep-06 23-Sep-07 24-Sep-06
Integrated Defense Systems $ 3,405 $ 3,031 $ 617 $ 502 18.1% 16.6%
Intelligence and Information Systems 1,934 1,870 182 171 9.4% 9.1%
Missile Systems 3,631 3,187 393 341 10.8% 10.7%
Network Centric Systems 3,017 2,550 379 262 12.6% 10.3%
Space and Airborne Systems 3,045 3,144 383 445 12.6% 14.2%
Technical Services 1,412 1,416 84 96 5.9% 6.8%
Other 589 582 (103) (33) -17.5% -5.7%
FAS/CAS Pension Adjustment - - (192) (271)
Corporate and Eliminations (1,331) (1,211) (168) (163)
Total $ 15,702 $ 14,569 $ 1,575 $ 1,350 10.0% 9.3%
13. Attachment C
Raytheon Company
Other Preliminary Information
Third Quarter 2007
Funded
Backlog Backlog
(In millions) (In millions)
23-Sep-07 31-Dec-06 23-Sep-07 31-Dec-06
Integrated Defense Systems $ 8,458 $ 7,934 $ 3,399 $ 4,088
Intelligence and Information Systems 4,142 3,935 925 893
Missile Systems 9,078 9,504 4,866 5,135
Network Centric Systems 5,407 5,059 4,094 4,037
Space and Airborne Systems 4,900 5,591 2,907 2,770
Technical Services 1,686 1,572 1,044 1,020
Other 218 243 218 243
Total $ 33,889 $ 33,838 $ 17,453 $ 18,186
Bookings
(In millions)
Three Months Ended
23-Sep-07 24-Sep-06
Total Bookings $ 6,463 $ 5,403
14. Attachment D
Raytheon Company
Preliminary Balance Sheet Information
Third Quarter 2007
(In millions)
23-Sep-07 31-Dec-06
Assets
Cash and cash equivalents $ 2,609 $ 2,460
Accounts receivable, less allowance for doubtful accounts 155 178
Contracts in process 3,894 3,600
Inventories 543 487
Deferred taxes 215 257
Prepaid expenses and other current assets 391 239
Assets held for sale - 2,296
Total current assets 7,807 9,517
Property, plant and equipment, net 2,062 2,131
Deferred taxes 74 189
Goodwill 11,464 11,539
Other assets, net 2,084 2,115
Total assets $ 23,491 $ 25,491
Liabilities and Stockholders' Equity
Notes payable and current portion of long-term debt $ 119 $ 687
Advance payments and billings in excess of costs incurred 1,786 1,962
Accounts payable 982 920
Accrued employee compensation 950 944
Other accrued expenses 1,138 1,193
Liabilities held for sale - 1,009
Total current liabilities 4,975 6,715
Accrued retiree benefits and other long-term liabilities 4,083 4,232
Deferred taxes - -
Long-term debt 2,249 3,278
Minority interest 211 165
Stockholders' equity 11,973 11,101
Total liabilities and stockholders' equity $ 23,491 $ 25,491
15. Attachment E
Raytheon Company
Preliminary Cash Flow Information
Third Quarter 2007
(In millions)
Three Months Ended Nine Months Ended
23-Sep-07 24-Sep-06 23-Sep-07 24-Sep-06
Income from continuing operations $ 304 $ 267 $ 974 $ 815
Depreciation 76 72 219 215
Amortization 22 19 65 60
Working capital 219 80 (499) (484)
Discontinued operations (4) 19 (45) 33
Net activity in financing receivables 15 22 71 96
Other 99 273 (520) 457
Net operating cash flow 731 752 265 1,192
Capital spending (65) (58) (161) (146)
Internal use software spending (18) (25) (52) (50)
Acquisitions - (40) - (87)
Investment activity and divestitures - - 3,117 50
Dividends (111) (108) (331) (313)
Repurchase of common stock (500) (250) (1,301) (352)
Debt repayments (568) (74) (1,606) (445)
Discontinued operations - (9) (27) (27)
Other 95 49 245 138
Total cash flow $ (436) $ 237 $ 149 $ (40)
16. Attachment F
Raytheon Company
Non-GAAP Financial Measures
Third Quarter 2007
We define ROIC as income from continuing operations plus after-tax net interest expense plus one-third of operating
lease expense after-tax (estimate of interest portion of operating lease expense) divided by average invested capital
after capitalizing operating leases (operating lease expense times a multiplier of 8), adding financial guarantees less
net investment in Discontinued Operations, and adding back the cumulative minimum pension liability/impact of
FAS 158. ROIC is not a measure of financial performance under generally accepted accounting principles (GAAP) and
may not be defined and calculated by other companies in the same manner. ROIC should be considered
supplemental to and not a substitute for financial information prepared in accordance with GAAP. We use ROIC as a
measure of efficiency and effectiveness of our use of capital and as an element of management compensation.
Return on Invested Capital
2007 Current Guidance 2007 Prior Guidance
(In millions)
Low end High end Low end High end
of range of range of range of range
Income from continuing operations
Net interest expense, after-tax* Combined Combined Combined Combined
Lease expense, after-tax*
Return $ 1,450 $ 1,515 $ 1,470 $ 1,535
Net debt **
Equity less investment in discontinued operations
Lease expense x 8 plus financial guarantees Combined Combined Combined Combined
Minimum pension liability (cumulative)
Invested capital from continuing operations*** $ 16,885 $ 16,685 $ 17,050 $ 16,850
ROIC 8.6% 9.1% 8.6% 9.1%
* Effective tax rate: 33.9% (2007 guidance)
** Net debt is defined as total debt less cash and cash equivalents and is calculated using a 2 point average
*** Calculated using a 2 point average
17. Attachment G
Raytheon Company
Preliminary Financial Information Excluding Flight Options Non-GAAP Reconciliation
Third Quarter 2007
(In millions except per share amounts)
Three Months Ended Nine Months Ended
23-Sep-07 24-Sep-06 23-Sep-07 24-Sep-06
Net sales as reported under GAAP $ 5,355 $ 4,936 $ 15,702 $ 14,569
Less: Flight Options (136) (137) (401) (423)
Net sales excluding Flight Options* $ 5,219 $ 4,799 $ 15,301 $ 14,146
Three Months Ended Nine Months Ended
23-Sep-07 24-Sep-06 23-Sep-07 24-Sep-06
Operating income as reported under GAAP $ 477 $ 456 $ 1,575 $ 1,350
Add Back: Flight Options, including a Q3 2007 pretax
impairment charge of $84 million 95 12 107 41
Operating income excluding Flight Options* $ 572 $ 468 $ 1,682 $ 1,391
Three Months Ended Nine Months Ended
23-Sep-07 24-Sep-06 23-Sep-07 24-Sep-06
Operating margin as reported under GAAP 8.9% 9.2% 10.0% 9.3%
Operating margin excluding Flight Options* 11.0% 9.8% 11.0% 9.8%
Three Months Ended Nine Months Ended
23-Sep-07 24-Sep-06 23-Sep-07 24-Sep-06
Income from continuing operations as reported
under GAAP $ 304 $ 267 $ 974 $ 815
Add Back: Flight Options, including a Q3 2007 after-tax
impairment charge of $69 million 76 7 85 28
Income from continuing operations excluding Flight
Options* $ 380 $ 274 $ 1,059 $ 843
Three Months Ended Nine Months Ended
23-Sep-07 24-Sep-06 23-Sep-07 24-Sep-06
Diluted EPS from continuing operations as reported
under GAAP $ 0.69 $ 0.59 $ 2.17 $ 1.81
Add Back: Loss per share of Flight Options, including
a Q3 2007 after-tax impairment charge of $0.16 0.17 0.02 0.19 0.06
Diluted EPS from continuing operations excluding
Flight Options* $ 0.86 $ 0.61 $ 2.36 $ 1.87
* These amounts are not measures of financial performance under generally accepted accounting
principles (GAAP). They should be considered supplemental to and not a substitute for financial performance
in accordance with GAAP. We are providing these non-GAAP measures to provide insight on how we
expect continuing operations to appear when Flight Options is reported as a discontinued operation
in the fourth quarter 2007.