
Recommended
More Related Content
What's hot
What's hot (17)
Viewers also liked
Viewers also liked (20)
Similar to hess 01/30/2008 Estimated Results for the Fourth Quarter of 2007
Similar to hess 01/30/2008 Estimated Results for the Fourth Quarter of 2007 (20)
More from finance8
More from finance8 (20)
Recently uploaded
Recently uploaded (20)
hess 01/30/2008 Estimated Results for the Fourth Quarter of 2007
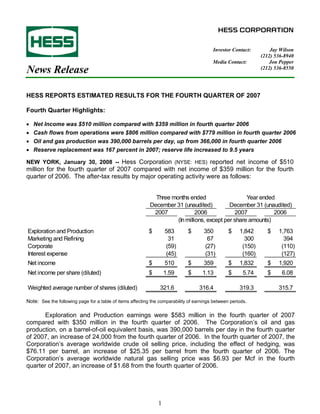
- 1. HESS CORPORATION Investor Contact: Jay Wilson (212) 536-8940 Media Contact: Jon Pepper (212) 536-8550 HESS REPORTS ESTIMATED RESULTS FOR THE FOURTH QUARTER OF 2007 Fourth Quarter Highlights: • Net Income was $510 million compared with $359 million in fourth quarter 2006 • Cash flows from operations were $806 million compared with $779 million in fourth quarter 2006 • Oil and gas production was 390,000 barrels per day, up from 366,000 in fourth quarter 2006 • Reserve replacement was 167 percent in 2007; reserve life increased to 9.5 years NEW YORK, January 30, 2008 -- Hess Corporation (NYSE: HES) reported net income of $510 million for the fourth quarter of 2007 compared with net income of $359 million for the fourth quarter of 2006. The after-tax results by major operating activity were as follows: Three months ended Year ended December 31 (unaudited) December 31 (unaudited) 2007 2006 2007 2006 (In millions, except per share amounts) Exploration and Production $ 583 $ 350 $ 1,842 $ 1,763 Marketing and Refining 31 67 300 394 Corporate (59) (27) (150) (110) Interest expense (45) (31) (160) (127) Net income $ 510 $ 359 $ 1,832 $ 1,920 Net income per share (diluted) $ 1.59 $ 1.13 $ 5.74 $ 6.08 Weighted average number of shares (diluted) 321.6 316.4 319.3 315.7 Note: See the following page for a table of items affecting the comparability of earnings between periods. Exploration and Production earnings were $583 million in the fourth quarter of 2007 compared with $350 million in the fourth quarter of 2006. The Corporation’s oil and gas production, on a barrel-of-oil equivalent basis, was 390,000 barrels per day in the fourth quarter of 2007, an increase of 24,000 from the fourth quarter of 2006. In the fourth quarter of 2007, the Corporation’s average worldwide crude oil selling price, including the effect of hedging, was $76.11 per barrel, an increase of $25.35 per barrel from the fourth quarter of 2006. The Corporation’s average worldwide natural gas selling price was $6.93 per Mcf in the fourth quarter of 2007, an increase of $1.68 from the fourth quarter of 2006. 1
- 2. Oil and gas proved reserves increased to 1,330 million barrels of oil equivalent at the end of 2007 from 1,243 million barrels at the end of 2006. During 2007, the Corporation added 234 million new barrels of oil equivalent to proved reserves. These additions, which are subject to final review, replaced approximately 167 percent of the Corporation’s 2007 production and increased its reserve life to 9.5 years. Marketing and Refining earnings were $31 million in the fourth quarter of 2007 compared with $67 million in the fourth quarter of 2006 reflecting reduced margins and trading results. Refining earnings were $27 million in the fourth quarter of 2007 compared with $45 million in the fourth quarter of 2006. Marketing earnings were $19 million in the fourth quarter of 2007 compared with $17 million in the fourth quarter of 2006. Trading activities generated a loss of $15 million in the fourth quarter of 2007 compared with income of $5 million in the fourth quarter of 2006. The following items, on an after-tax basis, are included in net income (in millions): Three months ended Year ended December 31 December 31 2007 2006 2007 2006 Exploration and Production Gains from asset sales $ - $ - $ 15 $ 236 Asset impairments (56) - (56) - Estimated production imbalance settlements - - (33) - Income tax adjustments - - - (45) Accrued office closing costs - - - (18) Marketing and Refining LIFO inventory liquidation 24 - 24 - Corporate Legal matters (25) - (25) - $ (57) $ - $ (75) $ 173 In the fourth quarter of 2007, the Corporation recorded an after-tax charge of $56 million related to asset impairments at two mature fields in the U.K. North Sea, income of $24 million due to the partial liquidation of prior year LIFO inventories and a charge of $25 million related to MTBE litigation. Net cash provided by operating activities was $3,507 million for the year 2007 compared with $3,491 million for the year 2006. Capital and exploratory expenditures for 2007 were $3,926 million, of which $3,786 million related to Exploration and Production operations. Capital and exploratory expenditures for 2006 were $4,056 million. At December 31, 2007, cash and cash equivalents totaled $607 million compared with $383 million at December 31, 2006. Total debt was $3,980 million at December 31, 2007 and $3,772 million at December 31, 2006. The Corporation’s debt to capitalization ratio at December 31, 2007 was 28.9 percent compared with 31.6 percent at the end of 2006. 2
- 3. Hess Corporation will review fourth quarter financial and operating results and other matters on a webcast at 10 a.m. today. For details on the event, refer to the Investor Relations section of our website at www.hess.com. Hess Corporation, with headquarters in New York, is a global integrated energy company engaged in the exploration, production, purchase, transportation and sale of crude oil and natural gas, as well as the production and sale of refined petroleum products. More information on Hess Corporation is available at www.hess.com. Forward Looking Statements Certain statements in this release may constitute quot;forward-looking statementsquot; within the meaning of Section 21E of the United States Securities Exchange Act of 1934, as amended, and Section 27A of the United States Securities Act of 1933, as amended. Forward-looking statements are subject to known and unknown risks and uncertainties and other factors which may cause actual results to differ materially from those expressed or implied by such statements, including, without limitation, uncertainties inherent in the measurement and interpretation of geological, geophysical and other technical data. 3
- 4. HESS CORPORATION AND CONSOLIDATED SUBSIDIARIES SUPPLEMENTAL FINANCIAL DATA (UNAUDITED) (IN MILLIONS OF DOLLARS) Fourth Fourth Third Quarter Quarter Quarter 2007 2006 2007 Income Statement Revenues and Non-operating Income Sales (excluding excise taxes) and other operating revenues $ 9,456 $ 7,155 $ 7,451 Equity in income of HOVENSA L.L.C. 20 29 19 Other, net 24 22 34 Total revenues and non-operating income 9,500 7,206 7,504 Costs and Expenses Cost of products sold (excluding items shown separately below) 6,651 5,058 5,322 Production expenses 463 358 394 Marketing expenses 243 254 238 Exploration expenses, including dry holes and lease impairment 201 140 131 Other operating expenses 46 33 45 General and administrative expenses 208 117 133 Interest expense 71 51 59 Depreciation, depletion and amortization 530 353 365 Total costs and expenses 8,413 6,364 6,687 Income before income taxes 1,087 842 817 Provision for income taxes 577 483 422 Net income $ 510 $ 359 $ 395 Preferred stock dividends - 8 - Net income applicable to common stockholders $ 510 $ 351 $ 395 Supplemental Income Statement Information Foreign currency gains (losses), after-tax $ 1 $ 5 $ 1 Capitalized interest 1 25 18 Cash Flow Information Net cash provided by operating activities (*) $ 806 $ 779 $ 863 Capital and Exploratory Expenditures Exploration and Production United States $ 291 $ 269 $ 270 International 577 715 530 Total Exploration and Production 868 984 800 Marketing, Refining and Corporate 46 47 38 Total Capital and Exploratory Expenditures $ 914 $ 1,031 $ 838 Exploration expenses charged to income included above United States $ 43 $ 42 $ 67 International 66 28 36 $ 109 $ 70 $ 103 (*) Includes changes in working capital 4
- 5. HESS CORPORATION AND CONSOLIDATED SUBSIDIARIES SUPPLEMENTAL FINANCIAL DATA (UNAUDITED) (IN MILLIONS OF DOLLARS) Year Ended December 31, 2007 2006 Income Statement Revenues and Non-operating Income Sales (excluding excise taxes) and other operating revenues $ 31,647 $ 28,067 Equity in income of HOVENSA L.L.C. 176 201 Gain on asset sales 21 369 Other, net 80 81 Total revenues and non-operating income 31,924 28,718 Costs and Expenses Cost of products sold (excluding items shown separately below) 22,573 19,912 Production expenses 1,581 1,250 Marketing expenses 944 940 Exploration expenses, including dry holes and lease impairment 515 552 Other operating expenses 161 122 General and administrative expenses 614 471 Interest expense 256 201 Depreciation, depletion and amortization 1,576 1,224 Total costs and expenses 28,220 24,672 Income before income taxes 3,704 4,046 Provision for income taxes 1,872 2,126 Net income $ 1,832 $ 1,920 Preferred stock dividends - 44 Net income applicable to common stockholders $ 1,832 $ 1,876 Supplemental Income Statement Information Foreign currency gains (losses), after-tax $ (9) $ 10 Capitalized interest 50 100 Cash Flow Information Net cash provided by operating activities (*) $ 3,507 $ 3,491 Capital and Exploratory Expenditures Exploration and Production United States $ 1,603 $ 908 International 2,183 2,979 Total Exploration and Production 3,786 3,887 Marketing, Refining and Corporate 140 169 Total Capital and Exploratory Expenditures $ 3,926 $ 4,056 Exploration expenses charged to income included above United States $ 192 $ 110 International 156 102 $ 348 $ 212 (*) Includes changes in working capital 5
- 6. HESS CORPORATION AND CONSOLIDATED SUBSIDIARIES SUPPLEMENTAL FINANCIAL DATA (UNAUDITED) (IN MILLIONS OF DOLLARS) December 31, 2007 2006 Balance Sheet Information Cash and cash equivalents $ 607 $ 383 Other current assets 6,319 5,465 Investments 1,117 1,243 Property, plant and equipment - net 14,634 12,308 Other long-term assets 3,454 3,043 Total assets $ 26,131 $ 22,442 Current maturities of long-term debt $ 62 $ 27 Other current liabilities 7,962 6,712 Long-term debt 3,918 3,745 Other long-term liabilities 4,415 3,811 Stockholders' equity excluding other comprehensive income (loss) 11,615 9,711 Accumulated other comprehensive income (loss) (1,841) (1,564) Total liabilities and stockholders' equity $ 26,131 $ 22,442 6
- 7. HESS CORPORATION AND CONSOLIDATED SUBSIDIARIES EXPLORATION AND PRODUCTION EARNINGS (UNAUDITED) (IN MILLIONS OF DOLLARS) Fourth Quarter 2007 United States International Total Sales and other operating revenues $ 401 $ 2,037 $ 2,438 Non-operating income (loss) (1) 14 13 Total revenues and non-operating income 400 2,051 2,451 Costs and expenses Production expenses, including related taxes 71 392 463 Exploration expenses, including dry holes and lease impairment 122 79 201 General, administrative and other expenses 36 38 74 Depreciation, depletion and amortization 58 454 512 Total costs and expenses 287 963 1,250 Results of operations before income taxes 113 1,088 1,201 Provision for income taxes 44 574 618 Results of operations $ 69 $ 514 $ 583 Fourth Quarter 2006 United States International Total Sales and other operating revenues $ 244 $ 1,438 $ 1,682 Non-operating income 3 18 21 Total revenues and non-operating income 247 1,456 1,703 Costs and expenses Production expenses, including related taxes 59 299 358 Exploration expenses, including dry holes and lease impairment 94 46 140 General, administrative and other expenses 30 16 46 Depreciation, depletion and amortization 31 305 336 Total costs and expenses 214 666 880 Results of operations before income taxes 33 790 823 Provision for income taxes 12 461 473 Results of operations $ 21 $ 329 $ 350 Third Quarter 2007 United States International Total Sales and other operating revenues $ 296 $ 1,451 $ 1,747 Non-operating income 1 29 30 Total revenues and non-operating income 297 1,480 1,777 Costs and expenses Production expenses, including related taxes 80 314 394 Exploration expenses, including dry holes and lease impairment 79 52 131 General, administrative and other expenses 27 37 64 Depreciation, depletion and amortization 48 297 345 Total costs and expenses 234 700 934 Results of operations before income taxes 63 780 843 Provision for income taxes 25 404 429 Results of operations $ 38 $ 376 $ 414 7
- 8. HESS CORPORATION AND CONSOLIDATED SUBSIDIARIES EXPLORATION AND PRODUCTION EARNINGS (UNAUDITED) (IN MILLIONS OF DOLLARS) Year Ended December 31, 2007 United States International Total Sales and other operating revenues $ 1,211 $ 6,287 $ 7,498 Non-operating income 8 57 65 Total revenues and non-operating income 1,219 6,344 7,563 Costs and expenses Production expenses, including related taxes 280 1,301 1,581 Exploration expenses, including dry holes and lease impairment 302 213 515 General, administrative and other expenses 130 127 257 Depreciation, depletion and amortization 187 1,316 1,503 Total costs and expenses 899 2,957 3,856 Results of operations before income taxes 320 3,387 3,707 Provision for income taxes 125 1,740 1,865 Results of operations $ 195 $ 1,647 $ 1,842 Year Ended December 31, 2006 United States International Total Sales and other operating revenues $ 1,232 $ 5,292 $ 6,524 Non-operating income 385 43 428 Total revenues and non-operating income 1,617 5,335 6,952 Costs and expenses Production expenses, including related taxes 221 1,029 1,250 Exploration expenses, including dry holes and lease impairment 353 199 552 General, administrative and other expenses 95 114 209 Depreciation, depletion and amortization 127 1,032 1,159 Total costs and expenses 796 2,374 3,170 Results of operations before income taxes 821 2,961 3,782 Provision for income taxes 296 1,723 2,019 Results of operations $ 525 $ 1,238 $ 1,763 8
- 9. HESS CORPORATION AND CONSOLIDATED SUBSIDIARIES SUPPLEMENTAL OPERATING DATA (IN THOUSANDS, EXCEPT FOR AVERAGE SELLING PRICES) Fourth Fourth Third Quarter Quarter Quarter 2007 2006 2007 Operating Data Net Production Per Day Crude oil - barrels United States 34 29 31 Europe 83 111 83 Africa 121 89 123 Asia and other 22 13 20 Total 260 242 257 Natural gas liquids - barrels United States 11 9 11 Europe 5 7 3 Total 16 16 14 Natural gas - mcf United States 91 91 87 Europe 290 336 188 Asia and other 300 223 241 Total 681 650 516 Barrels of oil equivalent 390 366 357 Average Selling Price Crude oil - per barrel (including hedging) United States $ 86.22 $ 53.64 $ 73.20 Europe 74.00 50.01 62.06 Africa 72.85 49.77 64.38 Asia and other 86.30 57.09 70.69 Worldwide 76.11 50.76 65.26 Crude oil - per barrel (excluding hedging) United States $ 86.22 $ 53.64 $ 73.20 Europe 74.00 51.79 62.06 Africa 84.84 57.11 73.49 Asia and other 86.30 57.09 70.69 Worldwide 81.87 54.46 69.85 Natural gas liquids - per barrel United States $ 63.51 $ 43.68 $ 51.27 Europe 70.86 45.19 48.44 Worldwide 66.13 44.33 50.58 Natural gas - per mcf United States $ 6.47 $ 6.27 $ 5.80 Europe 8.92 5.55 6.09 Asia and other 5.13 4.39 4.69 Worldwide 6.93 5.25 5.38 9
- 10. HESS CORPORATION AND CONSOLIDATED SUBSIDIARIES SUPPLEMENTAL OPERATING DATA (IN THOUSANDS, EXCEPT FOR AVERAGE SELLING PRICES) Year Ended December 31, 2007 2006 Operating Data Net Production Per Day Crude oil - barrels United States 31 36 Europe 93 109 Africa 115 85 Asia and other 21 12 Total 260 242 Natural gas liquids - barrels United States 10 10 Europe 5 5 Total 15 15 Natural gas - mcf United States 88 110 Europe 259 283 Asia and other 266 219 Total 613 612 Barrels of oil equivalent 377 359 Average Selling Price Crude oil - per barrel (including hedging) United States $ 69.23 $ 60.45 Europe 60.99 56.19 Africa 62.04 51.18 Asia and other 72.17 61.52 Worldwide 63.44 55.31 Crude oil - per barrel (excluding hedging) United States $ 69.23 $ 60.45 Europe 60.99 58.46 Africa 71.71 62.80 Asia and other 72.17 61.52 Worldwide 67.79 60.41 Natural gas liquids - per barrel United States $ 51.89 $ 46.22 Europe 57.20 47.30 Worldwide 53.72 46.59 Natural gas - per mcf United States $ 6.67 $ 6.59 Europe 6.13 6.20 Asia and other 4.71 4.05 Worldwide 5.60 5.50 10
- 11. HESS CORPORATION AND CONSOLIDATED SUBSIDIARIES EXPLORATION AND PRODUCTION SUPPLEMENTAL HEDGING INFORMATION (UNAUDITED) The following is a summary of the Corporation’s outstanding crude oil hedges at December 31, 2007: Brent Crude Oil* Average Thousands of Selling Price barrels per day Maturity 2008 $ 25.56 24 2009 25.54 24 2010 25.78 24 2011 26.37 24 2012 26.90 24 * There were no WTI crude oil or natural gas hedges outstanding at December 31, 2007. The after-tax losses from crude oil hedges were $89 million in the fourth quarter of 2007 and $57 million in the fourth quarter of 2006. After-tax hedge losses totaled $244 million and $285 million for the years ended December 31, 2007 and 2006, respectively. The after-tax deferred hedge loss included in accumulated other comprehensive income at December 31, 2007 amounted to $1.7 billion. 11
- 12. HESS CORPORATION AND CONSOLIDATED SUBSIDIARIES MARKETING AND REFINING SUPPLEMENTAL FINANCIAL AND OPERATING DATA (UNAUDITED) Fourth Fourth Third Quarter Quarter Quarter 2007 2006 2007 Financial Information (in millions of dollars) Marketing and Refining Earnings Income before income taxes $ 51 $ 104 $ 75 Provision for income taxes 20 37 29 Marketing and Refining Earnings $ 31 $ 67 $ 46 Summary of Marketing and Refining Earnings Refining $ 27 $ 45 $ 25 Marketing 19 17 21 Trading (15) 5 - Total Marketing and Refining Earnings $ 31 $ 67 $ 46 Operating Data (in thousands unless noted) Refined Product Sales (barrels per day) Gasoline 205 210 216 Distillates 163 169 134 Residuals 57 57 45 Other 37 33 42 Total 462 469 437 Refinery Throughput (barrels per day) HOVENSA - Crude runs 488 469 459 HOVENSA - Hess 50% share 244 234 230 Port Reading 63 64 61 Refinery Utilization Refinery Capacity HOVENSA (barrels per day) Crude 500 97.6% 93.7% 91.9% FCC 150 84.9% 91.2% 82.4% Coker 58 99.3% 89.8% 92.6% Port Reading 65 96.3% 98.1% 93.8% Retail Marketing Number of retail stations (a) 1,371 1,350 1,362 Convenience store revenue (in millions of dollars) (b) $ 255 $ 253 $ 279 Average gasoline volume per station (gallons per month) (b) 209 202 232 (a) Includes company operated, Wilco-Hess, dealer and branded retailer. (b) Company operated only. 12
- 13. HESS CORPORATION AND CONSOLIDATED SUBSIDIARIES MARKETING AND REFINING SUPPLEMENTAL FINANCIAL AND OPERATING DATA (UNAUDITED) Year Ended December 31, 2007 2006 Financial Information (in millions of dollars) Marketing and Refining Earnings Income before income taxes $ 481 $ 620 Provision for income taxes 181 226 Marketing and Refining Earnings $ 300 $ 394 Summary of Marketing and Refining Earnings Refining $ 193 $ 240 Marketing 83 108 Trading 24 46 Total Marketing and Refining Earnings $ 300 $ 394 Operating Data (in thousands unless noted) Refined Product Sales (barrels per day) Gasoline 210 218 Distillates 147 144 Residuals 62 60 Other 32 37 Total 451 459 Refinery Throughput (barrels per day) HOVENSA - Crude runs 454 448 HOVENSA - Hess 50% share 227 224 Port Reading 61 63 Refinery Utilization Refinery Capacity HOVENSA (barrels per day) Crude 500 90.8% 89.7% FCC 150 87.1% 84.3% Coker 58 83.4% 84.3% Port Reading 65 93.2% 97.4% Retail Marketing Number of retail stations (a) 1,371 1,350 Convenience store revenue (in millions of dollars) (b) $ 1,051 $ 1,015 Average gasoline volume per station (gallons per month) (b) 215 208 (a) Includes company operated, Wilco-Hess, dealer and branded retailer. (b) Company operated only. 13