

Recommended
More Related Content
What's hot
What's hot (19)
Similar to Current Thinking, Q1 2014
Similar to Current Thinking, Q1 2014 (20)
Recently uploaded
Recently uploaded (20)
Current Thinking, Q1 2014
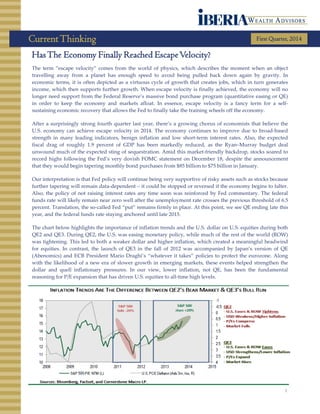
- 1. CurrentThinking First Quarter, 2014 1 The term “escape velocity” comes from the world of physics, which describes the moment when an object travelling away from a planet has enough speed to avoid being pulled back down again by gravity. In economic terms, it is often depicted as a virtuous cycle of growth that creates jobs, which in turn generates income, which then supports further growth. When escape velocity is finally achieved, the economy will no longer need support from the Federal Reserve’s massive bond purchase program (quantitative easing or QE) in order to keep the economy and markets afloat. In essence, escape velocity is a fancy term for a self- sustaining economic recovery that allows the Fed to finally take the training wheels off the economy. After a surprisingly strong fourth quarter last year, there’s a growing chorus of economists that believe the U.S. economy can achieve escape velocity in 2014. The economy continues to improve due to broad-based strength in many leading indicators, benign inflation and low short-term interest rates. Also, the expected fiscal drag of roughly 1.9 percent of GDP has been markedly reduced, as the Ryan–Murray budget deal unwound much of the expected sting of sequestration. Amid this market-friendly backdrop, stocks soared to record highs following the Fed’s very dovish FOMC statement on December 18, despite the announcement that they would begin tapering monthly bond purchases from $85 billion to $75 billion in January. Our interpretation is that Fed policy will continue being very supportive of risky assets such as stocks because further tapering will remain data-dependent – it could be stopped or reversed if the economy begins to falter. Also, the policy of not raising interest rates any time soon was reinforced by Fed commentary. The federal funds rate will likely remain near zero well after the unemployment rate crosses the previous threshold of 6.5 percent. Translation, the so-called Fed “put” remains firmly in place. At this point, we see QE ending late this year, and the federal funds rate staying anchored until late 2015. The chart below highlights the importance of inflation trends and the U.S. dollar on U.S. equities during both QE2 and QE3. During QE2, the U.S. was easing monetary policy, while much of the rest of the world (ROW) was tightening. This led to both a weaker dollar and higher inflation, which created a meaningful headwind for equities. In contrast, the launch of QE3 in the fall of 2012 was accompanied by Japan’s version of QE (Abenomics) and ECB President Mario Draghi’s “whatever it takes” policies to protect the eurozone. Along with the likelihood of a new era of slower growth in emerging markets, these events helped strengthen the dollar and quell inflationary pressures. In our view, lower inflation, not QE, has been the fundamental reasoning for P/E expansion that has driven U.S. equities to all-time high levels. HasThe Economy Finally Reached EscapeVelocity?
- 2. 2 China is facing both cyclical and structural headwinds, and its influence on both the emerging world and U.S. has meaningful significance for investors. Regarding cyclical pressures, interest rates in China are near the highest levels in 10 years, which is troublesome for a debt-driven economy. Government efforts to curb a decade-long excess in credit creation along with stronger economic growth in developed countries like the U.S. has led to higher interest rates around the world. The subsequent tightening of financial conditions has resulted in a decline among many leading indicators due to reduced consumer and business spending. This has led to weaker corporate earnings, causing many businesses to curtail capital spending and hiring. As a result of potentially stagflationary conditions, we’re anticipating continued relative weakness in Chinese equities compared to most developed world countries. Rebalancing in China Signals the End of the Commodity Super Cycle China’s Economy Likely to Stumble Instead of Trot in theYear of the Horse China is also facing key reforms and structural factors that include an aging population, and the end of cheap underemployed agricultural labor. An important government reform initiative involves the need to rebalance the economy from an unsustainable 48 percent of GDP in resource intensive investments like infrastructure, to a more consumption based economy. Investments have been the engine of China’s job creation, with the employment multiplier three times larger for investments than consumption. This transition suggests that consensus growth estimates for China may be overstated. Also, increasing awareness of huge capital misallocations in ghost cities like Tieling provide a clear example that the so-called commodity super cycle, driven by China’s investment boom has ended. Higher Rates Declining Leading Indicators Weak Earnings Source: Cornerstone Macro Zhengzhou As a result, commodity producing countries such as Australia, Canada and Brazil are expected to continue feeling the negative effects of slower growth and currency depreciation. In contrast, improving growth trends in most developed countries should support higher growth in exports for China and other export-based economies like South Korea and Taiwan. However, this will likely be accompanied by higher funding costs as the Fed continues to taper QE. Zhengzhou Source: Wall Street Journal
- 3. 3 Although China constitutes only 11 percent of world GDP, it is the marginal price setter of commodity prices, representing more than 40 percent of the global consumption of many commodities. China’s transition to a consumption-driven economy should produce a slower pace of economic growth, and less demand for commodities. Therefore, the expected decline in commodity prices can be thought of as a tax cut on food and energy spending for U.S. consumers. Slowdown in China Fuels Liftoff in the U.S. Inflation RemainsWell Below the Fed’sTarget Rate December’s core PCE inflation rate (the Fed’s preferred gauge of inflation), came in at an anemic 1.2 percent annual rate, well below the Fed’s target rate of 2 percent. This ongoing disinflationary trend in core PCE remains troubling for the Fed. As the Fed begins to taper the pace of QE, their policy on the path of short-term interest rates may be a more important driver of asset prices in 2014. Low rates can support equities in various ways, such as lower borrowing costs, higher profits and higher valuations. Also, short-term rates have a larger impact on corporate earnings, since most business loans have variable rates. 200 250 300 350 400 450 500 Jan-07 Jul-07 Jan-08 Jul-08 Jan-09 Jul-09 Jan-10 Jul-10 Jan-11 Jul-11 Jan-12 Jul-12 Jan-13 Jul-13 Thomson Reuters/Jefferies CRB Commodity Index Source: FactSet -2.0 0.0 2.0 4.0 6.0 Jan-07 Jul-07 Jan-08 Jul-08 Jan-09 Jul-09 Jan-10 Jul-10 Jan-11 Jul-11 Jan-12 Jul-12 Jan-13 Jul-13 Headline and Core PCE, % Change Year Ago, SA Source: U.S. Dept. of Commerce, BEA Headline PCE Core PCE (ex Food and Energy) Consumption-based economies like the U.S. are very sensitive to the trend in inflation. Lower inflationary pressures in the U.S. have clearly led to an improving economy, and this provides the foundation for a stronger U.S. dollar as well as higher interest rates. Rather than being a headwind for U.S. equities, the Fed’s tapering of QE actually supports a stronger dollar. With many commodities traded in U.S. dollar terms, a strong dollar fosters higher growth via lower imported inflation. For example, U.S. GDP may be able to rise above 4.0 percent without stoking a rise in gasoline prices. These dynamics have been important factors in the surge to record high stock prices, led by multiple expansion. The coinciding broad-based strength in many leading indicators suggest that earnings growth may surprise to the upside in support of current equity valuations. As the Fed has expressed growing concern about the net benefit of QE, they may be willing to exchange a faster tapering of QE for a longer period of ZIRP (zero interest rate policy). At this point, it doesn’t appear that the Fed will raise rates until mid-2015 at the earliest. When it eventually starts, the pace is expected to be much slower than the typical 25 bps per meeting pace in previous cycles. At least for now, the current market-implied pace of rate increases in 2015 is aligned with the Fed’s “forward guidance.”
- 4. 4 Disclosures Views are as of the date above and are subject to change based on market conditions and other factors. The views expressed are those of the author(s) and are subject to change at any time. These views are for informational purposes only and should not be relied upon as a recommendation to purchase any security or as a solicitation or investment advice from the Advisor. The information contained in this presentation has been compiled from third party sources and is believed to be reliable, but its accuracy is not guaranteed and should not be relied upon in any way, whatsoever. This information does not constitute, and should not be construed as, investment advice or recommendations with respect to the securities or sectors listed. Diversification and asset allocation do not assure a profit nor protect against loss. The actual return and value of an account fluctuate and, at any time, the account may be worth more or less than the amount invested. Past performance results are not indicative of future results. IRS Circular 230 Disclosure - To ensure compliance with requirements imposed by the IRS, we inform you that any U.S. federal tax advice contained in this communication (including any attachments) is not intended or written to be used, and cannot be used, for the purpose of (i) avoiding penalties under the Internal Revenue Code or (ii) promoting, marketing or recommending to another party any transaction or matter addressed herein. Presentation is prepared by: IBERIA Wealth Advisors Copyright © 2013, by IBERIA Wealth Advisors; All rights reserved. Investment Products: • Not FDIC Insured • Not a Bank Deposit • Not Insured By Any Federal Government Agency • No Bank Guarantee • May Lose Value (800) 667-6176 www.iberiawealth.com The S&P 500 closed the year at 1848, delivering a total return of 32.4 percent. This was the highest yearly return since 1997, and the fourth highest over the last 40 years. With U.S. equities trading much closer to fair value, we believe that corporate earnings growth will be the dominant driver of equities this year, not P/E multiple expansion. It’s worth noting that the S&P 500 NTM (next 12 months) P/E multiple expanded from 13x to 16x in 2013, and accounted for almost 80 percent of the price return. We remain tactically overweight in U.S. equities, based on expectations of stronger earnings growth and further potential upside surprises in U.S. economic activity. While dividends remain important to many investors, we believe that large dividend- growth companies with high cash flow are more attractively valued than stocks with very high but stagnant yields. Our continued underweight allocation to emerging markets remains a high conviction thesis due to our forecast for rising inflationary pressures, a stronger U.S. dollar and the problematic unwinding of a decade- long credit boom in China. The higher trajectory of economic growth in the U.S. and gradual winding down of QE has reinforced our focus on bonds with shorter maturities. Although credit spreads for corporate and municipal bonds are tight, we continue to find marginal relative value in these sectors compared with Treasuries. Our overweight allocation to alternative assets remains in place primarily due to the improved risk/return profile versus fixed income. For example, we currently favor long/short strategies that include both stocks and bonds, which can offer both a differentiated source of return and reduce portfolio volatility. Kevin A. Lenox, CFA Senior Investment Strategist / Portfolio Manager Moving From Expectation toValidation