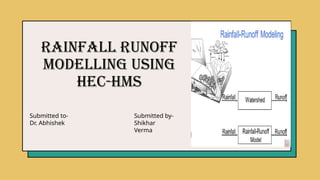
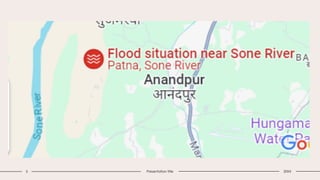
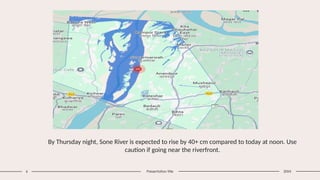
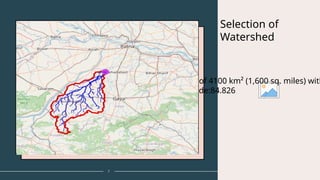
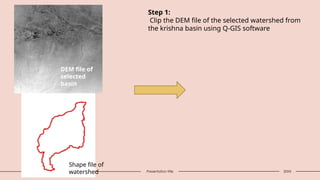
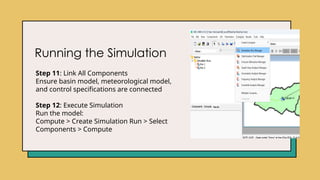
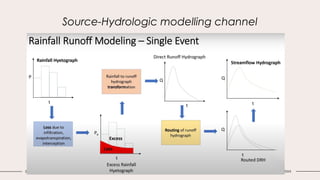
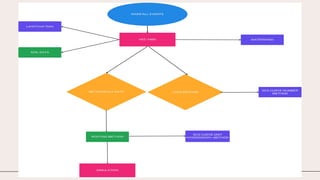
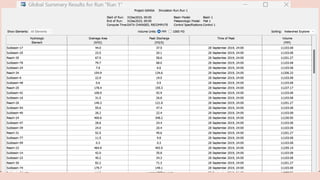
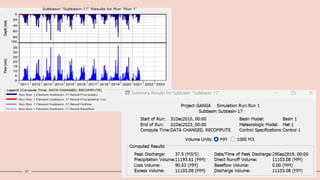
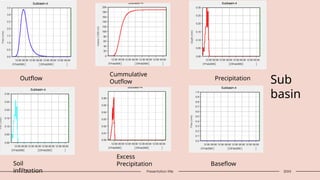
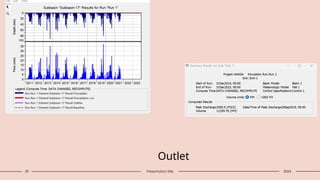
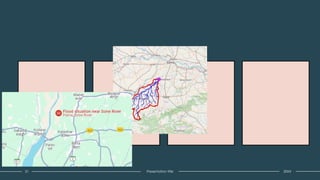
Rainfall Runoff
modelling using
HEC-HMS
​
Submitted to-
Dr. Abhishek
Submitted by-
Shikhar
Verma
2 Presentation title
Agenda
1 2 3 4 5
Study Area Selection of
watershed
Steps
involved in
modelling
Parameters
estimation
Results
20XX
3
Study Area: Southern part of Bihar,
(Outlet- 25.214, 84.826.,
Area-4,100 km² )
•Watershed Area: Covers 4,100 km² near the Sone
River, a tributary of the Ganga.
•Location: Situated between latitude 25.214 and
longitude 84.826 in southern Bihar, near the Sone-
Ganga confluence.
•Elevation: Ranges from approximately 100 to 250 m
above mean sea level.
•Flooding History: Known for frequent monsoon
flooding due to heavy seasonal rainfall and
sedimentation in the Sone River.
.
4
•Rainfall: Monsoonal climate, with an average annual rainfall
of 900-1,200 mm. Significant runoff occurs during monsoon
months (June-September).
•Land Use: Primarily agricultural, with rice, wheat, and
sugarcane cultivation. Increasing rural settlement density
near the riverbanks.
•Hydrological Challenges: The absence of major water
regulation structures within the immediate watershed
increases flood vulnerability.
•Modeling Consideration: Ideal for HEC-HMS modeling
due to seasonal flooding risks and agricultural importance,
with a focus on flood mitigation and runoff management.
5 Presentation title 20XX
By Thursday night, Sone River is expected to rise by 40+ cm compared to today at noon. Use
caution if going near the riverfront.
6 Presentation title 20XX
7
Delineated a watershed of 4100 km² (1,600 sq. miles) with
Latitude:25.214, Longitude:84.826
Selection of
Watershed
Steps
Involved
9 Presentation title 20XX
DEM file of
selected
basin
Shape file of
watershed
Step 1:
Clip the DEM file of the selected watershed from
the krishna basin using Q-GIS software
10 Presentation title 20XX
11 Presentation title 20XX
Basin Model Setup
Step 2: Define Basin Boundaries
•Import GIS data to delineate watershed boundaries
•Use tools like Q-GIS or Arc-GIS for GIS integration
After applying flow
direction and flow
accumulation.
Watershed
boundaries
Adding Sub-Basins and
Reaches
Step 3:
Subdivide the watershed
• Add sub-basins: Components > Basin Model > Add Sub
• Define river reaches: Components > Basin Model > Add
• The catchment is divided into 89 sub-basins and 9 reac
Meteorological
Model Setup
Step 5:
• Input Rainfall Data Historical data,
synthetic storms, or real-time data.
• Create a meteorological model:
Components > Meteorological
Model
Linking Meteorological
Model
Step 6: Link to Basin Model
• Specify rainfall distribution over the
basin.
• Assign the meteorological model to
the basin model.
Control Specifications
Step 7: Define Simulation Period
• Set start and end times:
Components > Control Specifications.
• Define the time step for simulation
Model Parameters
Step 8: Choose Loss Method
We choose SCS Curve Number method
Step 9: Select Transform Method
We choose SCS Unit Hydrograph.
Average value of curve number for the sub-
basins from Google Earth
18 Presentation title 20XX
Sub-basin characteristics
19 Presentation title 20XX
Lag Time Computations (0.6 times of Tc)
20 Presentation title 20XX
Excel sheet for Lag time computations
21 Presentation title 20XX
Parameters feed into software
22 Presentation title 20XX
Running the Simulation
Step 11: Link All Components
Ensure basin model, meteorological model,
and control specifications are connected
Step 12: Execute Simulation
Run the model:
Compute > Create Simulation Run > Select
Components > Compute
Source-Hydrologic modelling channel
24 Presentation title 20XX
25 Presentation title 20XX
26 Presentation title 20XX
27 Presentation title 20XX
28 Presentation title 20XX
Outflow
Baseflow
Soil
infiltration
Excess
Precipitation
Precipitation
Cummulative
Outflow Sub
basin
29 Presentation title 20XX
Outlet
Thank you
31 Presentation title 20XX
32 Presentation title 20XX
33 Presentation title
Quarterly performance
Q4
Q3
Q2
Q1
0 1 2 3 4 5 6
Series 1 Series 2 Series 3
20XX
34 Presentation title
Areas of growth
B2B Supply chain ROI E-commerce
Q1 4.5 2.3 1.7 5.0
Q2 3.2 5.1 4.4 3.0
Q3 2.1 1.7 2.5 2.8
Q4 4.5 2.2 1.7 70
20XX
Business opportunities are
like buses. There’s always
another one coming.
“Richard Branson
”
35 Presentation title 20XX
36 Presentation title
Meet our team
Takuma Hayashi
President
Mirjam Nilsson
Chief Executive Officer
Flora Berggren
Chief Operations Officer
Rajesh Santoshi
VP Marketing
20XX
Meet our extended team
Takuma Hayashi
President
Graham Barnes
VP Product
Mirjam Nilsson
Chief Executive Officer
Rowan Murphy
SEO Strategist
Flora Berggren
Chief Operations Officer
Elizabeth Moore
Product Designer
Rajesh Santoshi
VP Marketing
Robin Kline
Content Developer
Plan for
product
launch
Planning
Synergize scalable e-commerce
Marketing
Disseminate standardized metrics
Design
Coordinate e-business applications
Strategy
Foster holistically superior methodologies
Launch
Deploy strategic networks with compelling e-
business needs
Timeline
Sep 20XX
Synergize scalable
e-commerce
Jan 20XX
Coordinate e-business
applications
May 20XX
Deploy strategy
networks with
compelling e-business
needs
Nov 20XX
Disseminate
standardized
metrics
Mar 20XX
Foster holistically
superior methodologies
40 Presentation title
Areas of focus
B2B market
scenarios​
•Develop winning strategies to keep ahead of the competition
•Capitalize on low-hanging fruit to identify a ballpark value
•Visualize customer directed convergence
Cloud-based
opportunities
•Iterative approaches to corporate strategy
•Establish a management framework from the inside
20XX
41 Presentation title
How we get there​
ROI​
Envision multimedia-
based expertise and cross-
media growth strategies​
Visualize quality
intellectual capital​
Engage worldwide
methodologies with web-
enabled technologies​
​
Niche markets
Pursue scalable customer
service through
sustainable strategies​
Engage top-line web
services with cutting-edge
deliverables​
Supply chains​
Cultivate one-to-one
customer service with
robust ideas​
Maximize timely
deliverables for real-time
schemas
20XX
42
Summary
At Contoso, we believe in giving 110%. By using
our next-generation data architecture, we help
organizations virtually manage agile workflows.
We thrive because of our market knowledge and
great team behind our product. As our CEO
says, “Efficiencies will come from proactively
transforming how we do business.”

Rainfall Runoff modelling using HEC-HMS.pptx

  • 1.
    Rainfall Runoff modelling using HEC-HMS ​ Submittedto- Dr. Abhishek Submitted by- Shikhar Verma
  • 2.
    2 Presentation title Agenda 12 3 4 5 Study Area Selection of watershed Steps involved in modelling Parameters estimation Results 20XX
  • 3.
    3 Study Area: Southernpart of Bihar, (Outlet- 25.214, 84.826., Area-4,100 km² ) •Watershed Area: Covers 4,100 km² near the Sone River, a tributary of the Ganga. •Location: Situated between latitude 25.214 and longitude 84.826 in southern Bihar, near the Sone- Ganga confluence. •Elevation: Ranges from approximately 100 to 250 m above mean sea level. •Flooding History: Known for frequent monsoon flooding due to heavy seasonal rainfall and sedimentation in the Sone River. .
  • 4.
    4 •Rainfall: Monsoonal climate,with an average annual rainfall of 900-1,200 mm. Significant runoff occurs during monsoon months (June-September). •Land Use: Primarily agricultural, with rice, wheat, and sugarcane cultivation. Increasing rural settlement density near the riverbanks. •Hydrological Challenges: The absence of major water regulation structures within the immediate watershed increases flood vulnerability. •Modeling Consideration: Ideal for HEC-HMS modeling due to seasonal flooding risks and agricultural importance, with a focus on flood mitigation and runoff management.
  • 5.
  • 6.
    By Thursday night,Sone River is expected to rise by 40+ cm compared to today at noon. Use caution if going near the riverfront. 6 Presentation title 20XX
  • 7.
    7 Delineated a watershedof 4100 km² (1,600 sq. miles) with Latitude:25.214, Longitude:84.826 Selection of Watershed
  • 8.
  • 9.
    9 Presentation title20XX DEM file of selected basin Shape file of watershed Step 1: Clip the DEM file of the selected watershed from the krishna basin using Q-GIS software
  • 10.
  • 11.
  • 12.
    Basin Model Setup Step2: Define Basin Boundaries •Import GIS data to delineate watershed boundaries •Use tools like Q-GIS or Arc-GIS for GIS integration After applying flow direction and flow accumulation. Watershed boundaries
  • 13.
    Adding Sub-Basins and Reaches Step3: Subdivide the watershed • Add sub-basins: Components > Basin Model > Add Sub • Define river reaches: Components > Basin Model > Add • The catchment is divided into 89 sub-basins and 9 reac
  • 14.
    Meteorological Model Setup Step 5: •Input Rainfall Data Historical data, synthetic storms, or real-time data. • Create a meteorological model: Components > Meteorological Model
  • 15.
    Linking Meteorological Model Step 6:Link to Basin Model • Specify rainfall distribution over the basin. • Assign the meteorological model to the basin model.
  • 16.
    Control Specifications Step 7:Define Simulation Period • Set start and end times: Components > Control Specifications. • Define the time step for simulation
  • 17.
    Model Parameters Step 8:Choose Loss Method We choose SCS Curve Number method Step 9: Select Transform Method We choose SCS Unit Hydrograph.
  • 18.
    Average value ofcurve number for the sub- basins from Google Earth 18 Presentation title 20XX
  • 19.
  • 20.
    Lag Time Computations(0.6 times of Tc) 20 Presentation title 20XX
  • 21.
    Excel sheet forLag time computations 21 Presentation title 20XX
  • 22.
    Parameters feed intosoftware 22 Presentation title 20XX
  • 23.
    Running the Simulation Step11: Link All Components Ensure basin model, meteorological model, and control specifications are connected Step 12: Execute Simulation Run the model: Compute > Create Simulation Run > Select Components > Compute
  • 24.
  • 25.
  • 26.
  • 27.
  • 28.
    28 Presentation title20XX Outflow Baseflow Soil infiltration Excess Precipitation Precipitation Cummulative Outflow Sub basin
  • 29.
  • 30.
  • 31.
  • 32.
  • 33.
    33 Presentation title Quarterlyperformance Q4 Q3 Q2 Q1 0 1 2 3 4 5 6 Series 1 Series 2 Series 3 20XX
  • 34.
    34 Presentation title Areasof growth B2B Supply chain ROI E-commerce Q1 4.5 2.3 1.7 5.0 Q2 3.2 5.1 4.4 3.0 Q3 2.1 1.7 2.5 2.8 Q4 4.5 2.2 1.7 70 20XX
  • 35.
    Business opportunities are likebuses. There’s always another one coming. “Richard Branson ” 35 Presentation title 20XX
  • 36.
    36 Presentation title Meetour team Takuma Hayashi President Mirjam Nilsson Chief Executive Officer Flora Berggren Chief Operations Officer Rajesh Santoshi VP Marketing 20XX
  • 37.
    Meet our extendedteam Takuma Hayashi President Graham Barnes VP Product Mirjam Nilsson Chief Executive Officer Rowan Murphy SEO Strategist Flora Berggren Chief Operations Officer Elizabeth Moore Product Designer Rajesh Santoshi VP Marketing Robin Kline Content Developer
  • 38.
    Plan for product launch Planning Synergize scalablee-commerce Marketing Disseminate standardized metrics Design Coordinate e-business applications Strategy Foster holistically superior methodologies Launch Deploy strategic networks with compelling e- business needs
  • 39.
    Timeline Sep 20XX Synergize scalable e-commerce Jan20XX Coordinate e-business applications May 20XX Deploy strategy networks with compelling e-business needs Nov 20XX Disseminate standardized metrics Mar 20XX Foster holistically superior methodologies
  • 40.
    40 Presentation title Areasof focus B2B market scenarios​ •Develop winning strategies to keep ahead of the competition •Capitalize on low-hanging fruit to identify a ballpark value •Visualize customer directed convergence Cloud-based opportunities •Iterative approaches to corporate strategy •Establish a management framework from the inside 20XX
  • 41.
    41 Presentation title Howwe get there​ ROI​ Envision multimedia- based expertise and cross- media growth strategies​ Visualize quality intellectual capital​ Engage worldwide methodologies with web- enabled technologies​ ​ Niche markets Pursue scalable customer service through sustainable strategies​ Engage top-line web services with cutting-edge deliverables​ Supply chains​ Cultivate one-to-one customer service with robust ideas​ Maximize timely deliverables for real-time schemas 20XX
  • 42.
    42 Summary At Contoso, webelieve in giving 110%. By using our next-generation data architecture, we help organizations virtually manage agile workflows. We thrive because of our market knowledge and great team behind our product. As our CEO says, “Efficiencies will come from proactively transforming how we do business.”