Downloaded 137 times


![10
Introduction
Innovative and smart solutions are available in
some cities while in others the uptake is low
because the impacts of these solutions have not
been objectively verified and there is a lack of
confidence that the solutions can also be applied
in other contexts and cities. This transition can be
speeded up by enabling a progress monitor by
means of a common performance measurement
framework and real-time monitoring technolo-
gies. The aim of a city operating system is to
combine city level operation with co-operation
between local sub-systems in order to monitor
performance.
City systems help to monitor
progress and optimize processes
The aim of a city system is to combine city level
operation with co-operation between different
local systems in order to monitor performance
and optimize processes. Intelligence and inter-
operable interfaces are added between separate
systems, e.g. lighting systems, the energy grid
and mobility systems, in order to input informa-
tion from these into the city decision-making
services. Available solutions are often off-line and
ad-hoc, not replicable or suitable for comparisons
between cities. The new developments on fused
sensing, data monitoring technologies and the
Internet of Things (IoT) are key to efficient and
real-time collection of “raw” information from
various sources that are then enriched into
City monitoring and
operation systems
information through KPI calculations and further
into decision-making services.
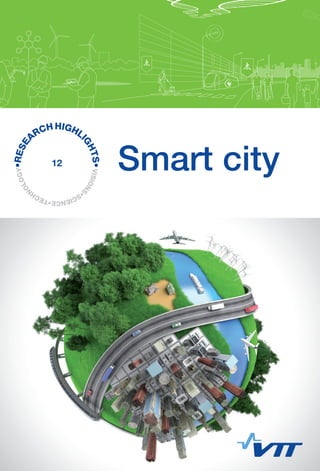
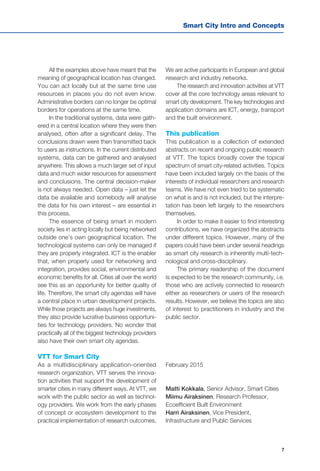
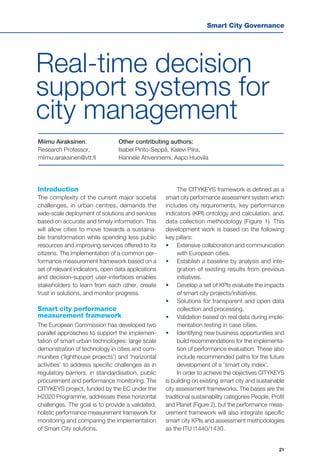
The performance measurement system
meta-data model and calculation method-
ologies are based on:
• Defining the required data sets to be col-
lected based on the specified indicators
• Identifying available data sources, their
reliability, accessibility and data models
• Specifying the collection system and calcu-
lation methodologies for the performance
measurements
• Integration into the system of intelligence
and interoperability interfaces between
separate systems, input specifications and
calculation methodology
• Development of user-friendly interface and
information visualization.
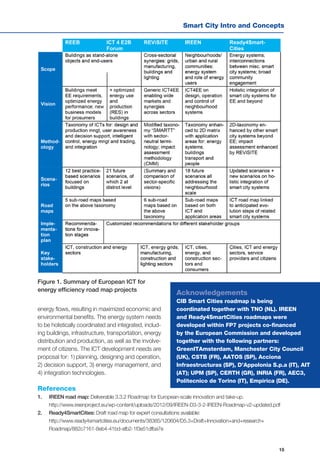
Figure 1 shows a schematic presentation of
the performance measurement system based
on an example of a collection of specific data
sets, the information processing, integration into
key performance indicators (KPIs) and finally an
example of a visualization interface [2,3].
Discussion
The development and implementation of city
operating systems will impact on the transition
to low-carbon, resource-efficient cities by cre-
Tuomo Tuikka,
Head of Research Area,
tuomo.tuikka@vtt.fi
Other contributing authors:
Isabel Pinto-Seppä, Daniel Pakkala, Miimu Airaksinen,
Johanna Kallio; Juhani Latvakoski](https://image.slidesharecdn.com/r12-150323055322-conversion-gate01/85/Smart-City-Research-Highlights-12-320.jpg)
![11
Smart City Intro and Concepts
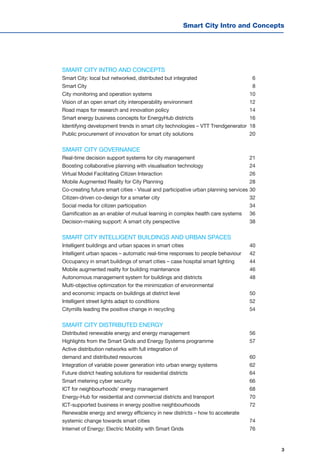
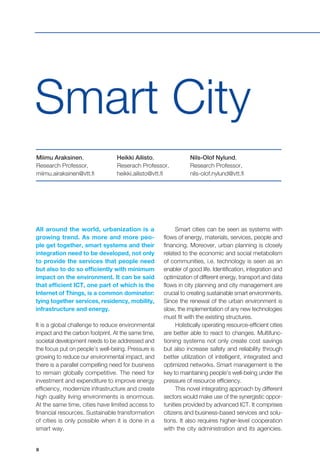
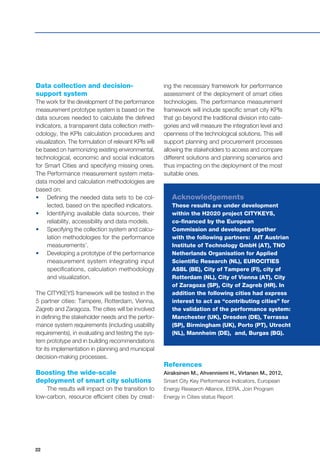
Citykeys data services
- Read data from different sources
- Calculate KPIs
- Show results
- Open APIs for e.g. city benchmarking
City KPIs
City of Tampere
Build environment, energy,
other non open raw data
Show city (or optionally
neighbourhoods) level
KPIs
Public transport
related open data
Selected area related
Visualized City KPIs
City systems data
services
City
systems
data
City
systems data
Other available open city
or neighbourhood(s)
level data
GHG emissions etc.
Raw data from
build environment
and city systems
Open city data APIs
City and neighbourhood
level data (database or
cloud)
Selected area: e.g.
City or neighbour-
hood(s)
Selected area:
city or neigbour-
hood(s)
Selected area: city or
neigbourhood(s)
ating the necessary framework for performance
assessment of the deployment of smart city
technologies. It will enable progress monitoring
by means of a common performance meas-
urement framework and real-time monitoring
technologies. This will allow cities to move
towards a sustainable transformation while
spending less public resources and improving
services offered to their citizens. Furthermore,
it will support planning and procurement pro-
cesses, allowing the stakeholders to access
and compare different solutions and planning
scenarios and thus impacting on the deployment
of the most suitable ones.
Acknowledgements
The research is under development
within the VTT spearhead programme
“Pro IoT, Productivity leap with Internet
of Things (IoT)” and VTT Innovation
programme “INGRID, Intelligent energy
grids and districts”.
(http://www.vtt.fi/research/spearhead_
and_innovation_programmes.jsp)
References
[1] European Commission (2013): European Innovation Partnership on Smart Cities and Communities,
Strategic Implementation Plan, 14.10.2013, http://ec.europa.eu/eip/smartcities/
[2] VTT Pro-Iot spearhead programme:
Productivity leap with Internet of things (IoT). http://www.vtt.fi/research/spearhead_iot.jsp
[3] M. Airaksinen, H. Ahvenniemi, M. Virtanen (2012): Smart City Key Performance Indicators,
European Energy Research Alliance, EERA, Join Program Energy in Cities status Report.](https://image.slidesharecdn.com/r12-150323055322-conversion-gate01/85/Smart-City-Research-Highlights-13-320.jpg)
![12
Introduction
The application of ICT in a city environment can
bring about a significant increase in productivity
and well-being. However, smart city solutions
seem to be fragmented across cities and sec-
tors, which subsequently leads to a situation
in which innovations do not diffuse widely and
reach their full potential. To address this prob-
lem, we envision an open and modular inter-
operability environment across cities and smart
city sectors. Here, we elaborate on the basic
concepts around this vision, namely, innovative
practices for public actors, a multi-actor mul-
ti-vendor business environment and a modular
ICT architecture that leverages synergies across
different smart city sectors and enables the cre-
ation and better diffusion of existing and new
services across cities.
Background
Cities are increasingly being empowered with
ICT. As the city core infrastructure and systems
become instrumented with sensors and as these
systems are interconnected to other systems,
new levels of intelligence and services can be
reached [1]. ICT has the potential, not only to
help address the problems that we see in our cit-
ies today – like congestion and wasted energy –
but also to offer new consumer experiences and
Vision of an open smart
city interoperability
environment
convenience and help to stimulate much needed
economic growth and job creation [2]. Although
the smart city concept has received much posi-
tive attention, if we look at the current reality and
the landscape around smart city solutions, an
observation can be made that they are heavily
fragmented. Artificial silos exist between sectors
(e.g. mobility, built environment and energy) and
there is very limited co-operation across cities.
Furthermore, a city often partners with a company
that then operates and manages the smart city
services on the city’s behalf. This often leads to
the city planner becoming a rather passive entity
and in turn to a vendor lock-in situation. Overall,
in this kind of market structure, innovations do
not diffuse and redundant isolated solutions are
repeatedly built for the same problems and needs.
Key themes for
enabling interoperability
Thus, it seems clear that there is a need for an
open and modular interoperability environment
for smart city solutions that spans across cities
and sectors. In such a model, cities would be
able to define a modular architecture together
with infrastructure vendors and service providers,
which in turn would form a basis for multi-ven-
dor solutions, continual innovation and progress.
To address fragmentation across sectors and
Thomas Casey,
Research Scientist,
thomas.casey@vtt.fi
Other contributing authors:
Ville Valovirta,
Minna Pikkarainen](https://image.slidesharecdn.com/r12-150323055322-conversion-gate01/85/Smart-City-Research-Highlights-14-320.jpg)
![13
Smart City Intro and Concepts
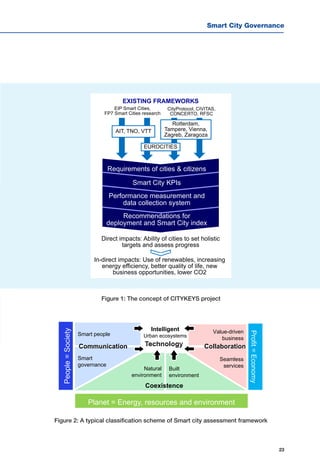
Common innovative
practicies for public actors
Multi-actor business
environment
Modular ICT-architecture Mobility
Builtenvironment
Energy
SmartCitySectorx
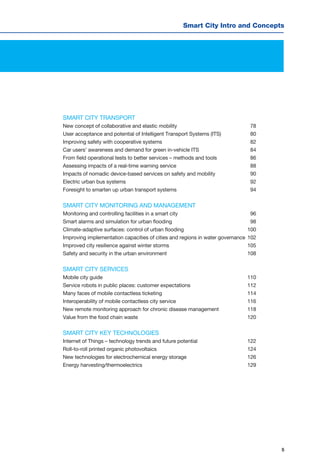
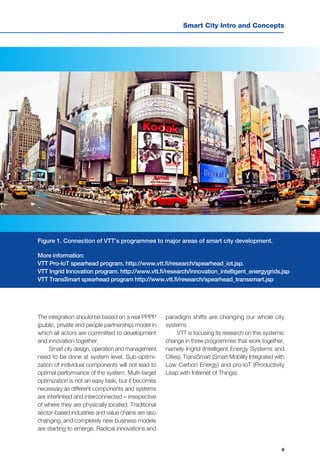
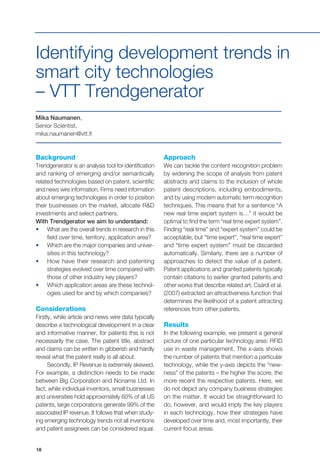
cities we see three important horizontal layers
in which modular and open processes need to
be planned (Figure 1):
1. Common innovative practices for public actors
related to, e.g., innovative procurement, regu-
lation and opening of common resources (e.g.
data) for the citizens’ use.
2. Multi-actor business ecosystems with mul-
tiple buyers and multiple vendors and service
providers all delivering their solutions over the
same modular ICT architecture.
3. Modular ICT architectures with commonly
agreed open interfaces, standards and an estab-
lished interoperability certification mechanism
for vendor products.
When planning these processes, important
lessons can be leveraged from other fields where,
e.g., the open interoperability environments
around GSM-based mobile communications
and the Internet can be used as examples [3].
Discussion
Overall, such a modular and open interopera-
bility environment for smart city solutions could
potentially connect demand and supply in a
more effective way, increase the size of the
existing markets and even create completely
new markets. On the demand side, entities pro-
curing systems could potentially remain better
in control of the systems and more easily com-
bine and switch between providers, thus induc-
ing competition and diffusion of the best ideas.
Furthermore, when there are many entities in the
market buying standardized solutions, vendors
and service providers can leverage economies
of scale and do not need to tailor solutions to
each customer. Nonetheless, the environment
would need to remain modular so that barriers
to market entry by smaller actors would be low,
and novel innovations combining functionalities
from the different smart city sectors would be
possible
References
[1] Dirks, S., Keeling, M. A vision of smarter
cities: How cities can lead the way into a
prosperous and sustainable future. IBM Insti-
tute for Business Value, 2009.
[2] Webb, M. et al. Information marketplaces,
the new economics of cities. The Climate
Group, London, 2011.
[3] Casey, T.R. Evolution of wireless access
provisioning: Understanding and managing
value system structures and dynamics, Doc-
toral Thesis, Aalto University, Espoo, 2013.
Figure 1. Key horizontal themes enabling interoperability.](https://image.slidesharecdn.com/r12-150323055322-conversion-gate01/85/Smart-City-Research-Highlights-15-320.jpg)
![16
€
Consumer
Prosumer
Producer
BROKER
Required input data:
Wholesale market
price
Required input data:
Energy consumption
Energy production
Price for produced
energy
Price for stored
energy
Owner of energy
storage
Energy
Energy
€
Introduction
Much effort has recently been put into research
and technical development for improving energy
efficiency, increasing the use of renewable energy
and improving districts’ energy systems. Many
of the technologies for these already exist, and
we have experience of integrating them together
into several pilot areas. However, the wide-scale
roll-out of sustainable district level energy sys-
tems is yet to come. Here, the development of
business models plays a key role in the wide-
scale implementation of new neighbourhood
energy systems.
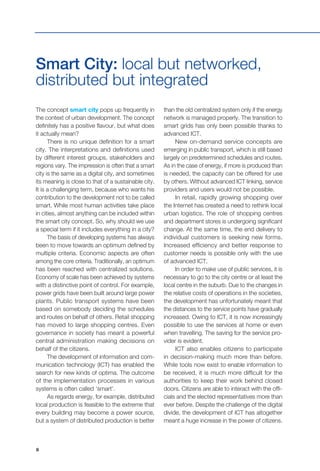
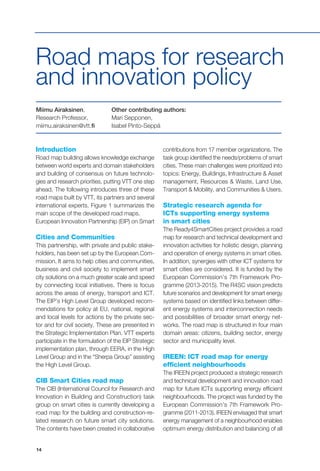
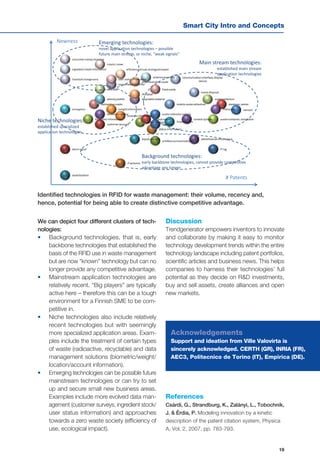
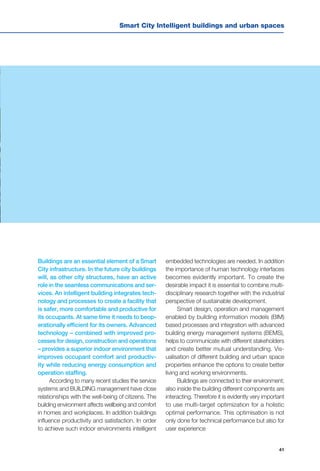
Smart energy business for
service providers and end-users
Energy hub systems optimize the use of renew-
able energy and required information exchange
in a district. An Energy Hub is “a physical cross
point, similar to an energy station, in which energy
and information streams are coordinated, and
where different forms of energy (heat, electricity,
chemical, biological) are converted between each
other or stored for later use” [1]. We have devel-
oped business and service concepts for Energy
Smart energy business concepts
for EnergyHub districts
Hub systems targeted at end-users and energy
service providers running practical actions in dis-
tricts’ energy business. An example of an energy
brokering service model is shown in Figure 1.
A cookbook – collection of
business concepts and elements
Business concepts are presented in a cookbook
form – a collection of 13 business and service
model recipes. Concepts describe the key idea,
interactions between the seller and the buyer
(Figure 1), key performance indicators measuring
its success, and costs and benefits. Concepts
are developed by modifying Osterwalder’s busi-
ness canvas method. They are based on stake-
holders’ interviews on the energy demand and
supply needs [2]. Concepts are kept simple and
focus on one stakeholder. Single business con-
cept elements can be combined into broader
and more specific business and service models
and networks. [3]
Flexibility is one of the
future energy commodities
Many of the business concepts (Figure 2) are
Mari Sepponen,
Senior Scientist,
mari.sepponen@vtt.fi
Other contributing authors:
Ismo Heimonen
Figure 1. Business concept for an energy
broker buying and selling energy](https://image.slidesharecdn.com/r12-150323055322-conversion-gate01/85/Smart-City-Research-Highlights-18-320.jpg)
![17
Smart City Intro and Concepts
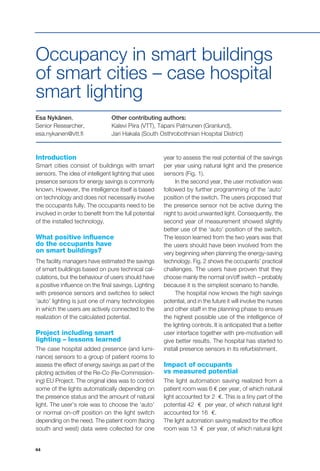
Figure 2. Business concept for an energy broker buying and selling energy
based on energy consumers and producers hav-
ing a certain amount of flexibility available in their
energy demand and supply. Flexibility is a new
aspect of the energy market and a commodity
that is used to create new business concepts.
However, there are currently some barriers related
to the legal framework and data privacy conser-
vation, but these can be overcome. In general,
parts of the proposed business concepts are
easily feasible today, while others require new
References
[1] Energy Hub project: Energy-Hub for residential and commercial districts and transport. Project web-
site [accessed 20.1.2014] http://www.e-hub.org/
[2] Virtanen Mikko, Heimonen Ismo, Sepponen Mari, 2014: Stakeholder analysis and questionnaire showing
the way for the development of business and service models. Renewable Energy Research Conference,
RERC 2014, conference proceedings. Oslo, Norway, June 16-18, 2014.
[3] Sepponen Mari, Heimonen Ismo, 2014: Development of business concepts for Energy Hub systems. Con-
ference proceedings ECOS 2014: 27th International Conference on Efficiency, Cost, Optimization, Simulation
and Environmental Impact of Energy Systems. Turku, Finland, June 15-19, 2014.
actors and roles that are not widely in existence
in the energy business.
Demonstration and feasibility studies
The performance of the proposed business mod-
els is tested in feasibility studies: in a real district
at Tweewaters in Belgium, as well as in four sim-
ulation case studies: Freiburg (Germany), Ber-
gamo (Italy), Houthavens (the Netherlands) and
Dalian (China).
Acknowledgements
The work is part of the project “E-Hub: Energy-Hub for residential and commercial districts
and transport”. The project is funded under the specific programme “Cooperation” in the
FP7 framework initiative “Energy efficient Buildings (EeB, FP7-2010-NMP-ENV-ENERGY-
ICT-EeB)”. The following co-workers and partners are acknowledged: Mikko Virtanen (VTT),
Frans Koene, Mieke Oostra and Cor Warmer (TNO); Kris Kessel (VITO); Reijo Kohonen (Global
EcoSolutions Ltd.); Paola Laiolo (Intesa Sanpaolo Eurodesk), Mauro Alberti (CESTEC) and
Bronia Jablonska (ECN), as well as other contributors via interviews and workshops.
Business concepts for energy service providers:
• Energy broker buying and selling energy
• Flexible energy tariffs for (residential) consumers
• ESCO minimising customers' energy bills and
optimising energy usage
Business models for new roles:
• Heat recovery of excess heat utilised in district
heating and cooling
• Prosumer selling self-produced energy
Business concepts for energy producers and
energy companies:
• Heat storage utilised in district heating and/
or cooling
• Flexibility in electricity network by heat pump
to avoid peak power
Co-operative ownership of district
heating network
Business concepts for offering flexibility in energy demand and supply:
• Flexibility for energy retailer's portfolio management
• Flexibility enabling maximised utilisation of locally produced energy
• Flexibility for local network management enabling maximised renewable energy supply
• Flexibility for balancing services to the balancing responsible party and transmission system operator
• Flexibility for local balancing at district level](https://image.slidesharecdn.com/r12-150323055322-conversion-gate01/85/Smart-City-Research-Highlights-19-320.jpg)
![24
Janne Porkka,
Senior Scientist,
janne.porkka@vtt.fi
Other contributing authors:
Mirkka Rekola,
Timo Kuula
Boosting collaborative
planning with
visualisation technology
Introduction
Communication in large construction projects
involves a great number of stakeholders, which
is a special challenge for interaction. Many
stakeholders view the process from different
perspectives [1]. For collaborative planning,
design visualisation offers a meaningful way to
convey messages and reduce communication
difficulties [2]. Immersive virtual environments
are increasingly used in large projects to assist
stakeholder interaction.
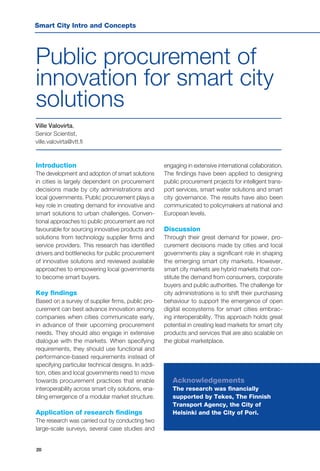
Majority of experts
value virtual models
The benefits of visualisation in group-context
include gains in productivity, quality and knowl-
edge [3]. We collected feedback in VIREsmart
project [4] from using virtual models as a pres-
entation tool along traditional tools in nine expert
meetings at two large construction projects in
Finland. Results indicate that visually represented
plans are introduced more rapidly to stakehold-
ers, which leads to more balanced interaction
between consults, experts and client. Altogether,
75% of experts felt that they understood the
plan better with virtual model and as high as
90% wanted to use virtual models in the future.
Visual working led to
2-4 times more comments
We have used activity theory [5] as a framework
for observing and analysing the effects of virtual
reality on interaction and related work practices.
The amount of comments participants made
during discussions was used as an indicator
for participation. Especially client and experts
appreciated the visual interaction, and plans
were often reflected to opinions and regional
comments. We also noticed that virtual models
as a medium led to 2 to 4 times more com-
ments in the discussions when compared to
the traditional tools.
Efficient group work
at VTT ‘Creation Lab’
Active participation is essential in projects for
successfully reaching the objectives. When a
certain time is reserved for plan review, visual
representation provides better opportunities
for developing the plan. The empirical findings
collected in this study underline that immersive
virtual environments have potential to enhance
collaboration [6], but must be facilitated carefully
in sensitive meeting situations. During the work
VTT also invested in a technology-assisted
group workspace and built ‘Creation Lab’. In
the future, we aim at developing procedural
meeting changes in order to turning those into
more participatory.
of experts valued virtual
models and wants to use
those also in the future.90%](https://image.slidesharecdn.com/r12-150323055322-conversion-gate01/85/Smart-City-Research-Highlights-26-320.jpg)
![Smart City Governance
25
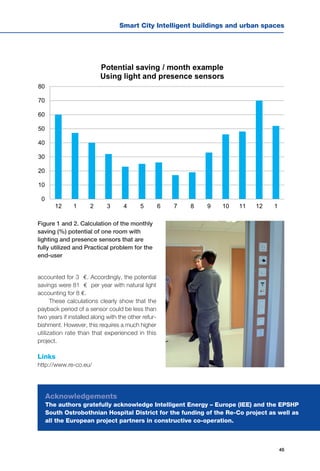
Fig.1. Virtual model used in two meeting setup; a standard meeting room (left)
and an immersive virtual environment (right).
Fig.2. VTT’s
technology
assisted group
work space
‘Creation Lab’.
Acknowledgements
Research has been supported by the
Finnish Funding Agency for Technology
and Innovation (TEKES) under the project
‘VIREsmart’. Authors are grateful for
collaboration with Finnish Traffic Agency,
Centre for Economic Development,
Transport and the Environment, City of
Espoo, Sito Ltd., Vianova Systems Finland
Ltd., and Ramboll Finland Ltd.
References
[1] Bouchlaghem, D., Shang, H., Whyte, J.
And Ganah, A. (2005). Visualisation in archi-
tecture, engineering and construction (AEC),
Automation in construction, Vol. 14, Iss. 3.
pp. 287-295.
[2] Reich, Y., Konda, S.L., Levy, S.N., Monarch,
I.A. and Subrahmanian, E. (1996). Varie-
ties and issues of participation and design,
Design Studies, Vol. 17, No. 2, 165–180.
[3] Bresciani, S. And Eppler, M. (2009). Evidence
from an experimental evaluation, Visualization
and Computer Graphics, Vol. 15, Iss. 6. pp.
1073-80.
[4] Video: Results from VIREsmart project:
https://www.youtube.com/watch?v=ydCx-
1YUvAok
[5] Engeström, Y. (2010). Activity Theory and
Learning at Work, In Malloch, M. et all (Eds.)
The SAGE Handbook of Workplace Learning,
Sage publication Ltd. pp. 74-89.
[6] Simon, A., and Scholz, S. (2005). Multi-view-
point images for multi-user interaction,
Proceedings of Virtual Reality’05, IEEE, Ger-
many, Bonn, March 12-16th, 7pg.](https://image.slidesharecdn.com/r12-150323055322-conversion-gate01/85/Smart-City-Research-Highlights-27-320.jpg)
![26
Janne Porkka,
Senior Scientist,
janne.porkka@vtt.fi
Other contributing authors:
Mirkka Rekola,
Timo Kuula
Virtual Model Facilitating
Citizen Interaction
Introduction
A continuous flow of public projects is required
for the development and maintenance of built
environment. Performance, achievements and
decision-making in those projects are of public
interest, and, thus easy access towards the
relevant information is required in a growing
manner. Interaction is one of the key elements
in current design practice. The building act in
Finland states that interaction with citizens is
obligatory [1], and similar practices are present
elsewhere. Still, communicative events between
experts and citizens utilising interactive models
have been studied in a very limited manner.
Presenting plans with
virtual model to citizens
The focus of participation has during the past
decades shifted from reducing consequences
towards the identification of future opportunities
[2]. Visualisation is seen as an efficient way to
reduce communication difficulties [3, 4]. We
have studied in VIREsmart project [5] citizen
participation in one large construction project
in Finland. Virtual model was adopted to three
public hearing events (138 participants) together
with design drawings and maps. Before the
event, researchers participated to a planning
meeting. Lengths of events ranged from 2 to 3
hours, each ending to a voluntary questionnaire.
Citizens understand plans
better with virtual models
Virtual models are lucrative communication
channel for experts to reach citizens. In two
out of the three public hearings approximately
80% of respondents agreed with the statement
virtual model was well suitable for examining
plans. Interestingly, we found out that 10-25%
of citizens did not fully understant design content
from maps. About 70% of participants were also
happy to use virtual models in the future. We also
monitored attitude towards tablets. In last event,
70% of occupants whose average age was 62
years felt that tablet visualisation rousing. Based
on observations, they experienced a wow-effect
after they learning to navigate in the model.
Towards technology assisted
small group discussions
Virtual models are a rather sensitive matter and
their implementation must be prepared. For com-
of citizen’s agreed that
virtual model is suitable
to examine plans.80%](https://image.slidesharecdn.com/r12-150323055322-conversion-gate01/85/Smart-City-Research-Highlights-28-320.jpg)
![Smart City Governance
27
munication towards public, other supplementing
communication channels need to be used to
facilitate communication successfully. We also
noticed that people have more courage to discuss
in smaller groups, instead of a large audience.
Thus, we suggest that group work should be
the main working practice whenever possible in
communicative events with citizens. Presenting
virtual model from a suitable mobile device, such
as a tablet, alongside paper drawings is a very
potential way for enhancing interaction.
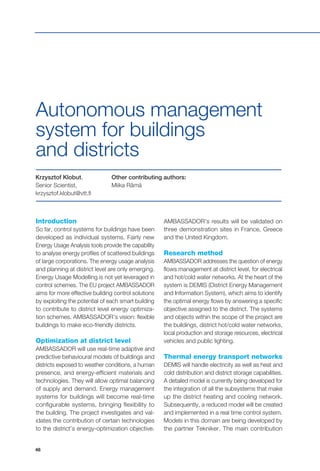
Figure 1. Three studied public hear-
ing events where plan was pre-
sented with virtual model (VIREs-
mart project [5]).
Figure 2. Virtual model studied
from a tablet.
References
[1] Ministry of Environment, Finland. Land Use
and Building Act 132/1999 (unofficial transla-
tion).
[2] Sanders, E. B.-N. & Stappers, P. J. (2008)
Co-creation and the new landscapes of
design. CoDesign: International Journal of
CoCreation in Design and the Arts, 4:1. pp.
5-18.
[3] Kalisperis, L., Otto, G., Muramoto, K., Gun-
drum, J., Masters, R., and Orland, B. (2002)
Virtual reality/Space Visualization in Design
Education, The VR-Desktop Initiative, Pro-
ceedings of eCAADe 20, Warsaw, Poland,
September 2002.
[4] Wissen, U., Schroth, O., Lange, E., &
Schmid, W. A. (2008). Approaches to
integrating indicators into 3D landscape
visualisations and their benefits for par-
ticipative planning situations. Journal of
Environmental Management, 89(3), 184-
196.
[5] Video: Results from VIREsmart project:
https://www.youtube.com/watch?v=ydCx-
1YUvAok
Acknowledgements
Research has been supported by
the Finnish Funding Agency for
Technology and Innovation (TEKES)
under the project ‘VIREsmart’. Authors
are grateful for collaboration with
Finnish Traffic Agency, Centre for
Economic Development, Transport and
the Environment, City of Espoo, Sito
Ltd., Vianova Systems Finland Ltd.,
and Ramboll Finland Ltd.](https://image.slidesharecdn.com/r12-150323055322-conversion-gate01/85/Smart-City-Research-Highlights-29-320.jpg)
![28
Charles Woodward,
Research Professor,
charles.woodward@vtt.fi
Mobile Augmented
Reality for City Planning
Introduction
VTT has conducts leading research on Aug-
mented Reality applications in the AEC sector
(Architecture, Engineering and Construction).
Beyond technical work, VTT has been the first to
employ mobile AR in real land use cases, helping
city officials and local residents to understand
and comment the architectural plans in early
design phases. User studies indicate good user
acceptance and clear added value for the decision
making process among different stakeholders.
Increasing understanding
of architectural plans
Augmented Reality (AR) is a technology for
superimposing digital information such as com-
puter-generated graphics on the user’s real
time view of the physical real world. In land use
planning, mobile AR can be used for visualizing
planned 3D building models from arbitrary view
points at actual locations. Increased situational
awareness enabled by mobile AR allows allows
for improved communication of plans between
different interest groups.
Pilot cases
VTT’s mobile Augmented Reality solutions [1]
were used for mobile visualization of building
plans in three real use cases: 1) hotel plans in
Billnäs iron works site at Raseborg, 2) Kämp
Tower plans in Jätkäsaari, Helsinki, and 3) wind
generator farm in Pörtom, Närpes. The first two
cases with city officers as users were performed
in 2012, being the first times in the world when
mobile AR have been applied for real decision
making in land use planning. The third visualiza-
tion was targeted further to serve local residents,
farmers etc. who could thus evaluate the effect
of new construction plans to their living envi-
ronments. The first two pilot cases are shown
in Figures 1 and 2; see also videos http://youtu.
be/wvSPzG7AqLY (Billnäs) and http://youtu.be/
c1DUkVhqVsM (Kämp Tower).
User acceptance
The participants in the example cases used the
mobile AR system along with paper visualizations
of the plans and evaluated the usefulness and
overall strengths and weaknesses of the AR
system. The results [2] indicate that AR was
found to be a highly useful instrument to visu-
alize building plans in a holistic and intuitive way
from the first-person point of view. The system
facilitated decision making and enriched the
understanding of the plan, thus having a clear
additional value over traditional visualizations.
Each of the use cases lead to ordering of further
mobile AR tours around the sites, as well as to
employment of the system in further land use
cases in Finland and abroad.](https://image.slidesharecdn.com/r12-150323055322-conversion-gate01/85/Smart-City-Research-Highlights-30-320.jpg)
![Smart City Governance
29
Discussion
In the future, we expect mobile AR to become a
standard tool for city officials, residents and other
stakeholders to evaluate and better understand
new building plans and alternatives. Mobile AR
enables people to view building plans in an
easy and intuitive way, at any chosen viewpoint.
Interaction with residents, land owners and other
stakeholders is often a key issue in building and
land use planning. Better understanding of the
plans can lead not only to more democratic
society, but can also have significant economic
impact e.g. by means of reducing costly com-
plaint times related to land use proposals.
Figure 1: Helsinki city planning council
viewing augmented Kämp Tower plans on
tablet.
References
[1] Woodward C., Hakkarainen M. Mobile mixed
reality system for architectural and construc-
tion site visualization. In Augmented Reality
- Some Emerging Application Areas, Andrew
Yeh Ching Nee (ed.), InTech, 2011. Pp. 115-
130.
[2] Olsson T., Savisalo A., Hakkarainen M. &
Woodward C. User evaluation of mobile
augmented reality in architectural planning",
eWork and eBusiness in Architecture, Engi-
neering and Construction, Gudnason G.
& Scherer R. (eds.), Proc. ECPPM 2012,
Reykjavik, Island, 25-27 July, 2012. Pp. 733-
740.
Acknowledgements
We thank FCG Finnish Consulting
Group Oy, Helsinki City Planning
Department and VindIn Ab (Sweden)
for co-operation with the pilot cases.
Users studies were conducted in
co-operation with Thomas Olsson of
Tampere University of Technology.
VTT researchers Mika Hakkarainen,
Petri Honkamaa and Tuomas
Kantonen were in charge of technical
implementations.](https://image.slidesharecdn.com/r12-150323055322-conversion-gate01/85/Smart-City-Research-Highlights-31-320.jpg)
![30
Virpi Oksman,
Senior Scientist,
virpi.oksman@vtt.fi
Other contributing authors:
Antti Väätänen
Co-creating future smart cities
- Visual and participative urban
planning services
Introduction
Urban planning is traditionally perceived as a
complex and time-consuming process. Unclear
plans, possible misunderstandings and deci-
sion-making without stakeholder participation
may cause complaints and delays even in
long-prepared projects. New visual smart city
planning solutions for illustrating urban projects
are needed. Participatory design approach with
advanced visualisation and open innovation tools
enhance collaboration between stakeholders and
facilitate discussion of new ideas and solutions.
Future urban planning services
VTT conducted research on participative urban
planning and developed tools for illustrating
design options and gathering user feedback.
The aim of the visual and participatory urban
planning study was to co-create, demonstrate
and evaluate web-based service concepts, which
utilise mixed reality technologies with user partic-
ipation features. In the future, the development
of urban living can be easily understandable,
collaborative and transparent process engaging
different stakeholders. The stakeholders in urban
planning and the users of the new community
planning services can be categorized into three
main groups: 1) decision-makers 2) related com-
panies, and 3) citizens. The research process
involved interviews with visual software and
urban planning related companies, local political
decision-makers, municipal officials and citizens.
In addition, 455 citizens have participated in the
study via online questionnaire.
Participatory urban
planning demonstrators
Different demonstrators related to real urban
planning projects have been developed for
concretizing the service concept [2,3]. Demos
illustrate a sound barrier between a field and a
highway in Pirkkala municipality, different options
for a new office building in Lempäälä Church
square and new buildings and rooftop gardening
around Tampere Central Arena (Figure 1).
Technically, the demos are based on mix-
ing panoramic imaging and 3D architectural
drawings and they run on web browsers of
different devices such as tablet devices and
PCs. Advanced visualization approaches such
as mobile on-site augmented reality solutions
and table top interaction design tables (Figure
2) were also considered as possible participative
urban planning concepts.
Stakeholders’ views on the on
the visual and participatory urban
planning concepts and demos
According to the interviews, the new tools were
expected to eliminate misunderstandings and](https://image.slidesharecdn.com/r12-150323055322-conversion-gate01/85/Smart-City-Research-Highlights-32-320.jpg)
![Smart City Governance
31
bring certainty in the decision-making processes
[1]. The interviewed decision-makers wanted real
team play and open discussions with different
stakeholders. Illustrating and visualizing urban
plans was thought to enhance the quality of the
decision-making materials. The new web-based
visualization services were seen as furthering the
perception of entireties, dimensions and scales
of new buildings, measures and impacts, which
were seen as difficult to figure out at present. The
new tools were expected to make it possible to
illustrate and compare different options and their
direct and indirect impacts on the environment.
In addition, visualizations would offer users the
option to give feedback and share their ideas
at any time. This would be useful, especially in
trying to target future users, e.g., the younger
age groups, who rarely participate in public urban
planning events organized by communities. In
general, the new visual tools were seen as a
possibility to enhance the most important and
employing future urban planning projects.
Figure 1. Rooftop gardening and Tampere
Central Arena visualization.
(Picture: VTT/NCC)
References
[1] Oksman, V., Ylikauppila, M. & Väätänen, A.
Tulevaisuuden havainnollistava ja osallistava kau-
punkisuunnittelu: Näkökulmia uusiin digitaalisiin
palveluihin. VTT Technology, Espoo, 2014. www.
vtt.fi/inf/pdf/technology/2014/T171.pd
[2] Oksman, V., Väätänen, A., & Ylikauppila, M.
(2014, May). Future Illustrative and Participative
Urban Planning. In CONTENT 2014, The Sixth
International Conference on Creative Content
Technologies (pp. 22-29).
[3] Oksman, V., Väätänen, A., & Ylikauppila, M.
(2014, August). Co-creation of Sustainable
Smart Cities. In UBICOMM 2014, The Eighth
International Conference on Mobile Ubiquitous
Computing, Systems, Services and Technologies
(pp. 189-195).
[4] Välkkynen P., Siltanen S., Väätänen A.,
Honkamaa P., Ylikauppila M. Developing Mixed
Reality Tools to Support Citizen Participation in
Urban Planning, EXS 2.0 Exploring Urban Space
in the Web 2.0 Era. Munchen, DE, 30 June 2013.
Figure 2. Visualization on an interactive
design table.
Acknowledgements
The ILCO project has been funded by Tekes – the Finnish Funding Agency
for Technology. The project has been supported by City of Tampere and the
municipalities of Pirkkala and Lempäälä. Company partners participating in the
project are JJ-Net Group Ltd, Sweco PM Ltd and Visura Ltd.](https://image.slidesharecdn.com/r12-150323055322-conversion-gate01/85/Smart-City-Research-Highlights-33-320.jpg)
![32
Marketta Niemelä,
Senior Scientist,
marketta.niemela@vtt.fi
Other contributing authors:
Veikko Ikonen
Citizen-driven co-design
for a smarter city
Introduction
Continuous innovation is in the core of the idea
of smart city. Accordingly, the role of the cit-
izen has evolved from a passive end user of
technology to a source of ideas, a co-designer
and a co-producer of technologies, services,
activities and other facilities in the smart city.
The citizens make a bountiful resource for the
distributed innovation system. To benefit from
this resource, the innovation system needs to
efficiently utilise different tools, technologies
and methods for efficient co-design. VTT has
developed and investigated solutions to engage
citizens to innovate for business and smart gov-
ernance, decision making and urban planning.
This chapter provides some highlights of the
co-design research carried out at VTT. More
detailed descriptions and results of some par-
ticular co-design studies are presented in the
other chapters in this book.
VTT solutions and
approaches for co-design
The Internet and social media make a power-
ful platform for co-design. Owela [1] is a web-
based tool that enables co-design independ-
ent of time and place. Owela builds on social
media features to attract consumers to partici-
pate co-innovation for the purposes of projects
and companies. ICT is also taken advantage of
in urban city planning with visual, augmented
reality solutions (see [2] in this book). A web-
based platform can show realistic images of a
city area. The images are interactive and aug-
mented with virtual objects and information to
illustrate the development plans for the area.
The images can be investigated and manipu-
lated, and the application encourages user feed-
back through co-design elements (e.g. ques-
tionnaires) integrated in the display. Attaching
these elements to specific spatial locations in
3D space in the image has been tested in the
Visual IHME concept [3]. The concept has appli-
cations in cases when co-design is dependent
on spatial referencing.
In the end, co-design is involvement of
people to jointly develop something new or
better. Living lab is an approach to co-design
that is based on long-term participation and
engagement of users as well as other stake-
holders in the development process [4]. Living
Lab provides an opportunity to apply a range of
collaborative methods – whether ICT-based or
not – during the process, resultings as deeper
research knowledge and better ideas and raising
feelings of togetherness and common purpose
for the living lab community. On the other hand,
collaborative design can also take place in an
ephemeral manner. VTT has tested a concept
of an open, public co-design showroom IHME
[5] (Figure 1) that attracted consumers to visit
the showroom and get involved in technology
application design for a moment without com-
mitment. The concept was very welcomed
among the consumer visitors.](https://image.slidesharecdn.com/r12-150323055322-conversion-gate01/85/Smart-City-Research-Highlights-34-320.jpg)
![Smart City Governance
33
Discussion
In the near future, engaging citizens in research
and innovation is becoming ever more important.
One notable thrust for this development is the
initiative of Responsible Research and Innovation
(RRI), recently launched by European Commis-
sion. RRI strongly emphasises citizen engage-
ment in innovation in order to guide innovation
towards the needs of the society, with prethought
risks. The responsible innovation system starts in
the school in science education and encourages
both genders to participate making the future.
VTT faces the challenge set by RRI and
societal needs by developing and implementing
new co-design methods and tools to attract and
facilitate citizens to participate in the continuous
innovation.
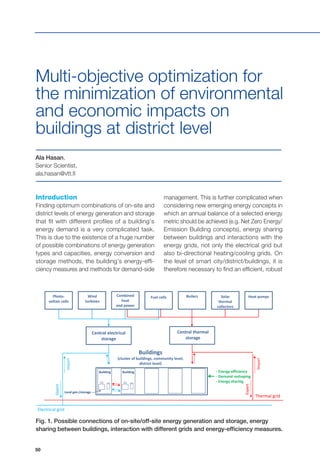
Figure 1. The public co-design showroom IHME attracted consumers to engage in
co-designing smart applications.
References
[1] Friedrich, P. Web-based co-design. Social
media tools to enhance user-centred design and
innovation processes. VTT Science 34. VTT,
Espoo. 185 p. + app. 108 p. http://www.vtt.fi/inf/
pdf/science/2013/S34.pdf
[2] Oksman, V. & Väätänen, A. (in this book)
[3] Niemelä, M., Kivinen, T., Kulju, M., Tammela,
A., Ikonen, V. & Korhonen, H. Visual IHME:
Co-designing meaningful places for sustainabil-
ity. Proceedings of the 2013 IADIS International
conferences: Interfaces and Human Computer
Interaction. Prague, Czech Republic, 22–24 July
2013. Pp. 283 - 287
[4] Kaasinen, E., Koskela-Huotari, K., Ikonen, V.,
Niemelä, M. & Näkki, P. Three approaches to
co-creating services with users. Proceedings of
the 2012 4th International Conference on Applied
Human Factors and Ergonomics (AHFE). San
Francisco, USA, 21–25 July 2012. USA Pub-
lishing, Stoughton, Wisconsin, USA, 2012 (DVD
publication).
[5] Ikonen, V., Hakulinen, J., Kivinen, T., Aloja, M.,
Hokkanen, L., Ruutikainen, P., Kymäläinen,
T., Nelimarkka, M. & Harrela, A. IHME = Miracle
- Make, Imagine and Research Applications for
Computerised Living Environments. Proceedings
of the 2010 14th InternationalAcademic MindTrek
Conference: EnvisioningFuture Media Environ-
ments. Academic MindTrek 2010, Tampere, FI,
6–8 October 2010. The MindTrek Association in
co-operation with ACM SIGMM; ACM SIGCHI.
Tampere, FI (2010). Pp 3–6.
Acknowledgements
We thank VTT Design for Life
innovation program for supporting this
work.](https://image.slidesharecdn.com/r12-150323055322-conversion-gate01/85/Smart-City-Research-Highlights-35-320.jpg)
![34
Asta Bäck,
Principal Scientist,
asta.back@vtt.fi
Other contributing authors:
Pirjo Friedrich
Social media
for citizen
participation
Introduction
What opportunities and challenges do social
media, openness and self-organising bring about
for collaboration and communication between cit-
izens and public organisations? Can social media
be used as an effective participative environment?
The SOMUS project [1] set out to explore these
questions by making a number of case studies
where citizens and public sector representatives
developed and utilised social media tools and
services to tackle societal issues.
Social media tools require
new skills and processes
Social media challenges the traditional ways of
citizen participation [2]. Online tools and services
offer powerful platforms for active citizens and
lower the barrier for participation in societal issues.
Cities and municipalities can utilize the collective
wisdom of its citizens for problem solving and
innovation. However, successful utilisation requires
coordination skills and processes that benefit
from and support citizen participation. There
will also be increased pressure for transparency
in decision making. A city can support citizen
participation by opening its data for free and in
machine readable format. Open data enables
analysis and application development by giving
the citizens facts and opportunities for informed
participation.
Open participatory research
Our leading themes, social media and openness,
were utilised from the beginning: the project
proposal was drafted in an open wiki, and this
attracted researchers from universities as well as
active citizens creating the core project group.
All project work was done in open manner sup-
ported by online tools. During the actual project,
we co-designed new social media services with
high school students and their teachers, immi-
grants and their associations as well as Ministry
of Justice [3].
Innovations through social media
Social media may be utilised in two ways: existing
social media services may be used or new services
may be developed. Using existing social media
services enables building on available communi-
ties, networks and content, but one must play by
the rules of the service in question. When creating
new services, popular social media features that
have become familiar to users can be included to
make also new services easy to learn and use.
Collaboration with real users from the problem
definition through use is critical to success. Crucial
new ideas may come from any participant and
fresh ideas emerge best through experimenting
and testing. New tools and clever use of current
tools can themselves become innovations and
create new business opportunities, and they may](https://image.slidesharecdn.com/r12-150323055322-conversion-gate01/85/Smart-City-Research-Highlights-36-320.jpg)
![Smart City Governance
35
generate new innovations by gathering a versatile
group of people to collaborate.
Social media enables self-organization. It
works in a small group, but large crowds need
gluing elements or tools to compensate the lack
of formal organization that is normally used to
organise such activities. This is particularly the
case, when the action requires a longer time to
complete and the target is to have an impact
outside the online world. Dealing with openness
and incompleteness, networking, managing
varying roles, facilitating networked processes,
agility and ethics are needed when utilising open
social media in public processes.
References
[1] Näkki, P., Bäck, A., Ropponen, T.,
Kronqvist, J., Hintikka, K. A., Harju, A., Pöy-
htäri, R., & Kola, P. Social media for citizen
participation. Report on the Somus project.
VTT Publications: 755. 2011. VTT, Espoo.
112 s. + liitt. 11 s. http://www.vtt.fi/inf/pdf/
publications/2011/P755.pdf
[2] Ahlqvist, T., Bäck, A., Heinonen, S. &
Halonen, M. Road-mapping the societal
transformation potential of social media. Fore-
sight - The journal of future studies,strategic
thinking and policy. Emerald Group Publishing
Limited. Vol. 12 (2010) No: 5, 3-26
[3] Bäck, A., Friedrich, P., Ropponen, T., Harju,
A. & Hintikka, K.A. From design participation
to civic participation - participatory design of
a social media service. International Journal
of Social andHumanistic Computing. Indersci-
ence. Vol. 2 (2013) No: 1/2, 51 – 67
Acknowledgements
‘Social media for citizens and public
sector collaboration’ (SOMUS) was jointly
funded by the MOTIVE programme of the
Academy of Finland, and the research
partners, VTT Technical Research Centre
of Finland, Aalto University School of
Technology and Science, University of
Jyväskylä, and University of Tampere.
We want to thank our financiers and
co-researchers from the above mentioned
organizations as well as the Open
Research Swa rm in Finland and all
participants in the case studies.](https://image.slidesharecdn.com/r12-150323055322-conversion-gate01/85/Smart-City-Research-Highlights-37-320.jpg)
![36
Johanna Leväsluoto,
Research Scientist,
johanna.levasluoto@vtt.fi
Other contributing authors:
Jouko Heikkilä,
Janne Laine
Gamification as an
enabler of mutual learning
in complex health care
systems
Introduction
Innovations in cities are usually systemic in
nature. Systemic innovations require changes
in organisations, network relationships, technol-
ogies and models of operation. [1] Our focus in
this article is health care innovations in public
sector where new services foster quality and
efficiency of services provided to citizens. Ageing
population, increase of chronic diseases, new
ICT solutions and citizens’ increasing expecta-
tions has led to situation where our health care
system needs radical changes. For example,
the introduction of new ICT solutions makes
it possible to connect more and more distant
actors to the same service activity. However, at
the same time, the service as a whole becomes
complex and thus uncontrollable. From the
viewpoint of the customer, the care appears
as a fuzzy process. Customer-oriented thinking
and ways to coordinate services have been
suggested as a solution. A change towards
customer-oriented health care services requires
a paradigmatic change and changes in multiple
levels. In Finnish health care system, the silos
of organisations and profession as well as
expert- led health system where customers are
not considered as expert in their own health are
significant barriers of implementing new cus-
tomer-oriented services. It is essential to create
dialogue between organisations, professionals
and customers to promote system innovation
and thus create high quality health care services.
For this, gamification, the use of game-like ele-
ments and game-design principles in non-game
applications [2], is seen as a potential tool for
promoting dialogue and innovation.
Promoting dialogue –
complexity theory, societal
embedding of innovation and
gamification as methods
In recent years the idea to consider health care
as a complex adaptive system has gained
ground in research. We have collated and fur-
ther developed the recommended managing
principles of complex adaptive sociotechnical
systems (CASS). In CASS, individual actors
self-organize and interact with each other thus
changing the context and affecting the self-or-
ganisation of other actors. This creates intrinsic
unpredictability and uncontrollability in CASS.
[3] The management of CASS means trust and
support to self-organisation of actors and build-
ing of engagement to the shared purpose [4].
Another approach used in our research
is societal embedding of innovation. Societal
embedding of innovation is a research and
development approach which has been devel-](https://image.slidesharecdn.com/r12-150323055322-conversion-gate01/85/Smart-City-Research-Highlights-38-320.jpg)
![Smart City Governance
37
oped by VTT in different research projects
since 1990`s. It has been used to enhance
novel health care services and environmentally
friendly innovations. [5] It aims at facilitating
and initiating new innovations in a multi-actor
network. An important objective is to create a
dialogue between different actors and give them
a possibility to create a shared understanding
of the elements of the solution. By opening up
the perspectives of the different actors it aims
to produce mutual learning.
Gamification can be seen as a promising
approach for mutual learning. For instance,
storytelling among a group of players assuming
different roles, using visual aids such as playing
cards and boards, can be adapted to game-
like approaches. This allows systemic aspects
of health care processes to be discussed from
different perspectives in an inspiring setting,
and coherent storylines involving different stake-
holders to be created in order to concretize the
often hazy interactions between different actors
and actions. Games can also emulate complex
interactions found in real-world service chains
and in their management, providing a platform
on which people can experience, discuss, and
experiment with different future conditions and
states.
In our research project MOSAIC, CASS,
societal embedding of innovation and gamifica-
tion has been studied in practical cases. In one
of our cases, a substantial change in technical
systems is introduced which induced also the
need to change the process and operational
culture. After the interviews of selected stake-
holders and health care professionals, we are
developing gamified solutions to support the
management of complex care chains. One
example of these development activities is a
workshop where we applied “role-switching
game” in multidisciplinary teams aiming at
improving medical care process.
Integration of methods
as one solution?
Typically there are no simple solutions to com-
plex problems. CASS, societal embedding of
innovation and gamified approaches can be seen
as valuable tools to understand, manage and
create dialogue to foster change processes in
complex health care service systems. In MOSAIC
project we are integrating these approaches to
study and support complex change processes.
References
[1] Valovirta, V., Pelkonen, A., Kivisaari, S.,
Hyytinen, K. 2011. Kaupunki-innovaatioiden
levittäminen ja skaalaaminen. VTT:n tutkimus-
raportti.
[2] Deterding, S., Dixon, D., Khaled, R., &
Nacke, L. (2011). From game design ele-
ments to gamefulness: Defining gamification.
In Proceedings of the 15th international
Academic MindTrek Conference: Envisioning
Future Media Environments, Tampere, Fin-
land, September 28–30, pp. 9–15.
[3] Reiman, Teemu; Rollenhagen, C; Pietikäi-
nen, Elina; Heikkilä, Jouko. 2014. Principles
of adaptive management in complex safe-
ty-critical organizations. Safety Science
- Article in press. Elsevier doi:10.1016/j.
ssci.2014.07.021
[4] McMillan, E. 2008. Complexity, Management
and the Dynamics of Change, Routledge,
London
[5] Kivisaari S., Lovio, R. & Väyrynen E. 2004.
Managing experiments for transition. Exam-
ples of societal embedding in energy and
health care sectors. In Boelie Elzen, Frank
Geels and Ken Green (eds) book "System
Innovation and the Transition to Sustainability:
Theory, Evidence and Policy". Cheltenham:
Edward Elgar Publishing.
Acknowledgements
The authors would like to thank
Pirkanmaa Hospital District, Vaasa
Central Hospital and Tekes - the Finnish
Funding Agency for Innovation](https://image.slidesharecdn.com/r12-150323055322-conversion-gate01/85/Smart-City-Research-Highlights-39-320.jpg)
![38
Minna Räikkönen,
Research Scientist,
minna.raikkonen@vtt.fi
Other contributing authors:
Liisa Poussa, Susanna Kunttu,
Helena Kortelainen
Decision-making support:
A smart city
perspective
Introduction
Today, we have moved to interconnected, open
and global living environments. Smart solutions
and networks are surrounding us almost every-
where and security has become a priority in all
aspects of life, including business. As a result,
decision-makers at all decision-making levels
are pressured to find ways to deal with the new
technologies, their benefits and security risks, and
to make sound investments on them. Secure soci-
ety and business environment is often regarded
as a public good but how to assure that the
investments are acceptable and cost-effective?
Need for improved decision-making
Decision-makers typically have trouble evaluating
alternative designs and justifying technology
investments because the benefits are typically
difficult to estimate. Decision-makers respon-
sible for planning and introducing investments
on new technologies and smart solutions usu-
ally find themselves confronted with numerous
stakeholders with multiple needs, requirements
and value perceptions. In this multi-stakeholder
situation, consistent estimates and other infor-
mation on costs, benefits and risks of investment
alternatives are crucial for decision-making and
increase transparency and reliability of decisions.
To balance increasing need for security and
economic constraints, decision-makers have to
increase their awareness of the overall impacts
of their decisions.
Evaluating the effect
of investment alternatives
Typically a decision-maker is influenced by factors
that are clearly financial but also by factors that
cannot be easily quantified in financial terms.
Thus, the investment appraisal problem can be
set up as a multi-criteria optimisation problem,
and a variety of methods should be used for the
evaluation. VTT was part of the consortium [1]
developing a framework for assessing the security
investments. The approach and the subsequent
tool are based on the three pillars (Figure 1):
• Risk reduction assessment: Calculating the
expected reduction of risks by the investment
alternatives
• Cost-benefit analysis: Comparing those
positive and negative effects of the invest-
ment alternatives which can be expressed
in monetary terms
• Analysis of societal factors: Evaluating all
criteria influencing the decision which cannot
be expressed in quantitative terms.
By widening the assessment process through
which the investment decisions are taken, the
decision-maker is able to make the optimal](https://image.slidesharecdn.com/r12-150323055322-conversion-gate01/85/Smart-City-Research-Highlights-40-320.jpg)
![Smart City Governance
39
SoftwareToolSoftwareToolSoftwareTool
Investment
1
Risk Reduction
Assessment
Risk Reduction
Assessment
Cost Benefit
Assessment
Cost Benefit
Assessment
Qualitative
Criteria
Assessment
Qualitative
Criteria
Assessment
Identification of a need
Generation of proposals
Identification of a need
Generation of proposals
Investment
2
Investment
3
Investment
…
Investment
n
trade-offs between monetary and non-mone-
tary considerations based on his/her individual
preferences and values.
Valuable decisions
The multi-dimensional investment assessment
provides a holistic view to investment deci-
sion-making by combining and integrating several
evaluation methods into aggregated analysis. In
addition, the approach enhances transparency of
investment decision-making and contributes to
more comprehensive use of available information
affecting the profitability of investments.
The software tool based on the developed
approach is already being successfully applied
in the area of communal security planning, air
transportation, public mass-transportation, public
Figure 1. Framework for three pillar assessment of investment alternatives [1, 2, 3].
References
[1] VALUESEC project 2011-2014. Funded in EU Seventh Framework Programme, 261742. www.
valuesec.eu Consortium members Fraunhofer IFF, VTT, CESS, EMAG, WCK, Valencia Police, Atos,
TUM.
[2] Rosqvist, T., Räikkönen, M., Jähi, M., Poussa, L. Data model and decision model – basic descrip-
tions. 42 p. + app 6 p. VALUESEC project deliverable 2.2. Available at www.valuesec.eu
[3] Räikkönen, M., Rosqvist, T., Poussa, L. and Jähi, M. A Framework for Integrating Economic Eval-
uation and Risk Assessment to Support Policymakers' Security-related Decisions. PSAM11 & Esrel
2012 Int'l conference proceedings. Scandic Marina Congress Centre, Helsinki, Finland, 25 - 29 June
2012. USB memory stick (2012), 18-Tu3-2
Acknowledgements
The research leading to these results
has been funded by the European
Community's Seventh Framework
Programme (FP7/2007–2013) under grant
agreement no. 261742. The ValueSec
(Mastering the Value Function of Security
Measures) consortium is acknowledged
for its research efforts and fruitful
cooperation.
mass events, and cyber threat. The developed
method is also applicable to the evaluation of
investments on smart city related solutions and
networks.](https://image.slidesharecdn.com/r12-150323055322-conversion-gate01/85/Smart-City-Research-Highlights-41-320.jpg)

![42
Intelligent urban spaces –
automatic real-time
responses to people behaviour
Sari Järvinen,
Senior Scientist,
sari.jarvinen@vtt.fi
Introduction
With intelligent urban spaces we aim to create
spaces that are capable of reacting in real time
to the behaviour of the people who are present.
The urban space adapts to the people’s needs
and intentions – providing just the right services
at the right time in the best possible way without
direct control of the services by the users. We
offer a depth sensor based people tracking
system to acquire data on people behaviour and
a service to analyse and model the behavioural
data. The people tracking and modelling system
can provide a competitive advantage for various
application domains, from immersive spaces to
smart lighting, facility management and retail.
Benefits of a people
behaviour modelling approach
Current people-tracking solutions are based
on various sensor technologies (RGB cameras,
RFID, Wi-Fi, Bluetooth, etc.) and can provide
general information on people’s movements in
the environment. Our depth sensor based solution
provides more accurate and reliable track data
on which people behaviour can be modelled in
order to target the service to the people who are
present (Figure 1). This information is valuable for
many application and service domains (Table 1).
People behaviour
monitoring and modelling
Since 2010 when Microsoft released the Kinect
sensor, the price of depth sensors has fallen,
enabling the adoption of previously high-end
technology for new application domains. The
first version of the VTT people tracking system
was built on a one sensor approach using these
cost-effective depth sensors. The networked
solution [1] in which a centralized server collects
and fuses the detection events signalled by the
sensor nodes has been demonstrated on many
occasions in the last couple of years and has
attracted interest. The novelty of our solution is
in the developed data analysis functionalities,
enabling behaviour modelling and leading to
intention awareness as well as to prediction
of people behaviour [3], [4]. The basic people
tracking system has been integrated with external
services: lighting control [2], interactive spaces,
customer monitoring and facility monitoring
services.
People behaviour modelling –
unleashed business potential?
The current application domains for the peo-
ple behaviour monitoring system have been
defined based on the interests of various stake-
holders. As already described, we have recognized
many distinct use cases, and we believe there
are many more still to be found. We will continue
developing the analysis and modelling func-
tionalities towards a semantic understanding
of people behaviour, e.g. activity recognition
or group behaviour. The intelligent sensored
spaces lead to increased efficiency and provide
a competitive edge for companies as well as
possibilities to define new business concepts
and models.
Other contributing authors:
Satu-Marja Mäkelä](https://image.slidesharecdn.com/r12-150323055322-conversion-gate01/85/Smart-City-Research-Highlights-44-320.jpg)
![43
Smart City Intelligent buildings and urban spaces
Figure 1.
The depth sensor
based people
tracker provides
accurate real-
time information
on people
behaviour: track
visualization, heat
maps, statistics
and behaviour
segmentation
Interactive sensored
spaces
Presentation and selection of content based on people’s actions, natural and
invisible interaction with the users, intention awareness
Brick-and-mortar
retail
Exact information on customer behaviour, intention-awareness leading to real-
time response and immersive shopping experiences, interaction with digital
content in the store, customer modelling
Assisted living Behaviour information on the elderly, behaviour patterns, anomaly detection
Facility management Exact real-time information on the use of facilities, enabling new ways of
working, input for facility design
Smart lighting Dynamic control of lighting systems based on real-time information on people
behaviour, guidance solutions, automatic adaptation to current tasks
References
[1] Mäkelä, S.-M., Järvinen, S., Keränen, T., Lindholm, M., Vildjiounaite, E. Shopper Behaviour Anal-
ysis Based on 3D Situation Awareness Information. Proceedings of First International Workshop on
Video Analytics for Audience Measurement, VAAM 2014, Stockholm, Sweden, 24 August 2014.
[2] Mäkelä, S.-M., Sarjanoja, E.-M., Keränen, T., Järvinen, S., Pentikäinen, V., Korkalo, O. Treasure
Hunt with Intelligent Luminaires. Proceedings of International Conference on Making Sense of Converg-
ing Media (AcademicMindTrek ’13).
[3] Ervasti, M., Isomursu, M., Mäkelä, S.-M., Enriching Everyday Experience with a Digital Service: Case
Study in Rural Retail Store. Proceedings of BLED 2014. Paper 20.
[4] Vildjiounaite, E., Mäkelä, S.-M., Järvinen, S., Keränen, T., Kyllönen, V. Predicting Consumers’
Locations in Dynamic Environments via 3D Sensor-Based Tracking. Proceedings of 8th International
Conference on Next Generation Mobile Applications, Services and Technologies NGMAST 2014,
Oxford, UK, 10-12 September 2014.
Acknowledgements
The people tracking system has been developed in various internal and co-funded
research projects since 2010: Pro-IoT programme, New ways of working (internal
projects); ViCoMo, Empathic Products, Digital Service SHOK, SparkSpace,
FLOW3D (partially funded by Tekes) and Flexible Space Service (EIT ICT Labs).
The work has been a joint effort by a number of VTT researchers.
Table 1. Application domains that benefit from people behaviour knowledge](https://image.slidesharecdn.com/r12-150323055322-conversion-gate01/85/Smart-City-Research-Highlights-45-320.jpg)
![46
Charles Woodward,
Principal Scientist,
charles.woodward@vtt.fi
Other contributing authors:
Timo Kuula (VTT)
Introduction
Augmented Reality (AR) is a promising new
technology to help mobile workers obtain timely
and accurate information related to maintenance
targets. We implemented a prototype of a mobile
AR system based on the BIM representation
of the building, combined with FMS and other
data sources. Technical challenges included
indoor locationing and 3D tracking of the mobile
device. User evaluations were conducted in two
phases: first, providing valuable input for system
design, and, secondly, showing very positive
results on technology acceptance.
Providing new tools for
building maintenance workers
Building maintenance workers have a num-
ber of locations to visit and are constantly
on the move, thus their tools should support
mobile work. The workers also frequently meet
with new locations and unknown equipment,
requiring tools to provide them with up-to-date
information on site. Mobile Augmented Reality
can be used to visualize alerts and operating
instructions directly on the target, thus help-
ing mobile workers with improved situational
awareness and reducing the workers’ need
to shift their attention from the work target to
external devices or manuals.
Mobile AR system implementation
based on participatory design
We were among the first in the world to implement
a mobile AR system for building maintenance
workers. Technical challenges in the implementa-
Mobile augmented reality
for building maintenance
tion included accurate indoor locationing and 3D
tracking for mobile devices. The implementation
was based on participatory design (PD) and
user-centric (UCD) principles, involving several
users and experts from a group of industrial
partners. The users were first involved in the
design phase of the application [1], leading to a
set of features and functionality now available in
the final system prototype. The second round of
the user tests with a real world pilot case verified
user acceptance of the proposed solution [2].
Figures 1 and 2 show two use case scenarios.
A video of the pilot is provided on YouTube
http://youtu.be/uYFtYbqvoq0.
Discussion
The users involved in the group interviews were
very enthusiastic about discussing how tech-
nology could be used in everyday work duties.
They provided a large number of good quality
ideas effortlessly and generally felt that a mobile
tablet application could easily be used in their
work. One of the most important findings in the
first round of the user tests was the obvious
need for other data sources besides BIM such
as FMS (Facility Management System) to be
integrated into the system. Other features that
were proposed by the users included a Virtual
Reality (VR) view for remote inspections. Several
ideas from the first round of studies were taken
into account in the final system implementation.
The second round of user tests showed very
positive results for user acceptance of the
prototype application.](https://image.slidesharecdn.com/r12-150323055322-conversion-gate01/85/Smart-City-Research-Highlights-48-320.jpg)
![47
Smart City Intelligent buildings and urban spaces
Figure 1. BIM with malfunctioning devices highlighted.
Figure 2. Mobile user finds warnings and alarms in a room (left).
Alerts highlighted in mobile AR view (right).
Acknowledgements
This work was conducted in the
DigiSpaces project 2011-2013 with
support from Tekes and involved the
industrial partners Granlund, Pöyry,
Skanska, Tekla, Solibri and Nokia. We
also thank Quuppa for its co-operation.
VTT researchers Mika Hakkarainen,
Petri Honkamaa, Tuomas Kantonen,
Kalevi Piira and Timo Kuula were
the main persons responsible for the
implementation and user studies.
References
[1] Kuula, T., Piira, K., Seisto, A.,
Hakkarainen, M., Woodward, C. User
requirements for mobile AR and BIM utili-
zation in building life cycle management,
Proc. CONVR2012, Taipei, Taiwan, 1-2
November, 2012. Pp. 203-211.
[2] Woodward, C. Kuula, T., Honkamaa,
P., Hakkarainen, M., Kemppi, P.
Implementation and evaluation of a
mobile augmented reality system for
building maintenance. To appear in
Proc. CONVR2014, Sharjah, UAE, 16-18
November 2014.](https://image.slidesharecdn.com/r12-150323055322-conversion-gate01/85/Smart-City-Research-Highlights-49-320.jpg)
![49
Smart City Intelligent buildings and urban spaces
Figure 1. Simplified communication architecture for the
Ambassador demonstrator at INES
Acknowledgements
The authors wish to thank the AMBASSADOR project consortium, see http://
ambassador-fp7.eu/ and its Coordinator Alfredo Samperio of Schneider Electric
France. The AMBASSADOR project receives funding from the European Union
Seventh Framework Programme (FP7/2007-2013) under grant agreement n°
314175. The partners are Schneider Electric Industries SAS (FR), CSEM (CH), CEA-
INES (FR), Neurobat (CH), Leclanché (DE), Tekniker (ES), Zigor R&D (ES), D’Appolonia
(IT), National Technical University of Athens (GR), Planair (CH), Cisco (NL), European
Consulting Brussels (BE), VTT (FI), ZEDfactory (UK) and Amires (CZ).
from VTT in this context is validation of newly
developed models with its existing sophisti-
cated tools, e.g. APROS [1], for district heating
networks. VTT also contributes to the thermal
storage and solar thermal model development
with other experience [2]. It is important that
detailed/simplified models of AMBASSADOR
handle events properly with fast dynamics like
local loop control and slow dynamics such as
a district heating network or energy storage.
References
[1] Apros Process Simulation Software,
http://www.apros.fi/en/
[2] Heikkinen, J., Rämä, M., Klobut, K.,
Laitinen, A. Solar thermal integration into
a district heated small house. Proceedings
of the 14th International Symposium on
District Heating and Cooling, Stockholm,
Sweden,
7-9 September 2014. Pp. 530-533.](https://image.slidesharecdn.com/r12-150323055322-conversion-gate01/85/Smart-City-Research-Highlights-51-320.jpg)
![51
Smart City Intelligent buildings and urban spaces
and less time-consuming method that can find
the best connections and match the different
types of energy flows indicated in Fig. 1.
Multi-objective optimization
With multi-objective simulation-based building
optimization, it is possible to find optimal values
of decision variables that can achieve defined
conflicting objectives and, at the same time,
satisfy specified constrains. Various decision
variables can be considered on a single build-
ing level (in the building envelope, technical
systems, on-site energy generation/storage,
etc.) and on a district level (centralized energy
systems, energy conversion, distribution and
management, etc.). Examples of the objectives
are minimization of the environmental impacts
(energy consumption, carbon emissions, etc.),
cost (investment cost, operating cost, life cycle
cost), equipment size (generation units, heating/
cooling systems, etc.) and/or maximization
of energy matching, financial return, indoor
air quality, etc. Constraints may indicate that
various criteria (e.g. total investment cost limit,
primary energy consumption, thermal comfort,
etc.) are satisfied. Optimization techniques can
be used in the conceptual and early design
phase, as well as the operational phase, of
intelligent buildings.
Examples of implementation
The author has contributed effectively to the
implementation of advanced multi-objective
optimization methods in real-life building opti-
mization problems including case studies on
building envelope optimization, achieving low-en-
ergy buildings, nearly-zero energy buildings,
maximizing indoor-air thermal comfort, the
building’s energy generation management and
development of algorithms and software [1-6].
For the latter, our newly developed Multi-Ob-
jective Building Optimization software (MOBO)
[1] http://www.ibpsa-nordic.org/tools.php is
an advanced tool that can be used efficiently
to find the optimum solutions to optimization
problems in buildings and energy.
References
[1] Palonen, M., Hamdy, M. & Hasan, A.
MOBO A New Software for Multi-Objec-
tive Building Performance Optimization.
BS-13, IBPSA Building Simulation Confer-
ence, August 2013, France.
[2] Hamdy, M., Hasan, A., Sirén, K. A
Multi-stage Optimization Method for
Cost-optimal and Nearly-Zero-Energy
Building Solutions in Line with the
EPBD-Recast 2010. Energy and Build-
ings, Vol. 56, 2013, pp. 189-203.
[3] Hamdy, M., Hasan, A., Sirén, K. Impact
of Adaptive Thermal-Comfort Criteria
on Building Energy Consumption and
Cooling Equipment-Size Using a Mul-
ti-Objective Optimization Scheme. Energy
and Buildings, Vol. 43, No. 9, 2011, pp.
2055-2067.
[4] Hasan, A. Optimal Multi-Objective Design
of Integrated Micro-generation Systems
and Buildings. DYNASTEE international
workshop on Whole Building Testing,
Evaluation and Modelling for Energy
Assessment, 18-19 May 2011, Lyngby,
Denmark.
[5] Hasan, A. Optimal design of Net Zero
Energy Buildings. World Renewable
Energy Congress, 8-11 May 2011,
Linköping, Sweden.
[6] Hasan, A., Vuolle, M. Sirén, K. Minimi-
sation of Life Cycle Cost of a Detached
House Using Combined Simulation and
Optimisation. Building and Environment,
Vol. 43, No. 12, 2008, pp. 2022-2034.
Acknowledgements
Acknowledgements are due to the
Academy of Finland for funding
the author’s post as a Research
Fellow of the Academy of Finland
2010-2015.](https://image.slidesharecdn.com/r12-150323055322-conversion-gate01/85/Smart-City-Research-Highlights-53-320.jpg)
![52
Eveliina Juntunen,
Research Scientist,
eveliina.juntunen@vtt.fi
Other contributing authors:
Marko Jurvansuu,
Janne Aikio
Introduction
Rising energy costs and concerns over carbon
emissions are the primary driving factors for the
adoption of new technology in lighting globally.
Energy savings in lighting are currently reached
via the switch from traditional light sources to
more efficient ones such as LEDs [1, 2]. None-
theless, smart control is required to achieve the
green targets set by many countries [3]. Smart
lighting can be defined as a technology devel-
oped for energy savings and user comfort with
added benefits such as a long operating time
and reduced maintenance costs. In addition to
these much-appreciated features, there are major
refurbishment needs in lighting, for legislative
reasons, such as the European Union Ecodesign
Directive (2005/32/EY), which is about to ban
many lamp types widely used in, for example,
Intelligent street lights
adapt to conditions
street lighting. This will further induce the devel-
opment towards LED-based intelligent systems.
Street lighting is an excellent demonstrator of
the energy savings of smart control. It is estimated
that the world’s 220 million street lights use 159
TWh of energy annually, generating 81 megatons
of CO2 emissions [4]. By employing new LED-
based street lighting systems, a city of one million
inhabitants, for example, could generate energy
savings worth 2-3 million euros annually [5]. The
environmental and economic impact is significant
because street lighting is widely deployed, the
power level in luminaires is high (18-400 W) and
the intelligence level is traditionally low.
Traditional street lights work on full power
when turned on, and the amount of light is not
usually adjusted. Active control of street lighting
was not previously feasible due to the difficulty
Figure 1. Visio of smart street
lighting in the future
Acknowledgements
The authors would like
to thank the following
organizations for
their co-operation
in the AthLEDics
project: Tekes, Aalto
University, LumiChip,
Helvar, City of Helsinki,
City of Jyväskylä,
Alppilux, Ensto
Finland, MTG-Meltron,
Senaatti-kiinteistöt,
YIT, Enerpoint, Hella
Lighting Finland,
Herrmans, Oplatek,
Sabik and Valopaa.](https://image.slidesharecdn.com/r12-150323055322-conversion-gate01/85/Smart-City-Research-Highlights-54-320.jpg)
![53
Smart City Intelligent buildings and urban spaces
of dimming traditional light sources. With the
current LED revolution, smart features have
become reality, and intelligent software-controlled
street lighting systems have started to emerge
on the market.
In the AthLEDics project, VTT demonstrated
a street lighting system that adapts to the ambient
conditions with the help of sensors and wireless
communication, allowing the luminaires to be
dimmed based on natural light, environmental
conditions (for example, light reflected from snow)
and the presence of pedestrians. In order to
maintain comfort, several characteristics that are
important to road users, such as the amount and
colour of light and the shape of the light beam,
were considered in the luminaire design. The
system developed with intelligent street lights was
tested along a pedestrian road in Helsinki, with
commercial luminaires installed as a reference.
The research aimed to demonstrate energy sav-
ings in a real use environment without sacrificing
end-user comfort. To validate the results, the
energy consumption was recorded with different
intelligence modes. With lighting levels adjusted
according to the presence of users or to natural
lighting conditions, an energy-saving potential
of more than 40 per cent with integrated ICT
was shown. Research partner, Aalto University,
carried out a survey of the experiences of the
pedestrians and the developed luminaire received
the best feedback in the survey. [6, 7]
Urban impacts and implementation
Lighting is needed everywhere. As part of smart
cities and smart buildings, lighting is developing
towards a more controllable, automated and
energy-efficient part of our lives. It is easy to
understand how added intelligence can bring
comfort and performance to people in their
everyday tasks. In addition, lighting will be
developed in connection with multimedia and
take advantage of social media channels to
be another carrier of feelings and experiences.
With the new features and applications, there is
good business potential with positive economic
growth expectations. Fortunately, part of this
growth could be realized in Finland where new
start-up businesses in this area have developed
successfully. Beyond illumination, lighting will
be increasingly integrated with communication,
and sensor and actuator technologies in the
near future.
References
[1] Krames, M. R., Shchekin, O. B., Muel-
ler-Mach, R., Mueller, O. G., Zhou, L.,
Harbers, G., Craford, M. G. 2007. Status and
Future of High-Power Light-Emitting, Diodes
for Solid-State Lighting. Journal of display
technology, Vol. 3, No. 2, pp. 160-175.4
[2] Crawford, M. H. 2009. LEDs for Solid-State
Lighting: Performance Challenges and Recent
Advances. IEEE journal of selected topics in
quantum electronics, Vol. 15, No. 4, pp. 1028-
1040.
[3] European Commission. 2011. Lighting the
Future, Accelerating the Deployment of Inno-
vative Lighting Technologies, COM (2011) 889
final.
[4] Street Lighting Retrofit Projects: Improv-
ing Performance, while Reducing Costs
and Greenhouse Gas Emissions. White
Paper. 2010. Clinton Climate Initiative, Out-
door Lighting Program. (http://www.dvrpc.
org/energyclimate/eetrafficstreetlighting/pdf/
CCI_EE_Streetlighting_White_Paper.pdf)
[5] European Investment Bank, European PPP
Expertise Centre
http://www.eib.org/epec/ee/documents/fact-
sheet-street-lighting.pdf
[6] Juntunen, E., Tetri, E., Tapaninen, O.,
Yrjänä, S., Kondratyev, V., Sitomaniemi,
A., Siirtola, Sarjanoja, E.M., Aikio, J. 2013.
A smart LED luminaire for energy savings in
pedestrian road lighting, Lighting Research
and Technology, published online 7 November
2013. Doi: 10.1177/1477153513510015
[7] Juntunen, E. 2014. From LED die to a lighting
system. Performance improvement in LED
lighting by means of thermal management
and smart control. Doctoral dissertation. VTT
Science: 64 VTT, Espoo. 82 p. + app. 46 p.
http://issuu.com/vttfinland/docs/s64](https://image.slidesharecdn.com/r12-150323055322-conversion-gate01/85/Smart-City-Research-Highlights-55-320.jpg)
![54
Introduction
Paper city mills are leading the positive change to
reduce waste via increased recycling and utilization
of side streams. Smart utilization of recoverable
resources brings novel ecosystems into the
cities alongside the people living in them. These
novel ecosystems include recycling of water and
paper, with improved energy efficiency and waste
reduction. This is a true multiple-WIN scenario
for all. These city mills truly reuse large streams
from people’s everyday activities (paper, board
and water), providing an opportunity to use less
valuable resources via recycling.
Long traditions in
paper-making have changed
Traditionally main raw material has been wood
and paper mills have therefore been located near
forests and the energy is sourced from either wood
or water streams. As raw material recovery has
increased, the location of the units has been more
efficient to change to be nearer the users living
in the cities. This has brought new possibilities.
The raw material has changed
(but is still fibre based)
The raw material recovery has increased over
the last few decades from the negligible level of
the 1950s to the current European recycling rate
of 72% [1]. Recovered paper is collected from
various sources like paper converters, printers
and distributors. It also comes from used paper
products from shops, consumers in private
homes, offices and institutional settings. Used
paper collection is a successful business venture,
especially in densely populated countries with
high paper consumption per capita [2]. People of
Janne Keränen,
Senior Scientist,
janne.keranen@vtt.fi
Citymills leading the positive
change in recycling
Other contributing authors:
Janne Poranen
the cities have made this change toward circular
economy possible.
P&P industry products are used in many
sectors and combined with other materials. Many
of the consumption habits for the products are
‘built in’ at societal level. One of largest sectors
is the food industry.
…needs are changing
at an increasing rate
New generations consume paper differently to the
generations before them, and as they age, the
total demand for paper and board changes. The
substitution of paper in many applications, such
as advertising and communication, has changed
with the Internet. For packaging applications, the
need is growing. Tighter legislation, e.g. landfill
taxes, will influence production costs, putting
pressure on developing products that contain
zero waste and higher recycling potential. Fibre
scarcity in some areas is already a reality, putting
pressure on developing new applications with
lower fibre use.
Work has been done
to prepare for this change
Three larger steps were made: In the first step
at academic level, strong (raw materials, water,
energy and chemicals) management expertise
was built. This management expertise was needed
to function in a more enclosed environment with
energy and raw material stream optimization
using energy- and resource-efficient production
technologies. This work was funded by Tekes
(Cactus and Process-Integration programmes [3,
4]). These programmes aimed to build strong raw
materials, water, energy and chemical manage-](https://image.slidesharecdn.com/r12-150323055322-conversion-gate01/85/Smart-City-Research-Highlights-56-320.jpg)
![55
Smart City Intelligent buildings and urban spaces
ment expertise in a more enclosed environment
combined with energy and raw material stream
optimization. This created the necessary foun-
dation for slow change, which is typical of large
production facilities. In addition to this, the EffNet
programme [5] has focused on a completely new
type of energy- and resource-efficient production
technology for web products and designed fibre-
based production concepts and new products
that help to reduce the environmental impact
of the mills.
The second step was taken at the industrial
level. This work used the base that was created,
and production units were made that could imple-
ment the change efficiently. As an example of this
new efficient way, Holmen Paper Madrid sets the
standard when it comes to paper and recycling,
turning old into new in just a few seconds [6]. At
this unit, production is based 100 per cent on
recycling of recovered paper; with the produc-
tion process also using 100 per cent recovered
and treated water. This work continues, e.g., in
on-going projects like Reffibre [7] (funded by EU,
FP7), started in November 2013, and is aimed at
developing tools tested with innovative concepts,
including fractionation of input materials and
production of novel products from side streams.
The third step, which is now starting, is the
strategic level shift, which extends beyond the
individual company. This step requires strong
commitment from both industry and society,
with political will. The strategic level change in
many value chains that arises from the generated
knowledge has started, and novel value chains
have begun to form, e.g. novel side stream uti-
lization models [7] have been started to explore
reducing the waste generation in urban areas. This
strategic level shift extends beyond the individual
company and benefits the companies in the value
chains linking to it. It thus also gives benefits to
the countries in which the value chains operate.
This requires strong encouragement to happen,
but the will is there.
Discussion
The three-step approach from management
expertise via industry-level production unit change
to strategic level shift combining all streams of
production and use has and will make increases in
resource recovery from users possible also in the
future. Consumers are an important part of this
chain, since they provide most of the raw mate-
rial required by the production units, making the
cities more self-sufficient and produce less waste.
People make the city a better place to live in.
References
[1] CEPI news 30 August 2013, http://www.cepi.
org/node/16410 (22.4.2014) Recycled Fiber
and Deinking – Book 7 – Lothar Göttsching,
Heikki Pakarinen, Suomen Paperi-insinöörien
Yhdistys, Technical Association of the Pulp
and Paper Industry, Fapet Oy, 2000 – 649 p.
[2] Timonen, J., Antikainen, M., Huuhka, P.
(eds.). Integroinnista kilpailukykyä pro-
sessiteollisuuden toimintayhteisöissä,
Teknologiaohjelmaraportti 9/2005, ISSN
1239-1336, 2005, 50p. (in Finnish) www.
tekes.fi/Julkaisut/integroinnista_kilpailu9_05.
pdf (22.4.2014)
[3] Komppa, A., Neimo, L. (eds.). Vähävetinen
paperin valmistus CACTUS 1996-1999,
Teknologiaohjelmaraportti 1/2000, ISSN
1239-1336, 2000, 72p. (in Finnish)
[4] http://www.tekes.fi/julkaisut/cactus.pdf
(24.9.2014)
[5] http://fibic.fi/programs/effnet (22.4.2014)
[6] http://www.holmen.com/About-Holmen/
Business-Areas1/Business-Areas/Hol-
men-Paper-Madrid/ (22.4.2014)
[7] www.reffibre.eu (www-pages, accessed
22.4.2014)
Acknowledgements
The funder of the long-term work described here, in addition to industry contribution,
is Tekes – the Finnish Funding Agency for Innovation and EU FP7. The latest research
leading to these results has received funding from the European Community's Seventh
Framework Programme under grant agreement n° 604187.](https://image.slidesharecdn.com/r12-150323055322-conversion-gate01/85/Smart-City-Research-Highlights-57-320.jpg)
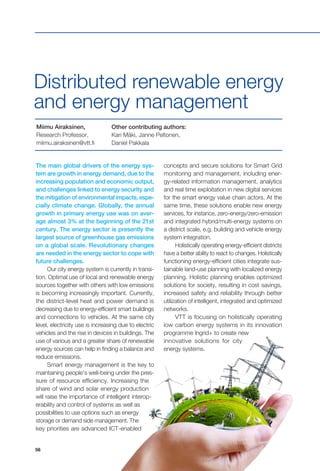
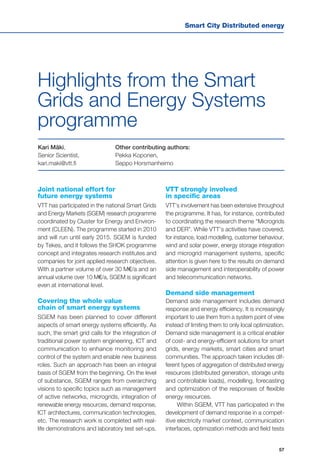
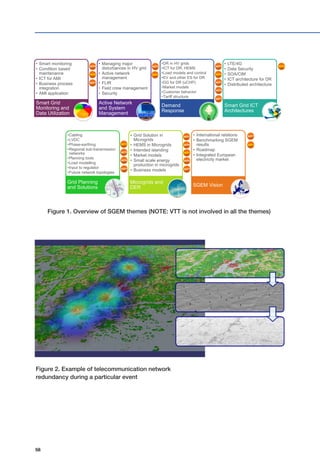
![Smart City Distributed energy
59
for load control. VTT has long experience of
this topic from preceding EU projects such as
EU-Deep and ADDRESS.
Interoperability of power and
telecommunication networks
Research work conducted by VTT addresses
the increasing interdependency of electricity
distribution and mobile communication networks.
Such interaction is evident from the increasing
use of automation and remote control in smart
grids. However, these interdependencies have
not been studied extensively before SGEM.
The actions taken have focused on suburban
and rural areas in the southern and northern
parts of Finland, complemented with field tests
in both areas.
The main approach is based on model-
ling environmental factors (for instance, terrain
heights, tree stands, clutter), electricity distribution
networks (for instance, substations, feeders,
disconnectors) and mobile communication
networks (for instance, 2G/3G coverage, base
stations, terminals). New tools are developed
by integrating these factors. These tools enable
analysis of interdependencies between elec-
tricity distribution and mobile communication
networks. They can be further used to improve
the management of electricity distribution during
storms and maintenance crew management and
to develop precautionary actions that improve
system resilience.
References
[1] Koponen, Pekka; Mutanen, Antti;
Niska, Harri: Assessment of Some
Methods for Short-Term Load Forecast-
ing, IEEE PES ISGT Europe 2014.
[2] Koponen, Pekka; Takki, Pekka: Fore-
casting the responses of market based
control of residential electrical heating
loads. CIRED 2014, Paper 0178.
[3] S. Horsmanheimo, N. Maskey, H.
Kokkoniemi-Tarkkanen, L. Tuo-
mimäki, P. Savolainen, “A tool for
assessing interdependency of mobile
communication and electricity distri-
bution networks”. IEEE International
Conference on Smart Grid Communica-
tions (SmartGridComm) 2013.
[4] M. Kamali, M. Kolehmainen, M. Neo-
vius, L. Petre, M. Ronkko, P. Sandvik,
S. Horsmanheimo, “On Proving Recov-
erability of Smart Electrical Grids”, 2014,
TUCS publication series, http://tucs.fi/
publications/view/?pub_id=tHoKaKoNe-
PeRxSa13a.
Acknowledgements
The authors gratefully acknowledge the funding and contributions from
Tekes – the Finnish Funding Agency for Technology and Innovation as well as
co-operation activities with CLEEN and all SGEM partners.](https://image.slidesharecdn.com/r12-150323055322-conversion-gate01/85/Smart-City-Research-Highlights-61-320.jpg)
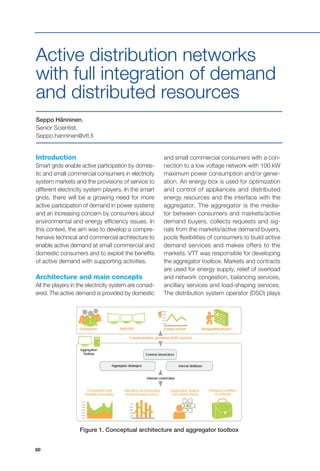
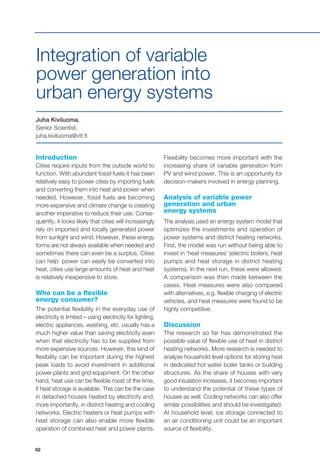
![Smart City Distributed energy
63
0
75
150
225
300
375
450
-600
-400
-200
0
200
400
600
800
1000
1200
Electricityprice(€/MWh)
Heatstoragecontent(%)
Heatproduction(MW)
NG_EX_UR
NG_BP_UR
MW_HB_UR
MW_BP_UR
EL_HP
EL_HB
Storage use
Elec. price
Stor. content
-5000
-2500
0
2500
5000
7500
10000
12500
15000
17500Electricityproduction(MW)
Wind
Natural gas (NG)
Hydro
Wood waste (WW)
Peat
Solid wood (WO)
Forest residues (WR)
Municipal waste (MW)
Nuclear
Electricity to heat
References
[1] Kiviluoma, J. Managing wind power variability
and uncertainty through increased power
system flexibility, VTT Science 35, PhD dis-
sertation, Aalto University School of Science,
September 2013. http://www.vtt.fi/inf/pdf/
science/2013/S35.pdf
Figure 1. Four days of power generation from the analysis. Negative generation indicates
the use of electric heat boilers and/or heat pumps.
Figure 2. Four days of heat generation from the analysis. Negative generation indicates
charging of heat storage.
[2] Kiviluoma, J., Meibom, P. Flexibility from
district heating to decrease wind power
integration costs. In: Proc. of the 12th Inter-
national Symposium on District Heating and
Cooling, pp. 193-198, Tallinn, Estonia, 5-7
Sep. 2010.
Acknowledgements
The author gratefully acknowledges the SGEM programme funded by Tekes – the
Finnish Funding Agency for Technology and Innovation, as well as funding from VTT.](https://image.slidesharecdn.com/r12-150323055322-conversion-gate01/85/Smart-City-Research-Highlights-65-320.jpg)
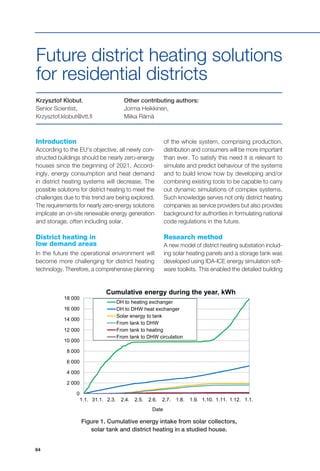
![Smart City Distributed energy
65
0%
5%
10%
15%
20%
25%
30%
35%
40%
45%
I II III IV V VI VII VIII IX X XI XII
Case A Case B Case C
energy simulation in combination with a detailed
district heating substation model, including
solar heating. Such coupling made it possible
for the first time to simulate the performance of
the combined solar and district heating system,
taking into account the heating load in each room
and domestic hot water consumption at each
time instant. For the network part, the district
heating network model was used, developed
by VTT, which performs dynamic temperature
simulation. Thus, the whole energy chain was
covered in the simulation.
Discussion
Simulations showed that solar collectors in
district heated small houses may help to save
approximately 50 % of the energy needed for
heating the domestic hot water in Finnish climate,
whereas the impact on the space heating energy
was marginal (Figure 1). Solar thermal integration
with district heating will affect the return tem-
perature of the primary side during the summer
time [1]. Simulation of a low heat demand area
with three separate cases with alternative con-
nections exposed a strong correlation between
heat demand density and efficiency in terms of
relative heat losses (Figure 2). Also temperature
variation and drop especially outside heating
season were observed [2].
References
[1] Heikkinen, J., Rämä, M., Klobut, K. & Laiti-
nen, A. Solar thermal integration into a district
heated small house. Proceedings of The 14th
International Symposium on District Heating
and Cooling, Stockholm, Sweden, 7 - 9 Sep-
tember 2014. Pp. 530 - 533.
[2] Rämä, M., Heikkinen, J., Klobut, K. &
Laitinen, A. Network simulation of low heat
demand residential area. Proceedings of The
14th International Symposium on District
Heating and Cooling, Stockholm, Sweden,
7 - 9 September 2014. Pp. 539 - 542.
Figure 2. Monthly relative heat losses for three studied cases.
Acknowledgements
This study was funded by Finnish Funding
Agency for Technology and Innovation
(Tekes), Finnish Energy Industries,
Ekokem Oy Ab, Hyvinkään Lämpövoima
Oy, Jyväskylän Energia, Helsingin Energia,
City of Hyvinkää, Porvoon Energia Oy,
Riihimäen Kaukolämpö Oy and VTT.](https://image.slidesharecdn.com/r12-150323055322-conversion-gate01/85/Smart-City-Research-Highlights-67-320.jpg)
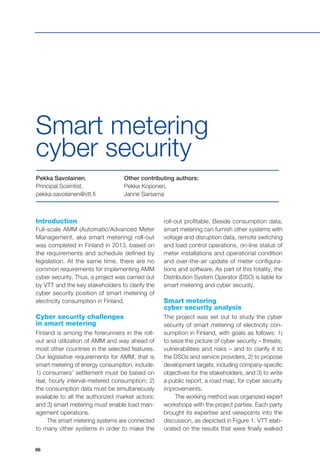
![Smart City Distributed energy
67
How we did it: Smart metering project parties in collaboration
Current state
analysis
System configuration
Scoping
International position,
technologies, standards
Service providers
(vendors)
Technologies and processes
Meter manufacturers’ products
System providers’ solutions
Collaboration processes
Management and operation of the
smart metering systems
DSOs (prime
stakeholders)
System architecture
Actors, collaboration
Roles and
responsibilities
Cyber security
management
Literature surveys
Enquiries (external DSOs)
Workshops (companies)
Development targets (common and company specific)
Recommendations
Final report
“the roadmap”
Smart Metring Cyber
Security
• State of practice
• The big picture
Figure 1. Joint effort for shared understanding
and baseline of cyber security development
through in a joint closing workshop, where
the risks were also eventually analysed. The
common results are available in [1].
Bottom line
The work, including recommendations for
further action for smart-metering developers
and DSOs, helps the liable parties to create a
firm baseline for trustworthy smart metering.
Acknowledgements
Compliments to the participating
companies and the Finnish Energy
Industries’ research pool for the
resources to commit to this work.
References
[1] Savolainen, P. et al. AMM Tietoturva, VTT-CR-08759-13. 55 p. (11 Dec 2013) http://energia.fi/sites/
default/files/amm_tietoturvaselvitys_ja_roadmap_v10_0.pdf](https://image.slidesharecdn.com/r12-150323055322-conversion-gate01/85/Smart-City-Research-Highlights-69-320.jpg)
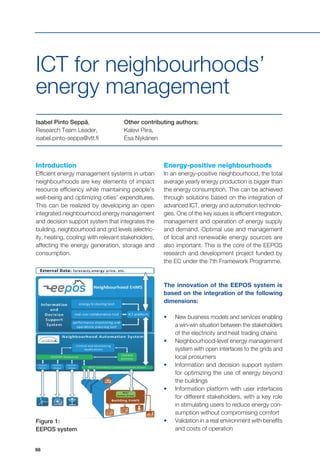
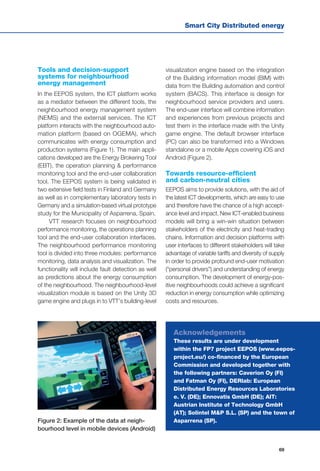
![70
Introduction
The challenge of future energy management
systems is to control low energy or even ener-
gy-neutral or positive districts and to increase the
share of renewable energy. The challenge is to
optimize the use of different energy sources in
the best way, using smart energy management
systems and energy storage. The new actors
and business models may evolve into a district
energy field.
Holistic approach with
Energy-hub concepts
The objective of the eHub project (Energy-Hub for
residential and commercial districts and transport)
is to develop a district system for multi-resource
input, conversion, storage and distribution of
energy carriers for maximum use of the renew-
able energy potential harvested at district level.
Energy hub systems optimize the use of renew-
able energy and required information exchange
in a district. An Energy Hub is “a physical cross
point, similar to an energy station, in which energy
and information streams are coordinated, and
where different forms of energy (heat, electricity,
chemical, biological) are converted between each
other or stored for later use” [1].
Simulation as a tool for developing
new control strategies
The project developed the eHub simulation tool
for overall analysis of energy concepts, including
models for energy consumption and production
and an energy management system (Figure 1).
The smart control algorithms implemented in the
simulation environment will control smart house
appliances, indoor temperatures, district energy
production and energy storage. The management
Ismo Heimonen,
Senior Scientist,
ismo.heimonen@vtt.fi
Energy-Hub for residential and
commercial districts and transport
system matches the supply and demand of heat
and electricity using the multi-commodity matcher
(MCM) developed during the project.
Storage technologies are needed
to match supply and demand
The project has developed storage solutions to
improve the matching of supply and demand in
thermal energy. The thermo-active foundations,
thermo-chemical materials and control strategies
associated with these applications have been
studied.
New business concepts
for stakeholders
The questionnaire survey [2] was conducted
for the main stakeholders, e.g. end-users and
service providers, to find out what kind of new
services are needed by the end-users now and
in the future (Figure 2), what kind of services are
expected from service providers, what kind of
services are offered by service providers and what
kind of new services they are willing to offer in the
future. These results were used as a basis for the
development of new business and services (see
other paper in this book and [3]). Many of business
concepts are based on energy consumers and
producers having a certain amount of flexibility
available in their energy demand and supply.
Users’ involvement in the
development process
The role of consumers is changing from pas-
sive users of energy to active participators in
energy management. Consumers will be actively
involved in energy management (regarding, e.g.,
load shifting and real time pricing) and will also
be producers of renewable energy. Consumer](https://image.slidesharecdn.com/r12-150323055322-conversion-gate01/85/Smart-City-Research-Highlights-72-320.jpg)
![Smart City Distributed energy
71
0 100 200 300 400 500
Buying pools (Someone is organizing group of customers to find the
best contract to buy energy at cheap price)
Producers' pools ;Aggregators (Aggregator acts as a consultant for
customers who constantly reviews the price and load and negotiates
cheapest prices with energy providers)
Demand side management (DSM) pools / Load management group
(A group of consumers which controls the load to aquire a cheaper
price for energy on a contractual level)
Customer side broker or procurement manager
N
Which of the following you would be interested in?
All answers…
acceptance is a key success factor of the diffusion
of new energy management solutions and, for this
reason, it is important that the new technological
solutions are developed from the end-user per-
spective. The user study was performed to find out
about occupant attitudes towards different levels of
automation in domestic control systems [4].
Demonstration and feasibility
studies are showing the benefits
of energy business concepts
The performance of the proposed business models
and control strategies is tested in feasibility studies. A
MultiCommodity Gateway for the agent-based control
system was installed in each unit of the building (106
dwellings and 9 commercial units) in a real district at
Tweewaters in Belgium. Four other cases were studied
by simulations: Freiburg (Germany), Bergamo (Italy),
Hounthaven (the Netherlands) and Dalian (China).
References
[1] Energy Hub project: Energy-Hub for residential
and commercial districts and transport. Project
website http://www.e-hub.org/
[2] Virtanen Mikko, Heimonen Ismo, Sepponen
Mari, 2014: Stakeholder analysis and question-
naire showing the way for the development
of business and service models. Renewable
Energy Research Conference, RERC 2014,
conference proceedings. Oslo, Norway, June
16-18, 2014.
[3] Sepponen Mari, Heimonen Ismo, 2014:
Development of business concepts for Energy
Hub systems. Conference proceedings ECOS
2014: 27th International Conference on Effi-
ciency, Cost, Optimization, Simulation and
Environmental Impact of Energy Systems.
Turku, Finland, June 15-19, 2014.
[4] Karjalainen, Sami. 2013. Should it be
automatic or manual – The occupant's per-
spective on the design of domestic control
systems. Energy and Buildings. Elsevier, vol.
65, pp. 119-126.
Figure 1.
eHub
simulation
platform [1]
Figure 2.
Interests in different
service models [2]
Acknowledgements
The project “E-Hub: Energy-Hub for residential
and commercial districts and transport”
is funded under the specific programme
“Cooperation” in the FP7 framework initiative
“Energy efficient Buildings (EeB, FP7-2010-
NMP-ENV-ENERGY-ICT-EeB)”.](https://image.slidesharecdn.com/r12-150323055322-conversion-gate01/85/Smart-City-Research-Highlights-73-320.jpg)
![72
Introduction
Energy Positive Neighbourhoods (EPNs) are
those in which the annual energy demand is
lower than the energy supply from local renewable
energy sources [1]. The IDEAS project strives to
demonstrate how EPNs can be cost-effectively
and incrementally implemented by designing,
testing and validating energy management and
urban planning tools and related user interfaces
and business models in a residential neighbour-
hood in Porvoo Finland and a university campus
in Bordeaux, France. This paper presents pre-
liminary results on ICT-supported business in
EPNs that will be validated through real case
demonstrations [2].
Methods and aims
The IDEAS project will illustrate how communi-
ties, public authorities and utility companies can
be engaged in the development and operation
of EPNs. The methods used in this research
include interviews and workshops with repre-
sentatives of all the key stakeholders involved
in the demonstrations including representatives
of energy companies, city authorities, facility
managers and energy consumers. Business
model concepts are developed to support the
development of EPNs. They are demonstrated
Aapo Huovila,
Research Scientist,
aapo.huovila@vtt.fi
Other contributing authors:
Mia Ala-Juusela
ICT-supported business
in energy positive
neighbourhoods
in the pilots with the key stakeholders and will
be up-scaled to a wider European scale and
different contexts beyond the demonstrations.
Results and discussion
Based on the identified stakeholder needs and
the ability to create EPNs, a local actor – named
“Energy Positive Neighbourhood Service Pro-
vider” (EPNSP) – has become a necessity (see
Figure 1) [3]. It would provide several physical,
centralized and distributed infrastructures to
support the use of renewable energy sources
and help to reduce and manage smartly the
energy demand in real time through different
ICT-based services and economic incentives.
Such an actor does not yet exist and is being
tested in the project as a combination of different
organizations, i.e. in Porvoo with the local city
authorities and the local energy companies that
generate, distribute, sell and/or buy electricity
and/or heat from renewable energy sources.
Instead of only optimizing local solutions, it
is key to integrate the local energy solution
with the existing national energy systems and
infrastructures. There are still regulatory and
financial barriers that hinder the full implemen-
tation of EPNs. Once these can be overcome,
the solutions should be up-scaled to city scale.](https://image.slidesharecdn.com/r12-150323055322-conversion-gate01/85/Smart-City-Research-Highlights-74-320.jpg)
![Smart City Distributed energy
73
References
[1] Ala-Juusela, M. et al. IDEAS project Deliverable 3.1 Case Study Scoping. 2014. 60 + 13 p.
Available at: http://www.ideasproject.eu
[2] Huovila, A. et al. IDEAS project Deliverable 2.1 Business & Community Requirements Analysis.
2014. 58 + 24 p. Available at: http://www.ideasproject.eu
[3] Crosbie, T. et al. IDEAS project Deliverable 2.2 Specific Business Models for Demo Cases. 2014.
46 + 17 p. Available at: http://www.ideasproject.eu
Figure 1. Elements underpinning the business concept of an
Energy Positive Neighbourhood Service Provider [3]
Acknowledgements
Intelligent Neighbourhood Energy Allocation & Supervision – IDEAS is an ongoing
(2012-2015) Collaborative Project (Grant Agreement No. 600071) that is co-funded
by the European Commission, Information Society and Media Directorate-General
under the Seventh Framework Programme (FP7), Cooperation theme three,
“Information and Communication Technologies”. In addition, all the project partners
are warmly acknowledged: University of Teesside (coordination, UK), CSTB (France),
IBM (Montpellier, France and Haifa, Israel), Nobatek (France), City of Porvoo
(Finland) and Porvoon Energia (Finland). For more information, please visit the
project web page www.ideasproject.eu](https://image.slidesharecdn.com/r12-150323055322-conversion-gate01/85/Smart-City-Research-Highlights-75-320.jpg)
![74
Introduction
Heating houses consumes about one-quarter of
the total energy consumption in Finland [1]. To
reduce emissions and combat climate change,
it is important to increase energy efficiency,
introduce renewable energy solutions and find
smart ways to heat houses. However, while
technical solutions are available, several pilot
projects have been conducted, and EU- and
national-level political targets and legislation
create pressure to change, there has not been
a systemic change. Why not? The research
question of this research highlights what kinds of
issues shape and hinder the paths to renewable
and energy-efficiency solutions in new districts.
Why this research and for whom?
This research identifies critical changes that
decision-makers in the government, municipalities
and companies need to implement together in
order to accelerate Green Growth and the path
to renewable and energy-efficiency districts. An
understanding of these changes including the
actors, drivers and barriers shape the system,
simply by changing the ways to work, e.g.
public-private collaboration, or by changing the
system constraints, e.g. state subsidies. The
research also highlights the role of consumers
as system shapers.
Nina Wessberg,
Senior Scientist,
nina.wessberg@vtt.fi
Renewable energy and energy
efficiency in new districts –
how to accelerate systemic
change towards smart cities
Other contributing authors:
Johanna Kohl,
Mikko Dufva
How was the research applied?
The starting point for this research was the mul-
ti-level perspective [2] framing society and the
development of the new innovation system in it
as a multi-level process focusing on micro-level
actions, such as experimentation, collaboration
and attitudes. The current regime was studied
by expert interviews. Niche-level developments
and drivers and barriers to change were identified
in three case studies: Eco-Viikki in Helsinki and
Vuores and Härmälänranta in Tampere, which
were analysed using the innovation system
functions [3]. The functions were also used in
international comparisons between the Austrian,
Dutch and Finnish passive house innovation
systems. A consumer point of view was iden-
tified by conducting a phone survey with 1000
respondents.
Discussion
The barriers identified include a lack of knowl-
edge and understanding of new solutions,
including new ICT solutions, in houses, limited
public-private collaboration, lack of service
business and shared vision of the whole as
well as a passive role of consumers who do
not identify themselves as system shapers. To
overcome these barriers, six complementary
change paths were structured (Figure 1): 1)](https://image.slidesharecdn.com/r12-150323055322-conversion-gate01/85/Smart-City-Research-Highlights-76-320.jpg)
![Smart City Distributed energy
75
4) Change: Collaboration between
public and private sectors
Actors: Cities and enterprises
Barriers: Fear of favouritism, city plan too ambiguous
Changes needed: Interactive workshops and city
designing processes
Landscape
Regime
Niche
Time
6) Change: Management of the
whole
Actors: Cities, building industry, researchers,
regulation makers
Barriers: Fragmented value chain, lack of the
overall view of energy efficiency, too strong role
of consultants
Changes needed: Named responsibilities in
national and city levels, designing whole areas,
whole cities (house, district, area and city
levels!)
3) Change: Service
business
Actor: The state
Barriers: A lack of skilled labour to
maintain and service the new energy
solutions
Changes needed: Education and
subsidies for business development
2) Change: Role of
consumers
Actors: Cities, building industry,
consumers
Barriers: Conservative attitudes of
consumers and industry, lock-in to
district heat and heat pump systems,
insufficient financial subsidies, lack of
solar energy feed in tariff
Changes needed: Consumers as
powerful system shapers
1) Change: Education and
communication
Actors: The state, cities, enterprises,
researchers
Barriers: Lack of knowledge, rapidly changing
legislation
Changes needed: Education development,
education material development
5) Change: Integration of different policy
sectors
Actor: The state
Barriers: Fragmented value chain
Changes needed: Integrating different policy sectors
(new innovation and business opportunities)
Vision:
Smart
energy-
efficient city
building
Comprehensive integration of the most recent
knowledge about renewables and energy effi-
ciency in the education and communication in
the construction sector, 2) empowerment of
consumers, 3) creation of service business for
renewable energy and energy-efficiency solutions,
4) improved collaboration between public and
private sectors, 5) integration of different policy
sectors and 6) a holistic view of the planning
and building of new districts.
References
[1] Energiateollisuus ry.: Energiatilasto. 2012.
[2] Geels, F.W.: Technological transitions as evo-
lutionary reconfiguration processes: a multi-level
perspective and a case-study, Research policy,
vol. 31, no. 8, 2002, pp. 1257-1274.
[3] Hekkert, M.P., Suurs, R.A., Negro, S.O.,
Kuhlmann, S., Smits, R. Functions of inno-
vation systems: A new approach for analysing
technological change, Technological Forecast-
ing and Social Change, vol. 74, no. 4, 2007, pp.
413-432.
Figure 1. Change paths and barriers to applying renewable energy and energy efficiency
in new districts presented in the multi-level perspective frame.
Acknowledgements
The research was funded by the
TEKES Green Growth programme. We
would like to thank Professor Matthias
Weber and Bjoern Budde from the
Austrian Institute of Technology and
Professor Marko Hekkert and Alco
Kieft from Utrecht University for their
collaboration in this work. We also
appreciate our close cooperation with
the Low Carbon Finland Platform 2050
project, especially Tiina Koljonen
and Lassi Similä from VTT. Our
gratitude also goes to all the people
who participated in the interviews
and workshops, especially the city of
Tampere, Skanska Ltd. and numerous
other organizations and companies.](https://image.slidesharecdn.com/r12-150323055322-conversion-gate01/85/Smart-City-Research-Highlights-77-320.jpg)
![76
Introduction
The Internet of Energy [1] refers to the challenge
related to seamless, secure connectivity and
interoperability when connecting the Internet
with the smart energy grids. Electric mobility is
one potential application area for the Internet
of Energy. It includes aspects of distributed
Embedded Systems, their hardware and software
building blocks, wireless Internet connectivity,
interoperable machine to machine (M2M) ser-
vices and smart charging infrastructures. Smart
charging solutions are needed for electrical
vehicles (EVs) because of needs for interoper-
ability, improving energy efficiency, lowering fuel
cost per kilometre, and significant lowering the
Co2 emissions especially in densely populated
urban areas.
Juhani Latvakoski,
Principal Scientist, Senior Project Manager (IPMA-C),
Juhani.latvakoski@vtt.fi
Internet of Energy:
Electric Mobility with
Smart Grids
Electric Mobility with Smart Grids
The smart electric mobility solutions needs to be
able to interoperate with smart homes, building
automation systems, distribution grids, distributed
energy resources, energy providers, vehicles,
consumers, prosumers and many other novel
stakeholders, such as e.g. charging operators,
in the future Internet of Things/Cyber-Physical
Systems. The resulting electric mobility infrastruc-
ture with enlarging population of EVs is expected
to trigger significant changes in modern urban
environments, and therefore this research are
seen to be essential and important.
Smart Charging of Electric Vehicles
The operational range of EVs is usually limited
due to the limitations of batteries, and therefore
Figure 1. Simulation based study on the use of EV charging for help in balancing local
distribution grid.](https://image.slidesharecdn.com/r12-150323055322-conversion-gate01/85/Smart-City-Research-Highlights-78-320.jpg)
![Smart City Distributed energy
77
scheduling of charging sessions, charging point
reservations and navigation are especially impor-
tant for drivers on the move. From the energy
distribution grid point of view, it is important to
predict the load in advance or at least be able
to balance the production and consumption to
manage demand response situation in distri-
bution grid.
Enabling the required smart charging system
requires such steps as location of nearby charging
posts, querying their reservation status, reserving
charging posts and cancelling the existing res-
ervations. These actions require smooth mobile
connection between the vehicle, charging point
and back-office systems related to charging point
and energy system management. VTT and group
of Finnish companies have developed enablers for
such smart charging systems, which enable e.g.
standard based charging of EVs, remote reser-
vation of charging posts, and smart charging of
electric vehicles taking into concern energy price
and situation in the local distribution grid [2, 3].
When the EV is plugged into the charging
point, it is connected with the local distribution
grid via the Electric Vehicle Supply Equipment
(EVSE) using e.g. ISO/IEC 15118 standard.
Then it becames to be a part of the smart grid
and charging infrastructures, where the dynamic
elements in energy consumption (e.g. EVs) and
production (e.g. wind mills), keeping the elec-
tric grid in balance, peak loads, lack of energy
storages and increased uncertainty and cost for
energy companies are essential challenges. VTT
has studied the possibility for using EV batteries
and charging infrastructures for help in balancing
local energy grids by means of simulations [4,
5]. In the solution, the changes in the load of
the simulated local distribution grid (simulation
model), trigger changes in the charging powers
of each specific simulated EVs.
Discussion
It has been estimated that significant lowering
the pollution and the Co2 emissions is especially
required in densely populated urban areas. The
results of this research are estimated to signifi-
cantly contribute towards that direction via smart
charging solutions. Especially, the contributions
related to interoperability and balancing local
distribution grid indicate that enabling smartness
contribute towards that direction.
References
[1] Artemis Internet of Energy Homepage: http://www.artemis-ioe.eu/
[2] http://www.vtt.fi/medialle/uutiset/suomalaisinnovaatiot-mullistavat-sähköauton-käytön
[3] Latvakoski J. 2013. ETSI M2M in the electric mobility context. Presentation in the European Con-
ference on Nanoelectronics and Embedded Systems for Electric Mobility. Nesem 2013, 25-27 Sep
2013. Toulouse, France.
[4] Latvakoski J., Ronkainen J., Mäki K. 2014. Use of EV charging systems for balancing local energy
grids – a simulation based approach. Presentation in the European Conference on Nanoelectronics
and Embedded Systems for Electric Mobility. Nesem 2014, 24-25 Sep 2014. Erlangen, Germany.
[5] Latvakoski J., Mäki K. , Ronkainen J., Julku J., Koivusaari J. Simulation based approach for Stud-
ying Balancinc Local Distirbution Grids with Electric Vehicle Batteries. Under revision to be published
in Systems Journal ISSN 2079-8954. 24p
Acknowledgements
The author gratefully acknowledge
the funding of all the 38 partners of
the Internet of Energy (IoE) project
including contributions from ARTEMIS
(Advanced Research and Technology
for Embedded Intelligence in Systems)
Joint Undertaking organization and ten
national funding authorities in Austria,
Belgium, the Czech Republic, Germany,
Italy, The Netherlands, Norway, Spain,
United Kingdom and Finland from
Tekes - the Finnish Funding Agency for
Technology and Innovation.](https://image.slidesharecdn.com/r12-150323055322-conversion-gate01/85/Smart-City-Research-Highlights-79-320.jpg)
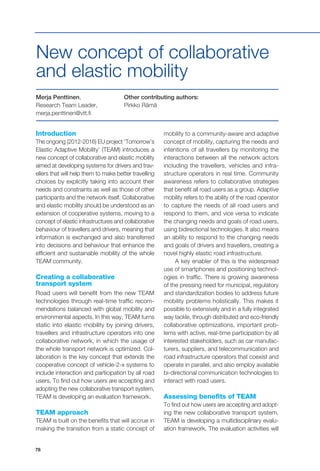
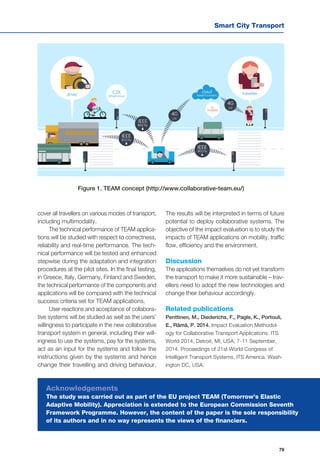
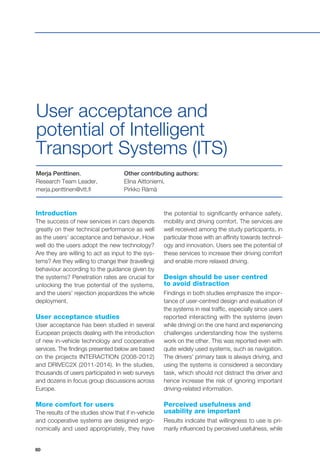
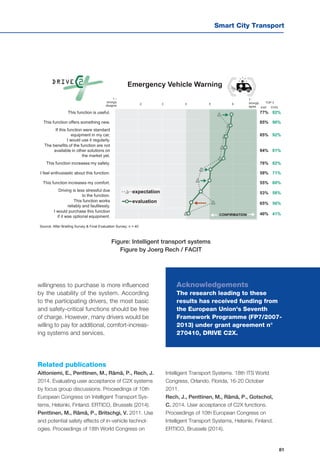
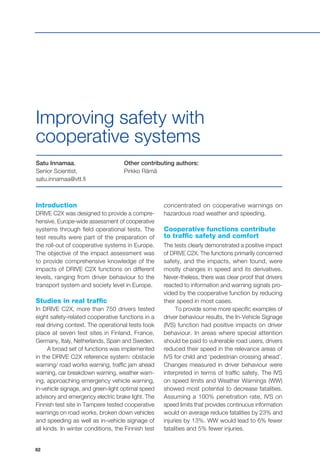
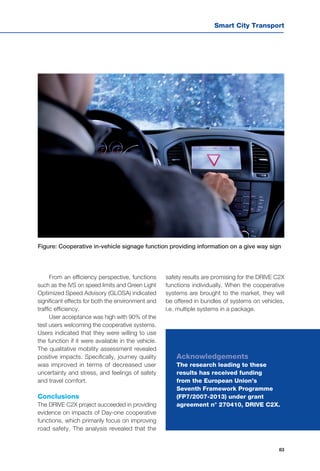
![84
Introduction
The effects of ITS on the sustainability of transport
are an active research topic. Recent projects have
explored the topic by developing and evaluating
ITS applications for eco-driving, fleet and traffic
management [1] tools for real-time measurement
and control of CO2 emissions from traffic [2] and
by facilitating the development of a common
framework for impact assessment [3].
Objectives
The iMobility Challenge project [4] aims to demon-
strate, promote and boost the deployment of
ITS for energy-efficient and sustainable mobility.
The project also takes safety into account in all
its activities because safety is an essential ele-
ment of sustainability of transport and mobility
and it is also reflected in the work carried out
by iMobility Forum.
One of the studies included in the iMobility
Challenge project was the study of car users’
awareness and demand for in-vehicle ITS appli-
cations that contribute to sustainable mobility.
This information was considered essential for
planning and targeting promotional activities to
be carried out during and after the project. The
objective of the study was to analyse European
car users’ demand for a few selected applications
that contribute to the objectives of iMobility
Risto Öörni,
Senior Scientist,
risto.oorni@vtt.fi
Other contributing authors:
Merja Penttinen
Car users’ awareness
and demand for green
in-vehicle ITS
Challenge and iMobility Forum and are available
to consumers on the market. The applications
selected for analysis in the study were speed
alert, emergency braking, eco-driving, start-stop
assistant and real-time traffic information.
Methods used in the study
Users’ awareness and demand for the sys-
tems was studied with a questionnaire that
was answered by over 5000 respondents in
five European countries. The responses to the
questionnaire were collected by a standardized
Internet survey with closed-ended response
alternatives. The questionnaire was aimed at
active car users.
Study results and discussion
The results on car users’ awareness of the
systems under analysis are illustrated in Figure
1. The results showed that there is a moderate
level of user awareness of the systems, but only
a minority of car users have experienced the
systems by themselves.
In addition to user awareness, the study
investigated car users’ willingness to pay for
the systems, see Figure 2.
The results indicated that a moderate level
of user awareness exists for all of the studied
systems. The share of users who indicated they](https://image.slidesharecdn.com/r12-150323055322-conversion-gate01/85/Smart-City-Research-Highlights-86-320.jpg)
![Smart City Transport
85
0 %
10 %
20 %
30 %
40 %
50 %
60 %
70 %
I have used the
system
I have only heard
/ read about the
system
would be willing to pay for the system ranged from
38% in the case of the start-stop assistant to 56%
for emergency braking. In conclusion, this suggests
that a moderate share of users is willing to pay for
the systems analysed in the study. The results of
the study also suggest that most users are willing
to pay an additional cost of €200 at most for the
systems included in the study.
References
[1] http://www.ecomove-project.eu/
about-ecomove/applications/
[2] http://www.carbotraf.eu/
[3] http://www.ecostand-project.eu/
[4] http://www.imobilitychallenge.eu
Figure 1. Car users’
awareness of five
iMobility systems
Figure 2. Car users’ willingness to pay for the systems, all respondents.
Acknowledgements
The study was done as part of the European iMobility Challenge project. The
work carried out by VTT was funded by the Seventh Framework Programme of
the European Union, VTT, Ministry of Transport and Communications, Finland,
and the Finnish Transport Safety AgencyTrafi. I wish to express my thanks to the
stakeholders that have made the project possible.
0 %
5 %
10 %
15 %
20 %
25 %
30 %
35 %
40 %
45 %
50 %
Car users' self-reported willingness to pay,
all respondents
Tyre pressure monitoring
Start-stop assistant
RTTI
Eco-driving assistant
Emergency braking
Speed alert](https://image.slidesharecdn.com/r12-150323055322-conversion-gate01/85/Smart-City-Research-Highlights-87-320.jpg)
![86
project start date: 01.01.2011 | end date: 31.12.2013
Apply the tool to selected functions
Function descriptions
Assumed changes in driver and travel
behaviour
Safety
-Exposure
-Risk
-Consequence
Efficiency
-Traffic flow
-Traffic volume
Environment
-Noise
-Emissions
-Surrounding
Mobility
-Amount of travel
-Travel patterns
-Mobility choice
-Journey quality
Driver behaviour
- Strategic RQs
- Tactical RQs
- Operational RQs
hyp
hyp
hyp
hyp
hyp
hyp
hyp
hyp
hyp
hyp
TopdownBottomup
19th ITS World Congress, Vienna
Introduction
In Field Operational Tests (FOT), users have the
opportunity to use systems in a real use context.
User acceptance will be studied in FOTs but,
even more importantly, evidence will be gained
on the impacts on user behaviour aimed at
finding the most cost-effective solutions and
promoting deployment. Research activities, such
as impact assessment, take place in the middle
of the development and deployment process,
and typically with time pressure. Therefore,
FOTs call for effective tools to handle the many
parallel activities.
Pirkko Rämä,
Principal Scientist,
pirkko.rama@vtt.fi
Other contributing authors:
Satu Innamaa
From field operational tests
to better services –
methods and tools
Tool to define research
hypotheses and indicators
The tool focuses on the starting phase of a FOT.
Research questions (RQ) and hypotheses will
be formulated for driver behaviour – the primary
interest in a FOT – and then just copied and
liked to the other target areas (safety, efficiency,
environment, mobility). This is important because
all other impacts are implications of changes
in driver behaviour, and hypotheses need to
be consistent for different target areas [1]. The
theoretical structures in each target area support
analyses and cover all possible impacts system-
Figure 1. Schematic figure on the creation of research questions and hypotheses](https://image.slidesharecdn.com/r12-150323055322-conversion-gate01/85/Smart-City-Research-Highlights-88-320.jpg)
![Smart City Transport
87
Selection of
relevant safety
mechanisms
Apply to accident data:
Impacts in number of
fatalities and injuries
Forecast of
fatalities
and injuries
for EU28 in
2020 and
2030
EU28
accident
data
Multiply effect by estimated
penetration rates for 2020 and
2030
Multiply effect by relevant
accidents Effect for 100%
penetration
For each relevant mechanism
- Description of effects by
accident class
- Effects in terms of %
including sensitivity analysis
on expert opinion based
estimates
Selection of main
classifying factor
for accident data
atically. Furthermore, each hypothesis is linked
with an indicator and measure for designing
driver behaviour logging.
All this information can be collected in a
big spreadsheet for prioritization for the final
analyses. Linking hypotheses with situational
variables enables more detailed analyses.
European risk
calculation tool (ERiC)
The tool supports safety analyses close to the
final steps in a FOT and scaling up of safety
estimates at European level. Based on system
descriptions, expected and measured impacts on
driver behaviour and literature, the first estimates
on the effectiveness of safety functions have been
provided. In all, nine safety mechanisms [2] are
analysed starting with so-called direct effects,
long-term effects, effects on non-users, exposure
and consequences. All estimates need to be
applied to the targeted accidents and situations.
The tool includes all the (EU28) accident
data by several classifying factors. It provides
the scaled-up results at EU28 level, taking into
consideration how frequently the systems are
in a traffic flow.
Conclusions
The approaches and tools presented here are
based on long experience in expert assessment
and filed tests. They have been powerful in
supporting research activities in development
projects in which time for critical work phases
is typically limited. They also support consistent
and theoretically sound approaches, taking into
consideration all impacts – positive and negative,
intended and unintended. Moreover, the use of
tools supports reporting of the results.
References
[1] Rämä, P., Innamaa, S., Brignolo, R. Creating
research hypotheses and defining measure-
ments for FOT evaluation. Proceedings of 19th
ITS World Congress, Vienna, Austria, 22-26
October 2012.
[2] Kulmala, R. Ex-ante assessment of the safety
effects of intelligent transport systems. Accid.
Anal. Prev., 42, 2010, pp. 1359-1369.
Figure 2. An overall schematic
picture of the safety impact
assessment tool ERiC
Acknowledgements
The research leading to these results
has received funding from the European
Union’s Seventh Framework Programme
(FP7/2007-2013) under grant agreement
n° 270410, DRIVE C2X.](https://image.slidesharecdn.com/r12-150323055322-conversion-gate01/85/Smart-City-Research-Highlights-89-320.jpg)
![90
Introduction
Road transport carbon dioxide (CO2) emissions
form an important part of the greenhouse gas
generated in most of the developed countries.
Among the policy options to reduce these emis-
sions is green driving or eco-driving. Reducing
fuel consumption significantly by teaching drivers
to change their driving behaviour is potentially a
cost-efficient way to cut energy use and emis-
sions [1]. The fuel consumption and mileage of a
bus are typically higher than for a passenger car.
Consequently, the potential of green driving or
eco-driving applications on buses is of interest.
The purpose of this study was to assess the
impacts of a real-time green driving application
in city buses on fuel consumption, speeding and
passenger comfort.
Method
The equipment chosen for the field operational
test was an active real-time operating green
driving application, RASTU, developed at VTT
Technical Research Centre of Finland starting in
2004. Specifically, it provides recommendations
on the intensity of acceleration and feedback on
the current speed and its relation to the target
speed. The test subjects of the study were pro-
fessional city bus drivers working for the Nobina
transport operator on a frequently operated
bus line (550) in the Helsinki metropolitan area.
A total of 143 drivers contributed to the data,
including long-term users of the system, novel
users and non-users used as reference. The
subjects engaged in naturalistic bus driving as
part of their daily work.
Satu Innamaa,
Senior Scientist,
satu.innamaa@vtt.fi
Other contributing authors:
Merja Penttinen
Impacts of nomadic
device-based services
on safety and mobility
Results
The main results showed that the use of a green
driving application reduces fuel consumption
and speeding and increases passenger comfort.
Specifically, novel users of the application drove
more fuel efficiently in 30-50 km/h speed limit
areas with up to 30.0% less fuel. For higher
speed limits, the result varied depending on a
combination of traffic conditions and speed limits.
The average impact over all traffic conditions
and speed limits was an 8.9% reduction in fuel
consumption due to the green driving application
in use for novel users.
For long-term users, there was also a
decrease in fuel consumption for almost all traffic
conditions and speed limits in summertime.
Specifically, the impact was found to occur at
night in higher speed limit areas, but at peak
times in lower speed limit areas. In daytime
traffic, the impact was observed in all speed
limit areas except at 60 km/h. However, the
reduction in fuel consumption was smaller than
that of novel users (3.8% in summertime). It
seems that novel users followed the guidance
given by the device better than long-term users
(typical novelty effect). The motivation for better
compliance with the guidance may be more
recent training, which in itself may also have
improved over time. It may also be that long-
term users trust their own skills in this respect
and feel that they do not need the guidance in
all situations. This was supported in discussions
with long-term users.
In wintertime, the impact on fuel con-
sumption for long-term drivers was also mostly](https://image.slidesharecdn.com/r12-150323055322-conversion-gate01/85/Smart-City-Research-Highlights-92-320.jpg)
![Smart City Transport
91
Recommendation on intensity of acceleration (KAASU = throttle):
Green (throttle ok), yellow (throttle more), red (throttle back)
Current speed
and its
relation to the
target speed:
Green (speed
ok), red
(speeding)
Target speed
(related to the
speed limit and
timetable)
Next bus stop
positive but smaller than in summertime. The
strongest impacts on fuel consumption were
found in areas with lower speed limits (30-40
km/h) during the daytime and in peak traffic in
winter. Slippery and snowy winter conditions
such as those in Finland affect both the driving
dynamics of a single vehicle and the dynamics
of the whole traffic flow. A smoother driving
style needs to be adopted naturally in order to
be able to control the vehicle and drive safely. In
addition, driving in slippery conditions requires
more attention than driving in non-slippery
conditions, leaving less opportunity to follow
the in-vehicle device.
Conclusions
In conclusion, the use of a green driving support
system is beneficial for safety, cost-effectiveness
and passenger comfort even after years of use.
Novel users reap greater benefits from using
the system than long-term users do. Thus,
there is a novelty effect that decreases with
time. However, long-term users show a transfer
effect when not using the system. Novel users
do not show this trend, thus the transfer effect
(though smaller than that from actual use of the
system) takes more time to develop than the
four-month treatment period included in this
data set. Continuous encouragement to use the
system is therefore recommended, in addition
to green driving being included in driver training.
Finally, we conclude that it would be beneficial
to install a green driving application in the whole
bus fleet and to instruct all drivers to follow the
recommendations given by the system, which
would help maximize its benefits.
References
[1] International Energy Agency (2005). Mak-
ing Cars More Fuel Efficient: Technology and
Policies for Real Improvements on the Road.
European Conference of Ministers of Trans-
port, OECD/ECMT and IEA, Paris.
Figure 1: User interface of the green driving application
Acknowledgements
The authors would like to thank the
TeleFOT project for funding the impact
assessment and the HDENIQ project for
allowing them to use the green driving
application. We would also like to thank
Nobina Finland Ltd. for its support and
cooperation during the study.](https://image.slidesharecdn.com/r12-150323055322-conversion-gate01/85/Smart-City-Research-Highlights-93-320.jpg)
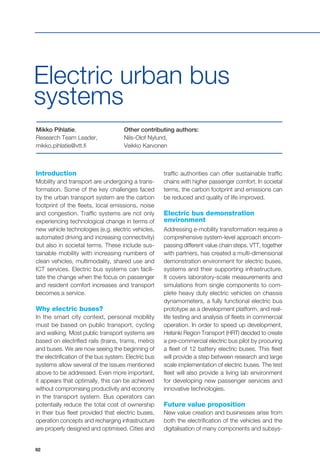
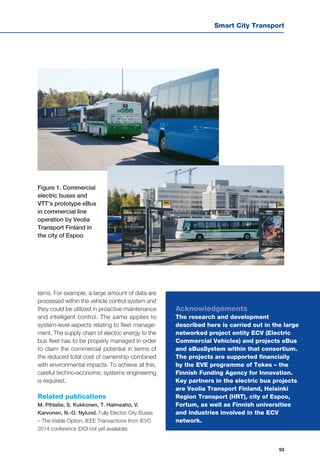
![94
Introduction
Finding the synergetic balance between societal,
economic and environmental aspects of sustain-
ability is vital when addressing the mobility of
people and goods in cities where ICTs and smart
mobile applications currently form the core of many
development projects. Furthermore, a broad time
horizon is required to ensure alignment between
actions in the near term and profound long-term
interventions in the transport system. Foresight can
facilitate such strategy work where the fundamental
need for mobility, and how it may change over
time in urban, suburban and interurban contexts,
is at the centre. This knowledge is combined
with research technologies, innovations and user
preferences and further applied to serve product
and service development or decision-making and
policy planning. In short, the goal is to smarten
up transport vehicles, powertrains, infrastructure,
user contexts and governance systems in liaison
with domains beyond mobility.
Foresight as an approach
Foresight provides a range of methodologies
and tools to address future-oriented challenges
of urban transport, such as climate change, air
pollution, safety and congestion. The aim is to
understand what political and behavioural changes
are required and which enabling technology solu-
tions could best suit the case. Foresight can be
applied to facilitate innovation processes, assess
new emerging business ecosystems and value
chains, support public authorities to outline and
prioritize action points, etc. The participatory
aspects of foresight are essential in identify-
ing and involving citizen views, ensuring user
acceptance, creating mutual agreement among
stakeholder networks and motivating involved
Heidi Auvinen,
Research Scientist,
heidi.auvinen@vtt.fi
Other contributing authors:
Anu Tuominen,
Nina Wessberg
Foresight to smarten up
urban transport systems
parties in joint efforts even in complex transition
processes requiring long-term future orientation.
Consequently, foresight provides a platform for
various urban actors to build the future together.
Urban mobility solutions
of the future
The research portfolio for applying foresight to
promote smart sustainable mobility includes
various projects to envision, structure and
pave the way for future transport and logistics
systems. For example, the study on safe and
secure transport until 2100 [1, 2] presented a
method for long-term visioning and, as a result,
a view of intelligent automated transport as a
solution to several societal challenges. Potential
drawbacks related to robot cars, privacy, social
inclusion, etc. were also identified and evalu-
ated. Concerns over the currently fossil-fuelled
transport on the other hand have been a driver
for a project studying electromobility, biofuels
and innovative public transport as a combined
effort to reduce greenhouse gas emissions in
urban transport [3].
National research is strongly complemented
by European collaboration, and an example of
successful Nordic networking is the project in
which prospective value chains for renewable
road transport energy sources in the 2050 were
identified to give advice to policymakers [4].
Foresight has also supported priority-setting
and networking within an on-going research
programme [5]. In addition, methodological devel-
opment to aid foresight-driven decision-making
and policy planning has been fruitful (see the
example of a visualization tool in Figure 1), and
multi-discipline approaches to serve public and
private organizations struggling with issues](https://image.slidesharecdn.com/r12-150323055322-conversion-gate01/85/Smart-City-Research-Highlights-96-320.jpg)
![Smart City Transport
95
related to urban transport in transition have
been further elaborated into a customisable
toolbox for different stakeholders.
References
[1] Auvinen, H., Tuominen, A., Ahlqvist, T.
Towards long-term foresight for transport: Envi-
sioning the Finnish transport system in 2100.
Foresight 14(3), 2012, pp. 191-206.
[2] Auvinen, H., Tuominen, A. Turvallinen liiken-
nejärjestelmä 2100. Visio. [Safe and secure
transport system 2100. Vision.] VTT Technology
5. VTT, Espoo, Finland, 2012. 43 p. + app. 18 p.
[3] Auvinen, H., Ruutu, S., Tuominen, A., Ahl-
qvist, T., Oksanen, J. Process supporting
strategic decision-making in systemic transi-
tions: A case study of emission-free transport in
cities by 2050. Technological Forecasting and
Social Change, Available online 22 August 2014.
[4] Wessberg, N., Leinonen, A., Tuominen, A.
Creating prospective value chains for renewable
road transport energy sources. EFP Brief No.
257. European Foresight Platform, 2014.
[5] Tuominen, A., Auvinen, H. TransSmart-kärki-
ohjelman visio ja tiekartta. Älykäs, vähähiilinen
liikennejärjestelmä 2030. [Vision and roadmap
for the TransSmart spearhead programme.
Smart, low-carbon transport system 2030.] VTT
Technology 146.VTT, Espoo, Finland, 2013. 48
p. + app. 12 p.
Figure 1. An example of a foresight visualization tool: system transition roadmap (a tem-
plate). Drivers and changes are structured on three levels and along three temporal
phases: trends contribute to a favourable environment for change, technological innova-
tions evolve and policy measures support a desired development path towards the envi-
sioned future. [3]
Acknowledgements
Examples of recent research presented
under this topic cover several projects,
in which researchers from different
disciplines have given their contributions.
In addition, experts and authorities
from private and public organizations
have been involved through interviews
and workshops. Research funding has
been obtained from several sources,
and a special acknowledgment is given
to the support from the Traffic Safety
2025 research programme (http://
www.vtt.fi/proj/tl2025/index.jsp), the
TransSmart research programme (http://
www.transsmart.fi/) and Nordic Energy
Research (http://www.nordicenergy.org/).](https://image.slidesharecdn.com/r12-150323055322-conversion-gate01/85/Smart-City-Research-Highlights-97-320.jpg)
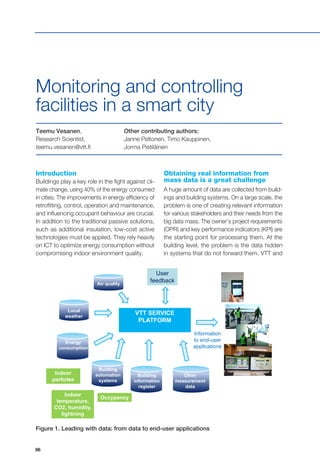
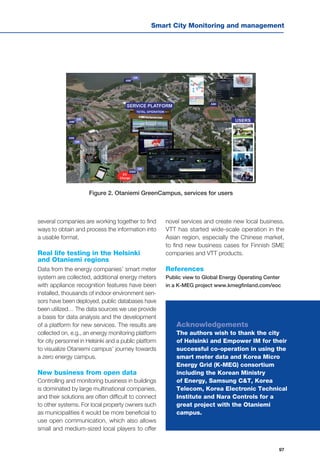
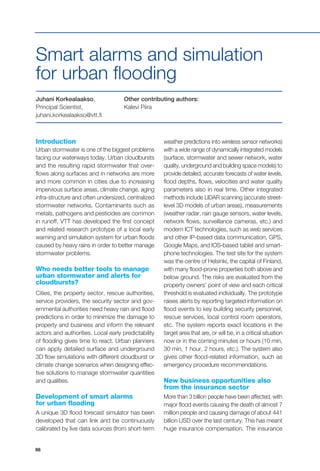
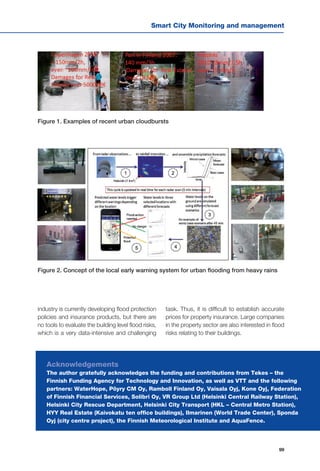
![Smart City Monitoring and management
101
designs have been modified based on inter-
national experience but adapted to Finnish
demands. This has also included information
on how the pervious pavements are linked to
other material parameters, such as drainage
layers, geotextiles and stormwater collection
systems. Stormwater modelling tools have been
developed to incorporate the new materials
and their respective designs and functionality.
Climate change forecasts have been taken
into account when evaluating filtration poten-
tial and stormwater model case studies with
the new pervious pavements. Parallel work
has been done in Sweden on the benefits of
pervious pavements to water quality and urban
horticulture for green environments. With all of
these aspects, it has been important to plan
the future demonstration and implementation
work, including how the performance will be
monitored through the use of ICT to ensure
filtration functionality, water quality and winter
durability.
Urban impacts and implementation
Finnish guidelines have been published detailing
how pervious materials can be implemented
in urban environments. The guidelines include
aspects of material and component produc-
tion that create new business opportunities.
Geotechnical dimensioning, construction and
maintenance are detailed, which ensures lifetime
performance of the new structures. Cities and
municipalities are moving forward with plans to
implement the pervious solutions, including the
use of ICT to assess performance and optimize
urban stormwater management. The pavement
functionality improves networking of the city for
an enhanced environment, sustainability and
better quality of life.
References
[1] CLASS – Climate Adaptive Surfaces web
page and public reports: http://www.vtt.fi/
sites/class/index.jsp?lang=en
[2] Kuosa, H., Holt, E. Development of Durable
Pervious Concrete for Finland’s Stormwater
Management Needs. Concrete Innovation
Conference 2014. Oslo, Norway. 11-13 June
2014, 11 p.
Figure 2. Hydrological simulation of
water pervious structures and pave-
ments. Water infiltration capacity, reten-
tion capacity, and if needed also water
purification capacity, is simulated in a full-
scale (adjustable: 330 - 1000 mm) rig, with
continuous measurement of the amounts
of water: sprinkler irrigation and water
passed through the structure.
Acknowledgements
The authors gratefully acknowledge the funding and contributions from Tekes – the
Finnish Funding Agency for Technology and Innovation, as well as VTT and 15 industrial
partners: the cities of Espoo, Helsinki, Oulu and Vantaa; HSY Vesihuolto, Rudus Oy,
Lemminkäinen Infra Oy, Saint Gobain Weber Oy, Kaitos Oy, Pipelife Finland Oy, Puutarha
Tahvoset Oy, Betonia Oy, Finnish Natural Stone Association, FCG and Ramboll.](https://image.slidesharecdn.com/r12-150323055322-conversion-gate01/85/Smart-City-Research-Highlights-103-320.jpg)
![102
Introduction
With the rapid population growth, water with-
drawals have tripled over the last 50 years,
and they are predicted to increase by 50% by
2025 in developing countries [1, 2]. Competing
demands for scarce water resources may lead
to an estimated 40% supply shortage by 2030
[3]. The World Economic Forum [4] recently
identified the water supply crisis as one of the
top three global threats.
More transparent governance and communi-
cation on urban water management options and
technologies will enable a more rapid introduc-
tion of state-of-the-art technologies and further
improve the involvement of civil society and the
private sector in cities, and it would strengthen
collaboration between cities.
One of VTT’s active involvements in the
water sector relates to the European Innovation
Partnership (EIP) on Water and one of its action
groups City BluePrints. The group organizes
interventions at local level to overcome barriers
in the water-related governance systems that
hinder the development and uptake of innovations
in municipal water management.
The BluSCities project
In 2014, the group actions turned into a new
European-funded project called BlueSCities
Mona Arnold,
Principal Investigator,
mona.arnold@vtt.fi
Other contributing authors:
Richard Elelman, CTM/ Netwerc H20,
EIP Water Action Group City BluePrints
Improving implementation
capacities of cities and
regions in water governance
(Blueprints for Smart Cities: Developing the
methodology for a coordinated approach to the
integration of the water and waste sectors within
the EIP Smart Cities and Communities). The pro-
ject aims to answer the European Commission’s
objective to develop a coordinated approach to
the integration of the water and waste sectors in
the ‘Smart Cities and Communities’ European
Innovation Partnership [http://ec.europa.eu/eip/
smartcities], identifying research and innovation
needs for future actions and promoting the
exchange of best practice between the public
authorities and stakeholders involved.
The BlueScities project will deal with the
integration of challenges in the management
of water and waste in urban settings within
smart city logic, therefore linking to the current
approaches in transport, logistics, energy and
the provision of social services. Cities are key to
the sustainable development of the European
Union, and good governance is the challenge.
Focus and involvement
Water, waste and the ICT sector have not pre-
viously been working together effectively in a
synergistic way towards a carbon-free city and
its functions. It is actually surprising that the role
of essential societal material flows – water and
waste – is not really covered in the current Smart](https://image.slidesharecdn.com/r12-150323055322-conversion-gate01/85/Smart-City-Research-Highlights-104-320.jpg)
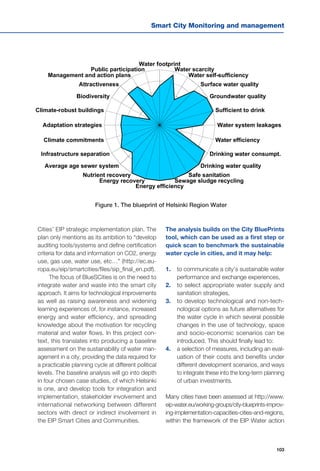
![104
group. VTT was involved in assessing Helsinki
together with the Helsinki Region Water Services.
The first benchmark for Helsinki (Figure 1), for
instance, shows that Helsinki scores highly on
energy efficiency, drinking water quality and water
abundance, whereas protecting biodiversity and
nutrient recycling aspects can still be developed.
From here, the BluScities project will continue
by sharing best practices across Europe and
facilitating direct contact between different cities
at different stages of advancement.
Discussion
Integrating Smart City and smart water can have
an impact at several levels and increases the
mass of knowledge around tangenting issues
such as energy efficiency. Water and wastewater
systems are significant energy consumers. As an
example, 3%-4% of U.S. electricity consump-
tion is estimated to be used for the movement
and treatment of water and wastewater. Given
that water and wastewater treatment plants are
not primarily designed and operated with energy
efficiency as a chief concern, these systems can
be overlooked when communities fund energy
improvement projects. However, substantial energy
and financial savings can be uncovered through
operational changes and capital improvements at
water and wastewater utilities [5].
Some estimates indicate that the application
of ICT in water management and monitoring
could produce growth of 30% per year. We see,
indirectly, open opportunities for SMEs and other
companies, especially in the ICT area for water
and waste. According to the EEA [6], floods and
droughts create significant damage at the level
of tens of billions per year in Europe. A long-term
European Urban Agenda can minimize this.
References
[1] Stockholm International Water Institute.
Statistics. http://www.siwi.org/sa/node.
asp?node=159 (2012).
[2] UNESCO. Managing water under uncertainty
and risk. Facts and figures from the UNworld
water development report 4. http://unesdoc.
unesco.org/images/0021/002154/215492e.pdf
(2012).
[3] 2030 Water Resources Group. Charting our
water future. Economic framework to inform
decisionmaking. West Perth, USA. http://www.
mckinsey.com/App_Media/Reports/Water/
Charting_Our_Water_Future_Full_Report_001.
pdf (2009).
[4] World Economic Forum 2014. Global Risks,
9th edn. Geneva, Switzerland. http://reports.
weforum.org/ global-risks-2013/ (2014).
[5] Daw, J., Hallett, K., DeWolfe, J., Venner,
I. Energy Efficiency Strategies for Municipal
Wastewater Treatment Facilities. National
Renewable Energy Laboratory, Technical Report
NREL/TP-7A30-53341, Colorado, USA. http://
www.nrel.gov/docs/fy12osti/53341.pdf (2012).
[6] EEA. European Environment Agency. Urban
adaptation to climate change in Europe. Chal-
lenges and opportunities for cities together with
supportive national and European policies. Syn-
thesis, Copenhagen, Denmark (2012).
Acknowledgements
The action group team is led by NetwercH2O and the KWR Watercycle Research Institute
and involves a wide range of knowledge providers, administrative bodies, networks and
regional authorities for the development of the project: Richard Elelman, NETWERC H2O/
CTM, project coordinator of BlueScities and Kees van Leeuwen KWR Water City blue
print developer. We also acknowledge the EU Horizon 2020 programme for funding of the
BlueSCities. The author also acknowledges HSY Helsinki Region Water Services for readily
providing data on their infrastructure and services.](https://image.slidesharecdn.com/r12-150323055322-conversion-gate01/85/Smart-City-Research-Highlights-106-320.jpg)
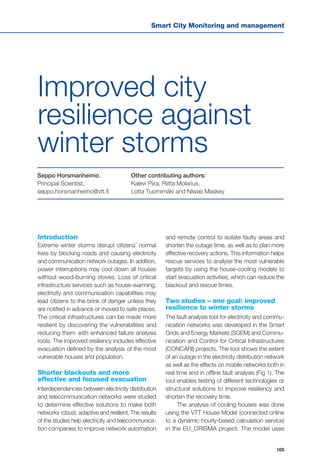
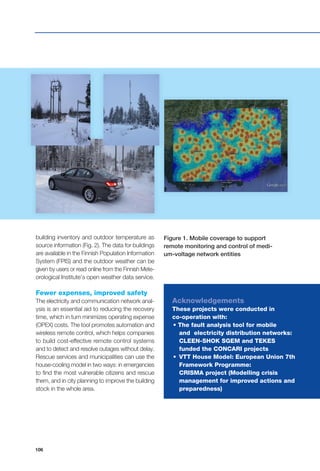
![Smart City Monitoring and management
107
-50
-40
-30
-20
-10
0
10
20
0 4 8 12 16 20 24 28 32 36 40 44 48 52 56 60 64 68 72
Tout = -25.0
Tout = -30.0
Tout = -35.0
Tout = -40.0
Tout = -45.0
Tout = -50.0
Figure 2. VTT House Model: Development of indoor air temperature levels in poorly insu-
lated lightweight (on the left) and massive well-insulated (on the right) residential buildings
after a power failure. ( T [˚C] = f(Time [h]). Tout = outdoor temperature [1].
References
[1] Molarius, Riitta; Tuomaala, Pekka; Piira,
Kalevi et al. 2014. Systemic Vulnerability and
Resilience Analysis of Electric and Transport
Network Failure in Cases of Extreme Winter
Storms. Paper in Second International Con-
ference on Vulnerability and Risk Analysis and
Management (ICVRAM2014) 13-16 July 2014,
University of Liverpool, UK. Michael Beer, Ivan
S.K. Au & Jim W. Hall (editors).
[2] Horsmanheimo, S., Maskey, N., Tuomimäki,
L. “Interdependency between Mobile and
Electricity Distribution Networks: Outlook and
Prospects” in “Smart Device to Smart Device
Communication”, S. Mumtaz & J. Rodriguez
(editors), Springer International Publishing 2014,
pp. 281-308.
[3] Horsmanheimo, S., Maskey, N., Tuomimäki,
L., Kokkoniemi-Tarkkanen, H., Savolainen,
P., “Evaluation of interdependencies between
mobile communication and electricity distri-
bution networks in fault scenarios” Innovative
Smart Grid Technologies – Asia (ISGT Asia),
2013 IEEE, pp. 1-6, 10-13 Nov. 2013.
[4] Horsmanheimo, S., Maskey, N., Kok-
koniemi-Tarkkanen, H., Savolainen, P.,
Tuomimäki, L., “A tool for assessing inter-
dependency of mobile communication and
electricity distribution networks”, Smart Grid
Communications (SmartGridComm), 2013
IEEE International Conference, pp. 582-587,
21-24 Oct. 2013. Doi link: 10.1109/SmartGrid-
Comm.2013.6688021
-50
-40
-30
-20
-10
0
10
20
0 4 8 12 16 20 24 28 32 36 40 44 48 52 56 60 64 68 72
Tout = -25.0
Tout = -30.0
Tout = -35.0
Tout = -40.0
Tout = -45.0
Tout = -50.0](https://image.slidesharecdn.com/r12-150323055322-conversion-gate01/85/Smart-City-Research-Highlights-109-320.jpg)
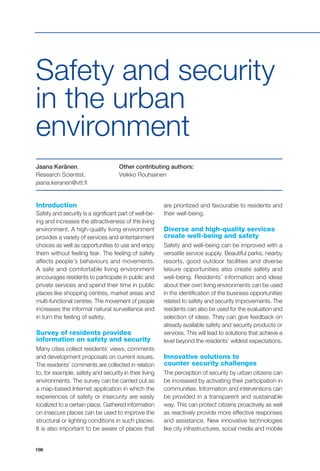
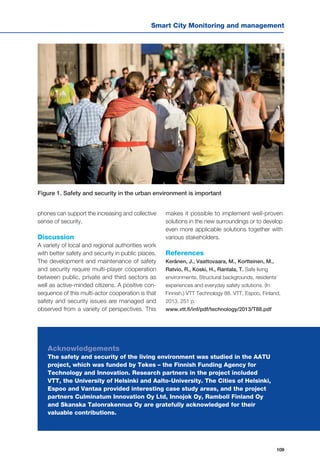
![110
Mobile city guide
Anu Seisto,
Research Team Leader,
anu.seisto@vtt.fi
Other contributing authors:
Maiju Aikala (VTT)
Introduction
The goal of this work was to create and test new
ways for presenting news and event information for
people/citizens on the go. Location based Mixed
Reality (MR) technology was utilized for application
development. The service concept of “mobile city
guide” was developed in close collaboration with
potential users in several phases. User involve-
ment included 1) discussion and commenting in
Owela Open Web Lab in concept development
phase, 2) usability tests in city environment with
the first prototype and 3) long-term field test dur-
ing which user experiences were shared in Owela
Open Web Lab. This article presents the results
from user involvement in the development pro-
cess of a novel digital service.
Mobile city guide application
The service concept prototype of Mobile Aug-
mented Reality City Guide was designed and
implemented. Augmented Reality (AR) is a tech-
nique of superimposing virtual information on top
of a camera view of the real world. It can be used
to deliver digital content embedded to the user’s
surroundings. [1, 2] In Mobile AR City Guide users
can view and create messages and photos which
are connected to physical geolocations, such as
location-based news articles, events and pub-
lic messages from other users. The content can
be looked both in camera view and in map view.
Service development with users
The development of Mobile Augmented Reality
City Guide was carried out utilizing the user cen-
tric approach, as described in Figure 1. Potential
users of the City Guide participated the applica-
tion development process already from the ide-
ation stage. During the development process a
prototype service was created and two iteration
rounds of user testing were carried out. In the
first user test the usability and the user experi-
ence targets of this novel media production and
consumption model were studied (Figure 2).
Based on the results from the first user test some
modifications to the application were made. The
second user test focused on the development of
user experience during a six-week usage period.
Discussion
The users gave valuable input for the develop-
ment of Mobile Augmented Reality City Guide.
The prototype was continuously developed based
on users’ comments even in the course of the
user tests. It was possible to react on the user
feedback from the problems and challenges they
had faced. Also development ideas and informa-
tion about use context were fruitful information for
further development of the application.
The participants were enthusiastic about
Augmented Reality technology and many of them
found it playful. However, the benefit from the
use of augmented reality technology remained
somewhat unclear. Also walking around in the city
with a smart phone was considered natural and
more discrete than doing the same with a paper
map and giving and impression of being lost.](https://image.slidesharecdn.com/r12-150323055322-conversion-gate01/85/Smart-City-Research-Highlights-112-320.jpg)
![Smart City Services
111
Usability
tests
Long-term
field tests
Concept
development
with potential
users
Application
idea
Prototype with
functionality
Fully functional
prototype
Figure 1. User centric development
process of Mobile Augmented Reality
City Guide.
Figure 2. Usability testing in Helsinki
city centre.
In the adoption of a new technology product
the experience develops from anticipation through
orientation and incorporation to identification
simultaneously as familiarity, functional dependency
and emotional attachment increase. [3]. During the
development of the Mobile Augmented Reality City
Guide the experiences vary from the opportunities
for positive experiences in anticipation phase,
through the feeling of excitement of novel features
as well as frustration from usability challenges
and lack of content, to still increasing interest.
In the concept development phase, the results
were very promising especially in the technol-
ogy acceptance point of view. The participants
evaluated the services in the use situations often
more interesting than useful. In addition, in most
of the cases they thought that they could use
the described service. This indicates that inter-
esting, and probably entertaining, service would
encourage using it, although the usefulness was
anyway important for the participants. The user
comments focused mainly on the content and
the sources of information; that is there were only
a few new ideas concerning the user interface
and functionality. In usability tests the comments
and new ideas focused naturally on usability
and issues related to user interface. In the last
phase, the long-term field test, the development
ideas concerned different types of content, but
also ideas for content providers and about the
appearance were presented. For example, more
surprising and playful features were suggested
especially in AR view.
An example of participants’ ideas concerning
the content was information service for tourists,
in which more specified data could be delivered
than in a basic tourist guide, such as this cafeteria
is famous from its delicious cakes. Also more
background information, such as historical details
could be given. The ideas for different sources of
content included time tables for public transpor-
tation, opening hours of museums, art galleries
etc., and information from the city, such as road
works, and current and future building projects.
References
[1] Wagner, D., Schmalstieg, D. First Steps
towards Handheld Augmented Reality. Proc. of
the 7th International Conference on Wearable
Computer 2003, USA, pp. 127–135.
[2] Höllerer, T., Feiner, S. Mobile Augmented
Reality. In: Telegeoinformatics: Location-Based
Computing and Services, H. Karimi & A. Ham-
mad, Eds. Taylor & Francis Books Ltd, 2004.
[3] Karapanos, E., Zimmerman, J., Forlizzi, J.,
Martens, B.-J. User Experience over Time:
An Initial Framework. Proc. of CHI 2009, ACM
Press, pp. 731–738.
Acknowledgements
This work was part of the Digile Next Media
research programme. Cooperation with the
companies Sanoma and Forum Virium, and
researchers Tatu Harviainen (VTT) and Pekka
Siltanen (VTT) in the Next Media research
programme are gratefully acknowledged.](https://image.slidesharecdn.com/r12-150323055322-conversion-gate01/85/Smart-City-Research-Highlights-113-320.jpg)
![112
Service robots in public
places: customer
expectations
Marketta Niemelä,
Senior Scientist,
marketta.niemela@vtt.fi
Other contributing authors:
Ali Muhammad,
Iina Aaltonen
Introduction
In the near future, robotics will provide new
opportunities for customer service development in
terms of efficiency, user experience and new types
of service tasks. Eco-
nomically feasible, quite
sophisticated, humanoid
robots with a reasonable
degree of autonomy in
everyday environments
are available now. A new
bottleneck for the applica-
tion of these robots is the
interaction with humans
and user acceptance
of services provided by
robots. Understanding
user expectations is the
first step towards design-
ing successful services
based on advances in
robotics.
Robots are able
to elicit positive
experience in
service tasks
A service robot is “a robot
that performs useful tasks
for humans or equipment
Figure 1. Nao the humanoid robot
carrying out reception service
tasks. Nao is 57 cm tall so it was
put on a table for the comfort of the
service users.
excluding industrial automation application” [1].
Service robots will assist and also add value to
customer services such as reception, instruction
and delivery in hotels, hospitals and care homes for
the elderly. In service tasks,
the robot does not have
to look human, however,
research has shown that
people tend to perceive
human-like robots more
positively than machine-like
ones [2].
Interaction and
acceptance of robots in
public places have been
studied, especially with
regard to the effect of robot
appearance and behaviour.
Summarizing some results,
it seems that humans tend
to treat humanoid robots
as social actors. Humans
prefer talkative robots to
quiet ones [2], perceive
robots to have personal-
ity traits [3] and can feel
empathy for robots [4].
Although humans seem
to prefer human-looking
robots [2], people may feel](https://image.slidesharecdn.com/r12-150323055322-conversion-gate01/85/Smart-City-Research-Highlights-114-320.jpg)
![Smart City Services
113
uncomfortable when a robot is too human-like
(the uncanny valley [5]). Based on this research,
humanoid robots performing similar (simple)
service tasks to humans can be expected to
evoke positive responses in users.
Empirical study of user
expectations of robot reception
We studied the impact of a humanoid robot [6]
on customer expectations and experience of a
reception desk service (Figure 1). The participants
(visitors at the reception) mostly expected the robot
service to be “available”, “reliable and honest”,
“systematic” and “efficient”, but less “pleasant”
and “polite”. Such human behaviour attributes
as “warm”, “intimate” and “personal” were not
expected much from the robot. After trying the
robot service, the participants found it to be more
“helpful” than expected. Overall, the participants
expected more from the human service than the
robot service.
Discussion
At present, people may not expect much from
robots carrying out customer service tasks.
However, robots offer huge opportunities for
service development, not only because no other
technology is more interactive and connecting
at an emotional level to people than robots. The
emotional and social aspects perceived in robots
afford even new kinds of services, for instance,
the Paro robot seal therapy. In addition to good
service design, other important factors in user
acceptance and market success of robot services
References
[1] I SO 8373:2012 Robots and robotic devices
– Vocabulary. International Organization for
Standardization, 2012. 38 p.
[2] Iwamura, Y., Shiomi, M., Kanda, T., Ishig-
uro, H., Hagita, N. Do elderly people prefer
a conversational humanoid as a shopping
assistant partner in supermarkets? Proceed-
ings of HRI’11 International Conference on
Human-Robot Interaction. Lausanne, Swit-
zerland, 06–09 March 2011. ACM New York,
NY, USA, 2011. Pp. 449–456.
[3] Joosse, M., Lohse, M., Perez, J.G., Evers,
V. What you do is who you are: The role of
task context in perceived social robot person-
ality. Proceedings of 2013 IEEE International
Conference on Robotics and Automation,
2013, 2134–2139.
[4] Rosenthal-von der Pütten, A.M., Krämer,
N.C., Hoffman, L., Sobieraj, S., Eimler, S.C.
An experimental study on emotional reactions
towards a robot. Int. Journal of Social Robot-
ics, Vol. 5, 2013, pp. 17–34.
[5] Mori, M. The uncanny valley (translated
by MacDorman, K.F. and Kageki, N.). IEEE
Robotics & Automation Magazine, June 2012,
(2012), pp. 98–100.
[6] Aldebaran. Nao robot website. http://www.
aldebaran.com/en/humanoid-robot/nao-ro-
bot, 2014.
Acknowledgements
We thank the VTT Design for Life
innovation programme for funding this
research work.
are the usefulness of the services and integration
of them into the whole service system.
The success of Smart Cities depends on
seamless interaction between their citizens and
technology. VTT has taken the initiative to under-
stand the interaction between service robots and
humans to improve the chances of success for
companies willing to take advantage of robotics
in their service development.](https://image.slidesharecdn.com/r12-150323055322-conversion-gate01/85/Smart-City-Research-Highlights-115-320.jpg)
![114
Many faces of mobile
contactless ticketing
Jonathan Ouoba,
Research Scientist,
ext-jonathan.ouoba@vtt.fi
Other contributing authors:
Erkki Siira
Introduction
The real emergence of NFC technology, which is
now available on various mobile devices, offers
opportunities in terms of deployment of mobile
services for end-users in urban areas. In this
context, the technological developments have led
to the deployment of mobile contactless solutions
in the domains of transport and culture. The
goal has then been to identify the main models
that can be used in the management of mobile
contactless ticketing systems. This allows for
a clearer view of the ecosystem dedicated to
NFC-based mobile ticketing.
Seven models for the
management of mobile
contactless ticketing systems
The conducted research allowed seven main
models to be identified and compared regard-
ing the management of mobile contactless
ticketing systems within urban areas [1]. These
were operator-centric, manufacturer-centric,
identification-based, P2P-based, smart card-
based, leeched smart card-based and inverse
reader models. The comparison of the models
provides a realistic picture of the various faces
of such systems and their likely evolution in the
urban environment. In this respect, the results
are relevant to public authorities (at city level)
that want to promote the ecosystem dedicated
to NFC-based mobile ticketing.
Objectives of the smart
urban spaces (SUS) project
The work was part of the SUS European project.
The project explored the possibilities offered by
the NFC technology in the field of mobile ticketing
for city services. A study was performed to gain
a more comprehensive view of the NFC-based
ticketing systems. This study was based on
the analysis of the existing ecosystem (best
practices, strategy of the big players, etc.) and
on the return, on the experience of the solutions
deployed by the partners of the SUS project.
The comparison between the identified models
was performed with criteria considered relevant
in the field of NFC-enabled services.
Possible evolution of the
ecosystem dedicated to NFC-based
mobile ticketing
Considering the diversity of situations an end-user
may encounter, the identified models will certainly
coexist in the urban environment. It should be
noted that MNOs and manufacturers of mobile
phones can put forward (what they already do)
the operator-based and manufacturer-based
models so that they become more prominent.](https://image.slidesharecdn.com/r12-150323055322-conversion-gate01/85/Smart-City-Research-Highlights-116-320.jpg)
![Smart City Services
115
The challenge lies in being able to present a
coherent picture of the environment so that the
end-user can easily choose the most suitable
model (system) in each possible situation. The
development of a service aggregator (probably
at city level) that provides such a possibility will
offer new business opportunities.
References
[1] Ouoba, J., Siira, E. Many Faces of Mobile Contactless Ticketing. Proceedings of the Second Interna-
tional Conference on Smart Systems, Devices and Technologies. Rome, Italy, 23–28 June 2013. Pp.
93–98. http://www.thinkmind.org/index.php?view=instance&instance=SMART+2013
Acknowledgements
This work was carried out within the framework of Smart Urban Spaces, an
Information Technology for the European Advancement (ITEA) project, the
goal of which was to define new mobile e-services for cities. The proposed
services mainly take advantage of specific technologies, in particular NFC,
in order to ease the everyday life of European citizens. We would like to
thank the partners of the Smart Urban Spaces project with whom we have
been working for three years and whose valuable contributions have made
this work possible.](https://image.slidesharecdn.com/r12-150323055322-conversion-gate01/85/Smart-City-Research-Highlights-117-320.jpg)
![116
Interoperability of
mobile contactless
city service
Jonathan Ouoba,
Research Scientist,
ext-jonathan.ouoba@vtt.fi
Other contributing authors:
Serge Chaumette1
, Damien Dubernet1
, Erkki Siira2
,
Tuomo Tuikka2
, 1
University of Bordeaux,
2
VTT Technical Research Centre of Finland
Introduction
Interoperability of contactless city services has
been emerging as a topic of discussion at many
recent events and projects. Looking simply at
technological interoperability does not help
sufficiently when mapping service opportunities
or analysing city services. There was therefore a
need, in the context of the Smart Urban Spaces
(SUS) European project, to define a framework
(expanding the focus to other aspects of city
services) to help understand the environment
of contactless city services to analyse the rela-
tions between the different stakeholders and to
provide relevant information concerning the level
of interoperability that can be reached.
Interoperability framework for
mobile contactless city service
The conducted research allowed for the proposal
of a framework dedicated to the definition of
interoperability and its evaluation in the context of
mobile contactless city service [1]. The proposed
system consists of an interoperability matrix
(identifying the key entities as presented in Table
1) and a set of forms highlighting the require-
ments regarding the possible relation for each
cell of the matrix. In this respect, the framework
is relevant to companies and representatives of
public authorities as it provides a practical tool
for analysing the possible interactions of mobile
services to be deployed (or already deployed)
in a given urban area.
Interoperability in the context
of the Smart Urban Spaces
(SUS) project
The work was part of the SUS European project.
During the project, more than ten workshops
on how to delineate the contactless services in
European cities (partners of the project) were
organized. This effort allowed the main entities
of the considered ecosystem to be identified,
namely the Mobile, the User, the Service, the
Infrastructure, the City and the Country. Each
of these high-level entities can be mapped with
another and an analysis can be made in the
crossroads of this mapping. A set of dimen-
sions have been chosen to give a structure to
the analysis. These dimensions are Business,
Legal, Usability, Social and Technical aspects.](https://image.slidesharecdn.com/r12-150323055322-conversion-gate01/85/Smart-City-Research-Highlights-118-320.jpg)
![Smart City Services
117
User Mobile Infrastructure Service City Country
User
Mobile
Infrastructure
Service
City
Country
Table 1: Interoperability matrix
Possible evolution of the
ecosystem dedicated to
NFC-based mobile ticketing
Some partners of the SUS project started to use
the first available forms, thus demonstrating that
it is a practical tool because it allows, among
others things, potential problems to be identi-
fied or similar services compared. The forms of
the framework include quite simple questions
(with yes/no/maybe answers), and the process
that leads to the evaluation results is easy to
achieve (with a clear view of the results through
a Kiviat diagram). This tool helps to improve the
business model related to the deployment of a
given contactless city service and, in this respect,
it could represent a competitive advantage for
companies.
Acknowledgements
This work was carried out within the
framework of Smart Urban Spaces, an
Information Technology for European
Advancement (ITEA) project, the goal of
which was to define new mobile e-services
for cities. The proposed services mainly
take advantage of specific technologies,
in particular NFC, in order to ease the
everyday life of European citizens. We
would like to thank the partners of the
Smart Urban Spaces project with whom
we have been working for three years and
whose valuable contributions have made
this work possible.
References
[1] Chaumette, S., Dubernet, D., Ouoba, J.,
Siira, E., Tuikka, T. Towards an Interoperability
Evaluation Process for Mobile Contactless City
Service. Proceedings of the Eighth International
Conference on Digital Society. Barcelona,
Spain, 23-27 March 2014. Pp. 65–70. http://
www.thinkmind.org/index.php?view=in-
stance&instance=ICDS+2014](https://image.slidesharecdn.com/r12-150323055322-conversion-gate01/85/Smart-City-Research-Highlights-119-320.jpg)
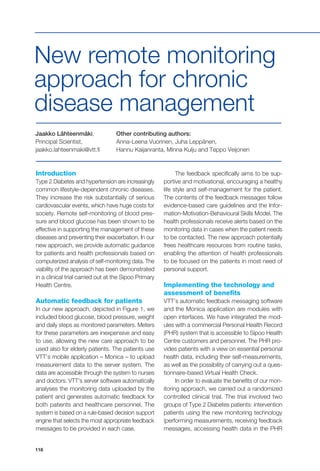
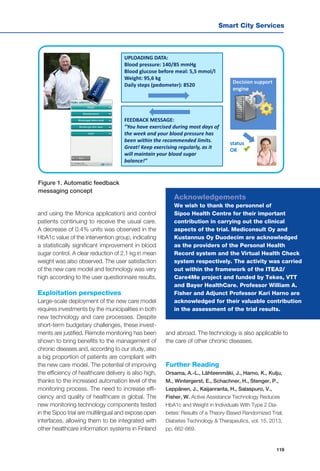
![120
Introduction
In today’s world we face a double-sided problem:
resource depletion and waste accumulation. The
direct consequence is an increase in the costs
of raw materials and waste disposal. The food
production chain generates waste and co-streams
at every step of the way from farm to fork to bin.
Dumping waste is no longer an option to be
reckoned with. Burning the waste to turn it into
energy and converting it into chemicals, mate-
rials and food ingredients are current and future
solutions to the mentioned double-sided problem.
Food waste and food-grade co-streams, which
often contain a lot of water, are better suited to
conversion processes. End products can be
new foods and ingredients, and feed material
as well as non-food and non-feed applications.
Valorisation of the food chain
waste can benefit many
industrial actors
The problem of resource depletion and waste
accumulation is best tackled by developing
technologies: i) to reduce the amount of waste
by exploiting it as raw material for energy, chem-
icals and materials, as well as in food and feed
production, and ii) to prevent waste generation
through efficient usage of raw materials, water
and energy in processing, and by preventing
microbiological and chemical spoilage. These
technology solutions can be applied at every
step of the food production chain and they aim
to benefit farmers, manufacturers of food and
food ingredients, food retailers and processors
of food waste generated in households and by
consumers. [1]
Technologies to convert
waste into food
The technologies developed to reduce food
processing waste by converting it back into food
are mechanical, physical, enzyme-aided, micro-
biological or combinations thereof. Vegetable
co-streams can be processed bio-mechanically
into edible films with good barrier properties.
With microbiological processing, vegetable peels
can also be introduced into the food chain as
vitamin- or natural preservative-rich ingredients or
E-codeless thickening agents. Further examples
include bio-mechanical processing of berry and
fruit press cakes (co-streams of juice production)
into bioactive food ingredients and microbiologi-
cal conversion of broiler chicken feathers into
feed. These are just a few examples to show
the potential of cross-technological processing
solutions to solve the problem of accumulating
food chain waste. [1, 2]
Discussion
As a result of the population growth, together
with rising economic wealth in certain areas,
the world will face an ever-growing problem of
resource shortage and waste overload. There
is an urgent need to find ways to convert waste
back into raw materials to establish bio waste
refineries. In Europe alone, over 100 million
tonnes of food is wasted annually – agri- and
aqua cultural waste is not even included. About a
Raija Lantto,
Head of Research Area,
raija.lantto@vtt.fi
Other contributing authors:
Maria Saarela
Value from the
food chain waste](https://image.slidesharecdn.com/r12-150323055322-conversion-gate01/85/Smart-City-Research-Highlights-122-320.jpg)
![Smart City Services
121
Films
Fertilizers
Polymers
Feed
Food
Energy
PlasticsChemicals
Farming and
primary
production
Processing
Distribution
Retail
Consumption
Waste
third of the food meant for human consumption
is wasted. The Roadmap to a resource-efficient
Europe [3] identified food as a key sector in which
resource efficiency should be improved. A major
challenge here is how to reduce food waste
without compromising food safety. In the EU,
food waste reduction has a high priority, and the
EC has therefore produced a waste prevention
guidance document [4] (and is targeting con-
siderable research funding in this area.
FIGURE: Sustainable food chain
Acknowledgements
Research and technology development
in the area are funded by the European
Commission, Tekes – the Finnish Funding
Agency for Innovation and the Norwegian
Research Council.
References
[1] Mirabella, N., Castellani, V., Sala, S. Current options for the valorization of food manufacturing waste:
a review. Journal of Cleaner Production. Vol. 65, 2014, pp. 28-41.
[2] Recovery of high added-value components from food wastes: Conventional, emerging technologies
and commercialized applications. Trends in Food Science & Technology. Vol. 26, 2012, pp. 68-87.
[3] http://ec.europa.eu/environment/resource_efficiency/pdf/com2011_571.pdf
[4] http://ec.europa.eu/environment/waste/prevention/pdf/Waste%20prevention%20guidelines.pdf)](https://image.slidesharecdn.com/r12-150323055322-conversion-gate01/85/Smart-City-Research-Highlights-123-320.jpg)
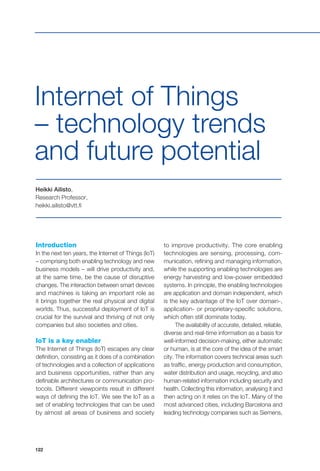
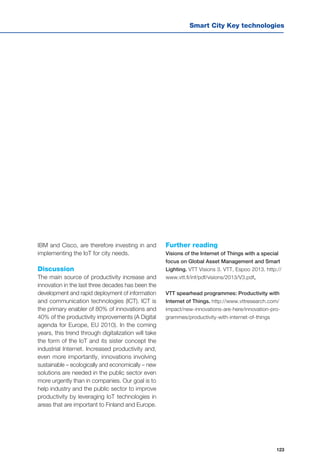
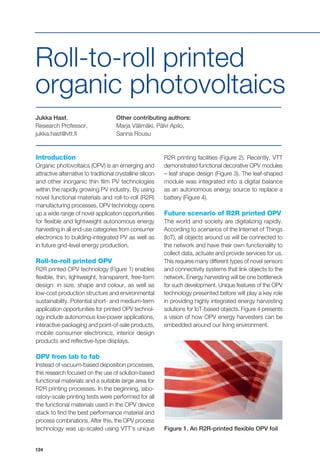
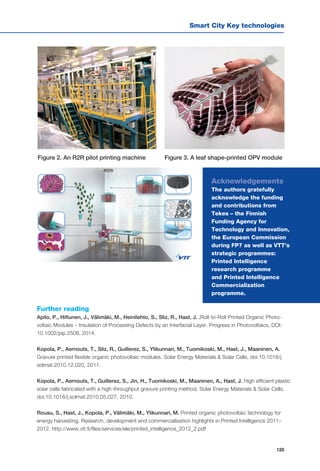
![126
Mikko Pihlatie,
Research Team Leader,
mikko.pihlatie@vtt.fi
Other contributing authors:
Markus Andersson,
Samu Kukkonen
New technologies
for electrochemical
energy storage
Introduction
One challenge of using renewable energy sources
(solar, wind, etc.) lies in the uneven geographic
and temporal supply of the energy they offer.
This calls for efficient and economical solutions
to store energy. Another important requirement
for energy storage arises from the need to level
out the peaks of demand and supply of energy
in the increasingly distributed generation and
consumption. For example, in terms of electric
vehicles, high-power charging stations need
a way to ensure electricity supply at all times
without exceeding the limits of the electric grid.
According to many surveys, stationary batteries
offer the most suitable solution for supporting
energy and power management in both urban
and rural use and business cases.
Areas of application
Electrochemical energy storage is an enabling
technology at the crossroads of several emerging
use cases and applications in modern society,
both in societal and industrial terms. The transport
system is undergoing a transformation towards
electrification of urban heavy-duty fleets in which
multimodality and shared use of stationary infra-
structure will be beneficial. Industrial production
such as mining and ports offer potential use cases
for both mobile and stationary energy storage;
these may actually have similarities with islanded
communities with their own energy production
and management. Power grids offer use cases
for grid-connected storage, and storage in vehi-
cles can offer ancillary services to the electricity
system when connected and not serving the
primary production purposes. All of the above
open up for a very versatile set of requirements
and technological solutions. Finding the added
value that different electrochemical storage tech-
nologies can offer requires careful systems and
techno-economic engineering. A pre-normative
approach will also be necessary on the way to
larger-scale adoption of the technologies.
Potential future
storage technologies
Conventional batteries such as lead-acid, Ni-MH
and Li ion batteries can be used, and in many
cases they are still the technology of choice, at
least in the short term. With regard to the near
future, the stationary battery systems with most
potential are redox flow batteries, metal-air batter-
ies, Na-Ni-Cl batteries and other sodium battery
systems. Table 1 presents the potential of the
energy densities and cycle lives (the number of
charge/discharge cycles the battery can endure
until its capacity drops below a critical limit) of
several potential battery technologies. [1, 2]](https://image.slidesharecdn.com/r12-150323055322-conversion-gate01/85/Smart-City-Research-Highlights-128-320.jpg)
![Smart City Key technologies
127
Redox flow batteries
Redox flow batteries have high potential as
an energy storage technology with respect to
stationary applications such as grid storage and
loading stations for EVs. This is primarily due to
their very long cycle life, low operational cost and
environmental friendliness. There are already sev-
eral redox flow systems in operation around the
world, most of them based on vanadium redox
batteries (VRB). [2] Flow batteries consist of two
(in some cases one) electrolyte components that
are stored in separated tanks and circulated in
parallel separated by an ion selective membrane.
The solid electrodes remain inert as the actual
anode and cathode are species dissolved in
the electrolytes.
Figure 1. Schematic image of a redox flow battery system [2].
Metal-air batteries
The metal-air technologies offer high energy
densities and advantages related to cost and
weight. Their cycle life, however, requires further
improvement. A metal-air battery consists of a
base metal negative electrode and an air positive
electrode. The positive electrode is the oxygen
contained in ambient air. Oxygen is an ideal
cathode with strong oxidizing power and it is
available in abundance. The negative electrode
is typically lithium, magnesium or zinc. [3]
Sodium-based batteries
The sodium-sulphur battery consists of a molten
sodium anode, a molten sulphur cathode and a
solid ceramic electrolyte. Due to its high energy
Technology Practical gravimetric
energy density
(Wh/kg)
Theoretical volumet-
ric energy density
(Wh/l)
Cycle life
(cycles)
Source
Li - air 3505 1520-1680 500 (9,10)
Zn - air 200 - 200 (11)
Na - S 110 360 5000 (9,10)
Na - Ni - Cl 90 160 3500 (9,10)
VRB 10-20 15-25 >10 000 (9,10)
Li - ion 95-200 250-329 >5000 (9,10)
Lead - acid 30-40 60-75 500-800 (9,10)
Ni - MH 60-120 140-300 500-1000 (9,10)
Table 1. Battery technologies with their respective gravimetric and volumetric energy
densities and cycle lives.](https://image.slidesharecdn.com/r12-150323055322-conversion-gate01/85/Smart-City-Research-Highlights-129-320.jpg)
![128
density, high efficiency of charge/discharge,
low-cost raw materials and long life (~15 years),
it has been applied in relatively large-scale
stationary grid support and space applications
[4]. [5] The Na-Ni-Cl battery (ZEBRA) is an
advanced high temperature battery that offers
several improvements over the sodium-sulphur
technology: high voltage, maintenance-free
operation, no gassing, no self-discharge [6] and
other safety-enhancing features.
Summary of the
technologies presented
In addition to those summarized in Table 1,
properties such as cost, safety, environmental
friendliness, storage life, etc. should be consid-
ered. Many properties are subject to change
as ongoing, extensive R&D constantly aims for
improvement. In the end, each use case and
application from pilots to commercial operation
will be driven, along with the technological devel-
opment, by careful techno-economic systems
engineering to facilitate the right choices.
References
[1] Alotto, P., Guarnieri, M., Moro, F. Redox
flow batteries for the storage of renewable
energy: A review. Renewable and Sustainable
Energy Reviews 2014, 29: 325–335.
[2] Zhang, J., Zhang, L., Liu, H., Sun, A., Liu,
R. Electrochemical Technologies for Energy
Storage and Conversion. John Wiley & Sons,
Somerset, NJ, USA 2011.
[3] Arai, H., Hayashi, M. SECONDARY BAT-
TERIES – METAL-AIR SYSTEMS | Overview
(Secondary and Primary). In: Garche, J., Ed.
Encyclopedia of Electrochemical Power Sources.
Elsevier, Amsterdam 2009. Pp. 347–355.
[4] Naish, C., McCubbin, I., Edberg, O., Harfoot,
M. Outlook of energy storage technologies. Pol-
icy Department Economic and Scientific Policy,
Brussels 2007.
[5] Mahlia, T.M.I., Saktisahdan, T.J., Jannifar, A.,
Hasan, M.H., Matseelar, H.S.C. A review of
available methods and development on energy
storage; Technology update. Renewable and
Sustainable Energy Reviews 2014, 33: 532–545.
[6] O’Sullivan, T.M., Bingham, C.M., Clark, R.E.
Zebra Battery Technologies for the All Electric
Smart Car. International Symposium on Power
Electronics Electric Drives Automation and
Motion (SPEEDAM), Institution of Electronic and
Electrical Engineers 2006.
[7] AQUION ENERGY. Introduction to Aquion
Energy and Aqueous Hybrid Ion (AHI™)
Batteries. Available at: http://cdn2.hubspot.
net/hub/147472/file-902175740-pdf/Intro_to_
Aquion_Energy_and_AHI_Batteries_Q214.pdf.
Accessed 10/8, 2014.
[8] AQUION ENERGY. Available at: http://www.
aquionenergy.com/. Accessed 10/8, 2014.
[9] Linden, D., Reddy, T.B. Handbook of Batteries.
3rd edn. McGraw- Hill, New York 2002.
[10] Basic Research Needs for Electrical Energy
Storage. Office of Basic Energy Sciences, U.S.
DOE 2007.
[11] Pei, P., Wang, K., Ma, Z. Technologies for
extending zinc–air battery’s cyclelife: A review.
Appl Energy 2014 9/1; 128(0): 315-316-324.
Acknowledgements
The research described here is
carried out in the large networked
project entity ECV (Electric
Commercial Vehicles) and,
especially, in the public research
entities eStorage3 (energy storage)
and eCharge (systems and the power
grid) within that consortium. The
projects are supported financially
by the EVE programme of Tekes
– the Finnish Funding Agency
for Innovation. The ECV network
involves some 30 industrial partners
and 5 research partners.](https://image.slidesharecdn.com/r12-150323055322-conversion-gate01/85/Smart-City-Research-Highlights-130-320.jpg)
![Smart City Key technologies
129
Jyrki Tervo,
Senior Scientist, jyrki.tervo@vtt.fi
Energy harvesting/
thermoelectrics
Introduction
Energy harvesting uses ambient energy to
generate electricity. It provides potentially low-
cost, maintenance-free, long-life equipment by
reducing the need for batteries or power chords.
Energy harvesting (EH) is also known as power
harvesting or energy scavenging. EH is consid-
ered to give benefits related to environmental
friendliness, safety, security, convenience and
affordability. EH can be used for brand enhancing.
Technically, it can be used to make new things
possible depending on visionary engineering
(Pykälä et al., 2012).
So far, the main commercial successes
include such things as photovoltaics on space
vehicles, road furniture and consumer goods,
electrodynamics in bicycle dynamos and wrist-
watches and piezoelectrics in light switches, and
many forms of EH in building controls. Control
devices without batteries and wiring have already
been realized in many solutions. Energy harvest-
ing is now being made affordable and feasible
for several new, big applications including [1]:
90% of Wireless Sensor Networks (WSN)
are impractical without energy harvesting. These
mesh networks are rarely feasible (without energy
harvesting) because, in the biggest projects
envisaged, such as those in which nodes are
embedded in buildings and machines for life
or on billions of trees, the batteries would be
inaccessible or prohibitively expensive to access.
1. Getting almost free power for electronics
and lighting to developing countries where
batteries are not obtainable.
2. Bionics and sensors are needed in human
bodies that stay there for the life of the
patient. These are the focus of a huge new
research effort.
3. Mobile phones and laptop computers
have batteries that frequently go down. In
fact, the power situation worsens as more
functionality is added; this inconvenience
affects two billion people.
In all these applications, progress is being made
by which new forms of lighting and electronics
need far less electricity, and new forms of energy
harvesting (e.g. thermoelectrics) are better able
to provide it.
Technologies for energy harvesting
As energy harvesting is often understood as
the use of ambient energy to provide electricity
for small and/or mobile equipment, this report
concentrates on small-scale production such as
electrodynamic, microelectromechanical (MEMS),
piezoelectric, thermoelectric, photovoltaic, micro
hydro, tidal, biogas from waste, small-scale wind
power, vibration and kinetic energy.
Figure 1 shows how the output power of
harvesting devices is increasing and the demand
for the electronic devices is decreasing. The](https://image.slidesharecdn.com/r12-150323055322-conversion-gate01/85/Smart-City-Research-Highlights-131-320.jpg)
![130
Standby
32 KHz quartz oscillator
Electronic watch
or calculator
Passive RFID (no battery)
Hearing aid
Advanced WSN / Active RFID
Miniature FM Receiver
Transceiver Bluetooth
PALM MP3
LED indicator light
GSM & Mobile phone
Small LCD & OLED displays
Conventional WSN transmit
Bicycle lighting
ac electroluminescent display
P laptop
P desktop
100 W
10 W
1 W
100 m W
10 m W
1 m W
100 W
10 W
1 W
100 n W
10 n W
Rotary electrodynamic
Photovoltaic or thermoelectric
Vibration harvester
(electrodynamic or piezo
RF beam
Miniature
photovoltaic or
Linear
electrodynamic
Types of harvesting
providing power
without external
charger
button batteries up to AA or AAA size can be
replaced by energy harvesting systems.
The primary energy harvesting needs in
global efforts on energy harvesting development
differ from country to country. The report (EH1
2011) covers 160 case studies of ongoing energy
harvesting in 31 countries. That is enough to give
some idea of the leading countries, technologies
and applications. In North America, the emphasis
of energy harvesting is on applications for the
military, aerospace and healthcare. In Europe the
emphasis is on industrial and healthcare devices,
and in East Asia consumer goods are the most
important group of EH devices. The application
sectors can be divided as shown in Figure 2. A
combined approach uses a primary battery with
an energy harvesting device. This means that the
battery can be much smaller and last longer. Is
this a possible interim approach with Wireless
Sensor Networks (WSN) as we wait for smaller
and more efficient and affordable multiple energy
harvesting for these?
Although the price of the specific technology
is decreasing, our average unit value holds up
because of the change in mix. All the figures given
below relate to the energy harvesting device,
e.g. solar cell, and not the associated energy
storage, wiring or electronics.
Energy harvesting technologies are explained
and exemplified in the reports [3, 4].
The energy source of an electrodynamic
device can be the movement of an oscillating
weight in applications such as watches. Its
power density varies from 1 to 200 mW/cm3
.
An advantage is the high power output and a
disadvantage is the moving parts.
Vibration and kinetic energy can be harvested
using piezoelectric crystals, and piezoelectric
composite fibres are considered the most
promising energy harvesting devices for low-
power applications. The power density of a
piezoelectric device depends on the source:
from machinery vibration 0.5 mW/cm3
and
from a moving shoe insert 0.33 mW/cm3
. Good
features are simplicity and long life. Challenges
are the availability of vibration or movement.
One disadvantage is that moving parts have a
chance of fatigue failures.
Piezoelectrics are being studied for use in
self-powered sensors and controls in the human
body, aircraft, trains, etc. The challenge is to con-
trol the energy (amplitude and bandwidth of the
Figure1. Power demand of electronic devices vs energy harvesting possibilities (EH2 2011):
- arrow upwards: energy harvesting becomes more capable
- arrow downwards: electronic devices become less power hungry.](https://image.slidesharecdn.com/r12-150323055322-conversion-gate01/85/Smart-City-Research-Highlights-132-320.jpg)
![131
Smart City Services
Buildings ; 74
Consumer; 27
Third world; 16
Military and
aerospace; 15
Outdoor
infrastructure;
14
Autos, road, rail;
11
Marine; 8
vibration frequency) going into the piezoelectric
harvester. Mechanical energy input that is too
high can lead to damage. Other opportunities
such as thermoelectrics, magnetostriction and
RF can be alternatives to piezoelectrics.
Vibration can also be harvested by elec-
trostatic or electromagnetic conversion. Kinetic
energy can be converted into electrical energy
using a spring-loaded mechanism.
Thomas John Seebeck discovered the
Seebeck effect in 1821. At that time there was
no rush to commercialize thermoelectric gener-
ators. Charles Athanase Peltier discovered the
Peltier effect eleven years later in 1834. For over
a century, these effects remained little more than
laboratory curiosities. The primary product based
on the Seebeck effect became the thermocouple
for temperature measurements. It was not until
the 1950s that significant resources were put
into thermoelectric research that led to actual
power generation products (Stabler 2006).
Thermoelectric devices use temperature
differences or thermal gradients to generate
electricity. The power density of thermoelectrics
(TE) is quite high when the source is an engine
with temperature differences of up to 120 K:
the power density from a heat flux varies from
1–3 W/cm3 to 20 W/cm3. There are no moving
parts. It is not possible to optimize power and
voltage at the same time. Fabrication costs are
Figure2. Number of EH cases in different application sectors [3].
high and the heat difference is not available at
all times. Thus, energy storage is needed to
stabilize the power.
Photovoltaic cells are usually made of sil-
icon-based material, although other materials
are being studied (and used). Wireless sensor
systems can use the solar energy harvesting
devices directly or for charging their batteries
in the daytime.
Energy harvesting in general has long been
done using micro hydro, tidal and wave energy
– the earliest being structures such as water-
wheels. Tidal and wave energy solutions may
be large-scale applications, but in this report the
low-power applications carry the main weight.
Sewage water is used for heating in dis-
trict heating systems, especially in the Nordic
countries. The waste water temperature is over
10 °C after the water treatment establishment,
so it is useable for heating by heat pump. The
COP (coefficient of the performance) of the heat
pump over the year is high. Condensate water
from the power plant and other sources has
the same heating potential to use heat pumps.
Groundwater and water in seas, lakes and
rivers are also potential sources for heat pumps.
In Finland, for example, groundwater is about
5–6 °C over the year, but the temperature of the
other sources varies during the year following
the annual seasons.](https://image.slidesharecdn.com/r12-150323055322-conversion-gate01/85/Smart-City-Research-Highlights-133-320.jpg)
![132
All the forms of heat pump applications also
use electricity at about one-quarter of the heat
output, so the most desirable applications are
warm water sources for use without a heat pump.
Small-scale wind power
Nowadays wind power plants and wind farms
present large-scale energy production connected
to the distribution or transmission network.
Small-scale wind power can still be installed
in regions that cannot be connected to the
common network.
Thermoelectrics
The variety of thermoelectric (TE) materials that
can be used in energy harvesting is quite large,
and the optimal material for a given application
depends mainly on the temperature range in
which the material is to be used. Although
thermoelectric materials exhibit thermoelectric
behaviour at all temperatures, their figure of
merit (ZT) is quite strongly influenced by tem-
perature, and the ZT value typically peaks in a
certain temperature range. When evaluating the
feasibility of thermoelectric materials for different
applications, the material performance in the
required temperature range, in addition to other
factors like cost and availability, should therefore
be taken into account.
Nanostructuring has led to significant improve-
ment in the properties of thermoelectric materials.
The main strategy has been to decrease the
Table 1. Properties of some promising thermoelectric bulk materials.
Temperature Range
(°C)
Conductivity
Type
ZT Toxicity Price
Bi2
Te3
0-300 n, p 0.5-1.0 High High
MnSi1.73
, Mg2
Si 200-700 n, p 0.5-0.7 Low Low
Zn4
Sb3
200-500 p 0.5-1.2 Medium Low
TAGS 200-600 p 0.5-1.2 Medium Very high
PbTe 200-550 n, p 0.5-1.0 High High
Skutterudites 200-600 n, p 0.5-1.2 Low Low
Oxides 400+ n, p 0.5-0.8 Low Low
La3
Te4
500+ n 0.5-1.1 High High
thermal conductivity via phonon scattering.
Research is required to understand the inter-
action between thermal, electrical and entropy
transport; controlling nanostructures that can
be used in actual devices; and improvements
in materials for soldering, ceramics, packaging,
etc. (Benesch, 2012)
The main focus of the research is still on
tellurides due to their outstanding properties.
Some of the most interesting alternatives to
make cheap and less toxic TE materials include
Mg2
Si, CoSb3
, ZnSb, ZnO
and other oxides. All
these materials have been known about for a
long time. More explorative work is required to
find completely new materials. [6]
Material manufacturing methods such as
sol-gel and electrodeposition are considered to
be scalable to industrial level, and new reliable
and cheap techniques to sinter and compact
the nanostructured material into a nanostruc-
tured bulk material are crucial. [6] Conducting
polymers are a class of materials that could be
produced directly from the solution without sin-
tering. Benesch [6] suggests another completely
different, barely explored strategy: to consider
an electrochemical reaction to thermoelectric
power generation.
The materials considered in this report are
the ones that are most commonly used today
and the ones that show the greatest promise for
applications in the near future. Only bulk materials
will be discussed, as nanostructured or otherwise](https://image.slidesharecdn.com/r12-150323055322-conversion-gate01/85/Smart-City-Research-Highlights-134-320.jpg)
![Smart City Key technologies
133
ECONOMY
SOCIAL
ENVIRONMENT
SUSTAINABILITY
exotic materials are still being researched on a
laboratory scale and are quite a long way off com-
mercialization. Table 1 lists the TE materials to be
discussed and some of their relevant properties.
The temperature range listed for the materials
in Table 1 is that within which their ZT values
are at least 0.5, which is admittedly too low to
compete with other methods of waste heat
recovery but still high enough to make them
useful in applications in which the advantages
of thermoelectrics outweigh the disadvantages.
Based on these temperature ranges, the mate-
rials in Table 1 can be roughly divided into low,
intermediate and high temperature materials.
Bi2
Te3
is the only material in the low temperature
category, oxides and La3
Te4
go into the high
temperature group, while all the other materials
belong to the intermediate temperature group.
The ZT values of the materials are not constant
within the temperature range listed, so the var-
iation in the ZT value is listed in the ZT column
of Table 1. The ZT value is a good way to com-
pare thermoelectric materials, and it also gives
an estimate of the efficiency of the material in
different temperature gradients. Figure 3 shows
the estimated efficiencies of heat recovery for
various ZT values in a temperature gradient.
The efficiencies of current state-of-the-art
thermoelectric devices are in the 5–10% range,
and it is clear from Figure 3 that the ZT values
will need to be raised significantly for thermoe-
lectrics to become competitive with traditional
heat recovery methods.
TE materials must be efficient, stable, envi-
ronmentally friendly, composed of elements
abundant in nature and synthesized with a
scalable method. The low-cost manufacturing
process of the TEGs must also be addressed.
Nowadays, manufacturing constitutes 50% of
the cost of a TEG. At the moment, such materials
and manufacturing methods do not exist or have
not been explored sufficiently and constitute the
main bottleneck for using this technology. [6]
Figure 3. Efficiency of a thermoelectric
device based on its ZT value and the
magnitude of the temperature gradient.
Figure 4. Three components of
sustainability [7].
Sustainability
Meinander and Wahlström (2012) conducted a
qualitative analysis of the sustainability of ther-
mo-electric modules. Due to a lack of data, a
quantitative LCA analysis could not be conducted.
In order for a system to be sustainable it must fulfil
the demands of all three parts, keeping a balance
as illustrated in Figure 4. The sustainability of the
TEs has been analysed based on economic,
environmental and social sustainability. The envi-
ronmental sustain¬ability is evaluated based on
the material characteristics of the used materials.
Environmental sustainability includes covering
current and future demands for resource use.
Due to the decreasing global resources of many
rare materials used in the production of TEs, the
environmental sustain¬ability is considered quite
poor. Economic sustainability, i.e. profitability, can
commonly be considered to be the main objective](https://image.slidesharecdn.com/r12-150323055322-conversion-gate01/85/Smart-City-Research-Highlights-135-320.jpg)
![134
of any business and to be self-sustaining. As the
materials used for TE production are becoming
increasingly scarce due to heavy consumption
in relation to the global resources, the material
prices will probably continue to increase in the
future, which is an indication of poor economic
sustainability of TEs. Social sustainability includes
not endangering any stakeholders throughout
the life cycle of the product or service, including
health aspects, social equity and exploitation.
It is mainly dependent on the conditions for
the employees during raw material extraction,
processing and transport. There were no data
on the origin of the materials, but as the majority
References
[1] Pykälä, M-L, Sipilä, K., Mroueh, U-M, Wahl-
ström, M., Huovila, H., Tynell, T., Tervo,
J., Susterel energy harvesting Roadmap for
societal applications. VTT Research Report
VTT-R-05917-12, 2012, 50 p.
[2] P. Harrop, R. Das, Energy Harvesting and
Storage for Electronic Devices 2010–2020,
IDTechEx 2011, 357 p.
[3] P. Harrop, R. Das, Energy Harvesting in
Action 2011, IDTechEx, 2011, 231 p.
[4] Frost & Sullivan 2007, Advances in Energy
Harvesting Technologies, DOC2, Technical
Summary
Energy harvesting with thermoelectric generators
is expected to have an important position among
future sustainable energy technologies. With
thermoelectric generators, waste heat can be
converted into electricity. The existing sources of
waste heat within societies were mapped. In the
cases, the temperatures are typically lower than
300˚C and the heat sources are ubiquitous. The
two main drawbacks of thermoelectrics are high
cost and low efficiency, which limit the practical
uses of thermoelectrics to low power applications
such as wireless sensors and sensor networks.
Such applications have not been available before
and the novel low-power devices therefore provide
new opportunities for energy harvesting appli-
cations. TE materials must be efficient, stable,
environmentally friendly, composed of elements
of the production of the materials used in TEs is in
emerging economies (where social conditions are
generally poor) the production of these materials
can be considered socially unsustainable.
The qualitative analysis does not enable a com-
parative analysis with another system, and the results
of the sustainability analysis should therefore only be
seen as indicative of where improvement and research
are needed. The TEs are considered unsustainable
due to the poor sufficiency of many of the used
materials, as well as the lack of knowledge of their
origin. By finding improved substitute materials and/
or using recovered materials the environmental and
social sustainability of the TEs could be improved.
abundant in nature and synthesized with a scalable
method. Enhanced research on thermoelectrics has
been able to improve material properties, but progress
is considered to be relatively slow. Another important
factor affecting cost is manufacturing. Nowadays,
manufacturing constitutes 50% of the cost of a TEG,
and low-cost materials and manufacturing methods do
not currently exist or are not explored sufficiently and
constitute the main bottleneck for using the technology.
Recommendations given include further material
science research on materials structure, electrical
properties and performance, as well as processing
and manufacturing to overcome obstacles related to
price and production up-scaling. The work requires
multi-disciplinary activity and co-operation. The utili-
zation of advanced modelling supports the required
multi-disciplinary actions.
Smart City Key technologies
Insights, Frost & Sullivan, 2007, 93 p.
[5] Stabler, F.R., Commercialization of Thermoelectric
Technology, Materials Research Society Sym-
posium Proceedings Vol. 886 (2006), Materials
Research Society, 10 p.
[6] Benesch, J.V. (editor), Report on Forward Look-
ing Workshop on Materials for Emerging Energy
Technologies. EUROPEAN COMMISSION, Directo-
rate-General for Research and Innovation, Industrial
Technologies Material Unit, EUR 25350 EN, 2012.
[7] Meinander, M., Wahlström, M., Sustainability
analysis for thermoelectrics. VTT research report
VTT-R-05918-12, 2012, 17 p.](https://image.slidesharecdn.com/r12-150323055322-conversion-gate01/85/Smart-City-Research-Highlights-136-320.jpg)
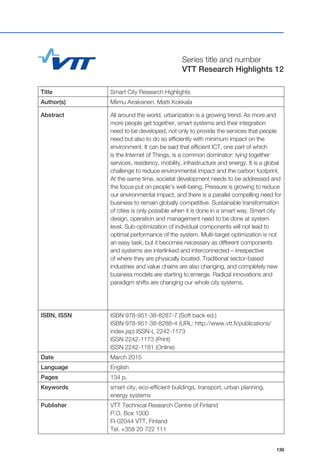


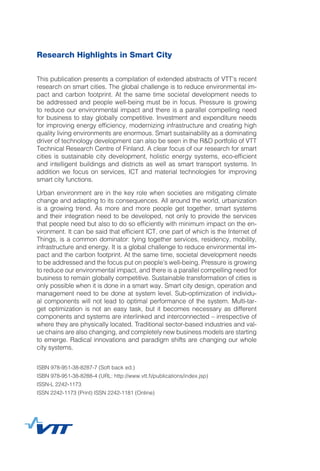

The document provides a comprehensive overview of smart city concepts and VTT's research contributions toward developing smarter urban environments. It highlights the integration of advanced ICT, energy management, and collaborative systems that enable efficient urban services while addressing environmental sustainability and citizen participation. The collection of abstracts presents ongoing research addressing key topics and challenges related to smart city innovations and their implications for future urban development.


