This document provides an introduction to the Julia programming language and demonstrates its use for statistical computing and analysis. It summarizes Julia's capabilities for technical computing and compares its performance to R, Python, and other languages. Examples showing Julia's speed advantages include bootstrap analysis of correlation coefficients and MCMC sampling for Bayesian logistic regression. Overall, Julia is shown to be significantly faster than R and other options for many statistical tasks.


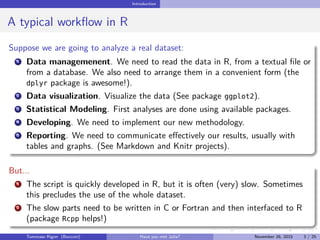


![Bootstrap example
Implementation
Listing 1: Bootstrap; R implementation
rho_boot <- function(R,dataset){
n <- NROW(dataset)
# Sampling the indexes
index <- matrix(sample(1:n,R*n,replace=TRUE),R,n)
# Bootstrap correlation estimate
apply(index,1,function(x) cor(dataset[x,1],dataset[x,2]) )
}
Listing 2: Bootstrap; Julia implementation
function rho_boot(R,dataset)
n = size(data)[1]
# Sampling the indexes
index = rand(1:n,n,R)
out = Array(Float64,R)
for i in 1:R
# Bootstrap correlation estimate
out[i] = cor(dataset[index[:,i],:])[1,2]
end
out
end
Tommaso Rigon Have you met Julia? May 2, 2016 11 / 25](https://image.slidesharecdn.com/presentazione-160502164847/85/Have-you-met-Julia-11-320.jpg)
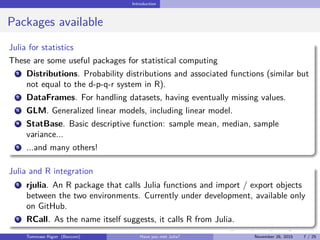
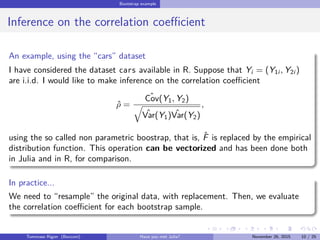
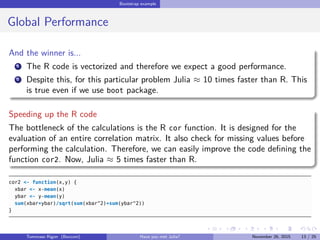
![Bootstrap example
Performance - Milliseconds in log-scale
Naive_R Julia Boot_library Boot_library_cor2
501002005001000
Expression
log(time)[t]
Tommaso Rigon Have you met Julia? May 2, 2016 12 / 25](https://image.slidesharecdn.com/presentazione-160502164847/85/Have-you-met-Julia-12-320.jpg)
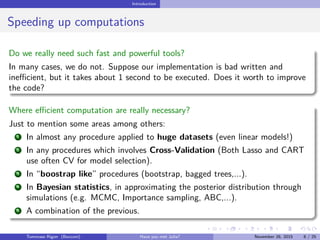
![Bootstrap example
Implementation
function tau_est(data)
R = cor(data)
lambda = eigvals(R)
tau = (lambda/sum(lambda))[end] # Also lambda[end]/p is fine
tau
end
function pca_boot(R,data)
n = size(data)[1]
index = rand(1:n,n,R)
out = Array(Float64,R)
for i in 1:R
out[i] = tau_est(data[index[:,i],:])
end
out
end
Tommaso Rigon Have you met Julia? May 2, 2016 17 / 25](https://image.slidesharecdn.com/presentazione-160502164847/85/Have-you-met-Julia-17-320.jpg)
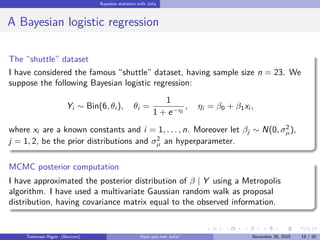
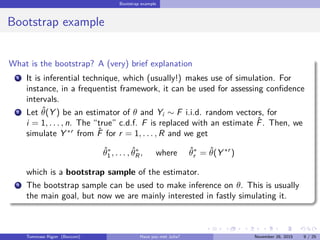
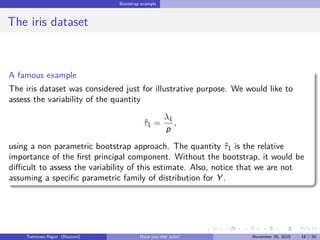
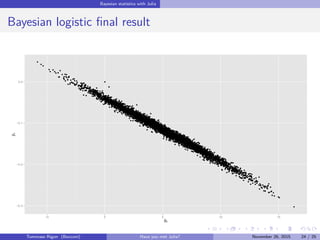
![Bayesian statistics with Julia
First step: the log-posterior
Listing 3: Julia implementation
using Distributions
# Log-likelihood
function loglik(data::Matrix, beta::Vector)
eta = beta[1] + beta[2]*data[:,3]
theta = 1./(1 + exp(- eta))
sum(data[:,2].*eta) + sum(data[:,1].*log(1-theta))
end
# Log-posterior up to an additive constant
function lpost(data::Matrix, beta::Vector, sigma_mu::Float64)
norm = Normal(0,sigma_mu)
loglik(data,beta) + logpdf(norm,beta[1]) + logpdf(norm,beta[2])
end
Tommaso Rigon Have you met Julia? May 2, 2016 20 / 25](https://image.slidesharecdn.com/presentazione-160502164847/85/Have-you-met-Julia-20-320.jpg)
![Bayesian statistics with Julia
Metropolis Algorithm
Listing 4: Julia implementation
using Optim # For numerical optimization
using ForwardDiff # For numerical derivative
# Maximum likelihood estimate
beta_hat = optimize(x -> -loglik(data,x),[0.0, 0.0], method=:l_bfgs).minimum
# Observed information matrix
Sigma = inv(ForwardDiff.hessian(x -> -loglik(data,x), beta_hat))
Listing 5: Julia implementation
function Metropolis(R::Int64, Sigma::Matrix, sigma_mu::Float64,start::Vector)
out = zeros(R,2)
beta = start #Initialization
for r in 1:R
beta_star = rand(MvNormal(beta,Sigma)) # Proposal distribution
alpha = exp(lpost(data,beta_star,sigma_mu) - lpost(data,beta,sigma_mu))
if rand(1)[1] < alpha # ‘rand’ is a pseudo random from a Uniform
beta = copy(beta_star) # Copy if accepted
end
out[r,:] = beta
end
out
end
Tommaso Rigon Have you met Julia? May 2, 2016 21 / 25](https://image.slidesharecdn.com/presentazione-160502164847/85/Have-you-met-Julia-21-320.jpg)
![Bayesian statistics with Julia
Performance - Milliseconds in log-scale
R Julia OpenBUGS STAN
10020050010002000
Expression
log(time)[t]
Tommaso Rigon Have you met Julia? May 2, 2016 22 / 25](https://image.slidesharecdn.com/presentazione-160502164847/85/Have-you-met-Julia-22-320.jpg)


![[DSC Europe 25] Andrzej Kowalczyk - AI - how to start small and grow in the f...](https://cdn.slidesharecdn.com/ss_thumbnails/oy1zmo94qv6vpcqjvno2-andrzej-kowalczyk-ai-how-to-start-small-and-grow-in-the-future-1-260119121559-cf093b23-thumbnail.jpg?width=640&height=640&fit=bounds)


![[DSC Europe 25] Slobodan Dolinic - Smart and Intelligent Green Region.pptx](https://cdn.slidesharecdn.com/ss_thumbnails/0bribinjsp6ghwtvsvor-2-sigre-slobodan-dolinic-260115093812-c9c10e90-thumbnail.jpg?width=640&height=640&fit=bounds)