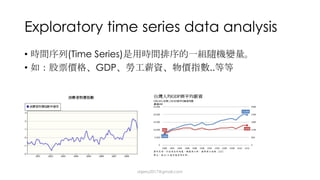
Downloaded 64 times


![Fun Time –
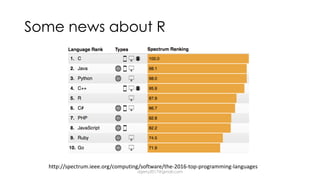
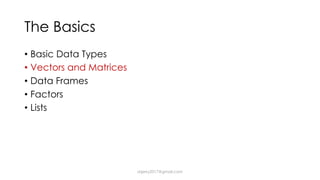
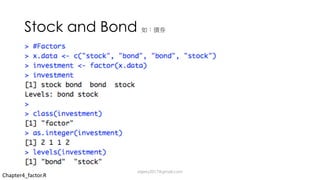
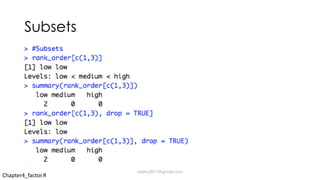
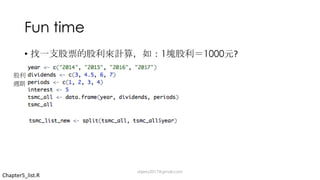
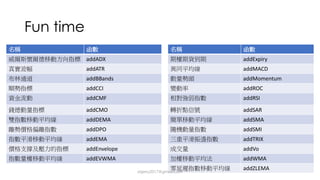
What’s incorrect about subsetting
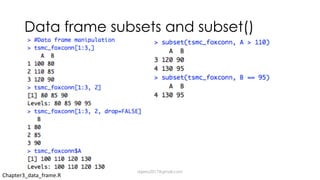
• Tsmc and foxconn columns
A. M_tsmc_foxconn[,c(“tsmc”, “foxconn”)]
B. M_tsmc_foxconn[c(“tsmc”, “foxconn”)]
C. M_tsmc_foxconn[,]
dsjerry2017@gmail.com](https://image.slidesharecdn.com/rprogrammingforquantitativefinance0623-170623161007/85/R-programming-for_quantitative_finance_0623-32-320.jpg)
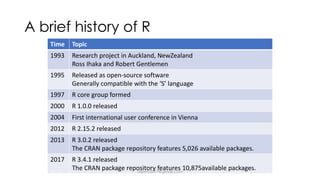
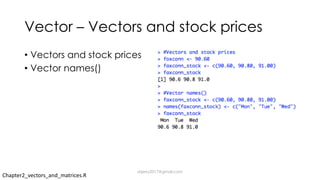
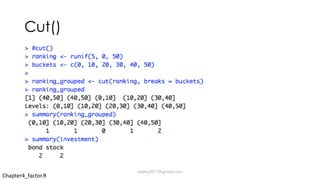
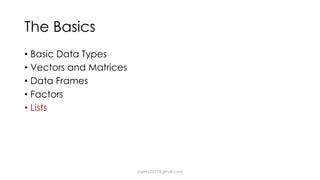
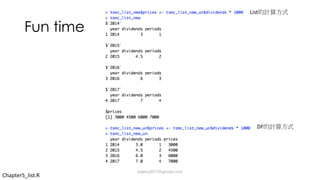
![Present value( )
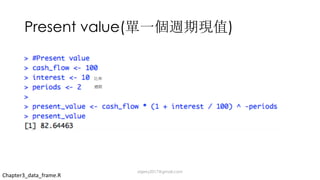
•
Cash / (1 + X /100) ^ Periods( )
Cash * (1 + X / 100) ^ -Periods( )
Chapter3_data_frame.R
dsjerry2017@gmail.com
1000 6%
839.62 [1000 / (1 + 6%)^3]
X =](https://image.slidesharecdn.com/rprogrammingforquantitativefinance0623-170623161007/85/R-programming-for_quantitative_finance_0623-39-320.jpg)

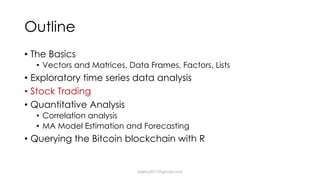
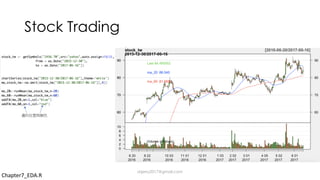
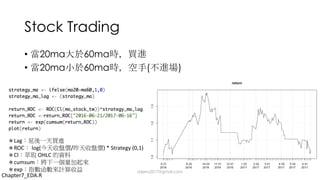
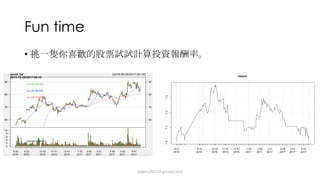
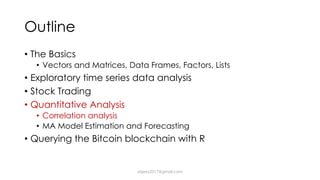


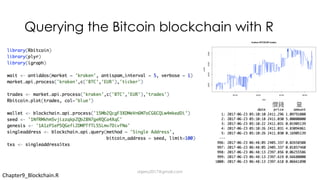
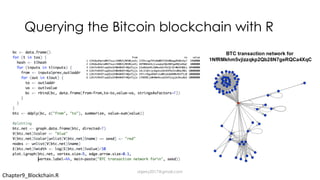


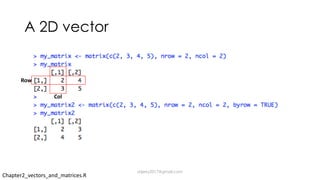
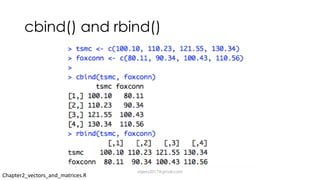
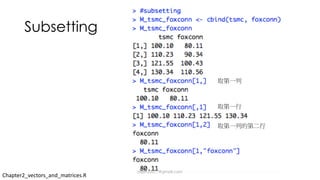
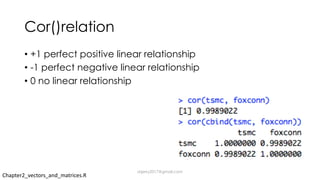
This document provides an overview of using R for quantitative finance. It discusses R's history and popularity, basics of R including vectors, matrices, data frames and lists. It also covers exploratory time series analysis, stock trading strategies, correlation analysis, ARIMA modeling and forecasting, and querying the Bitcoin blockchain with R packages. The document is intended to introduce analysts to capabilities of the R programming language for financial applications.