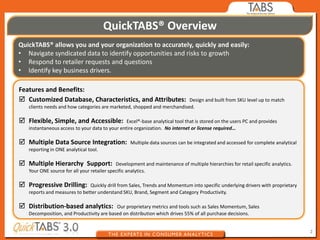
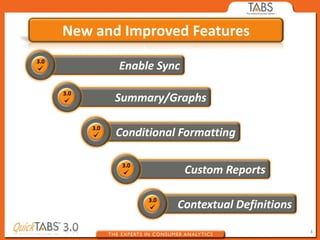
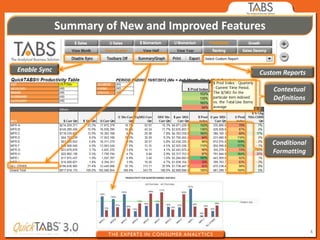
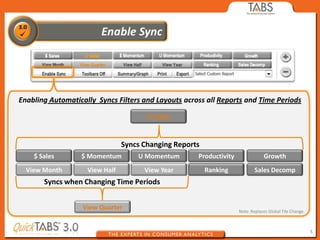
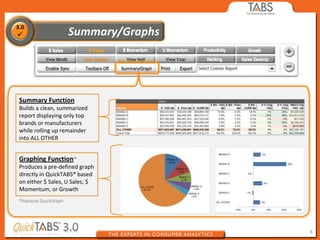
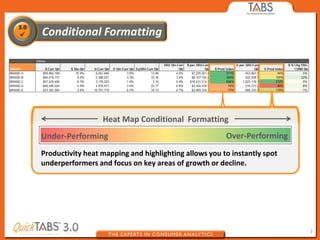
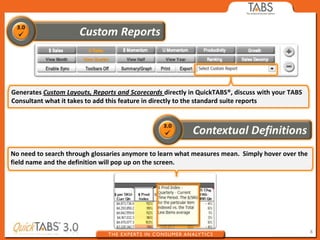
New and Improved Features
        February 20, 2013
QuickTABS® Overview
QuickTABS® allows you and your organization to accurately, quickly and easily:
• Navigate syndicated data to identify opportunities and risks to growth
• Respond to retailer requests and questions
• Identify key business drivers.

Features and Benefits:
 Customized Database, Characteristics, and Attributes:                  Design and built from SKU level up to match
   clients needs and how categories are marketed, shopped and merchandised.

 Flexible, Simple, and Accessible:             Excel®-base analytical tool that is stored on the users PC and provides
   instantaneous access to your data to your entire organization. No internet or license required…

 Multiple Data Source Integration:               Multiple data sources can be integrated and accessed for complete analytical
   reporting in ONE analytical tool.

 Multiple Hierarchy Support:               Development and maintenance of multiple hierarchies for retail specific analytics.
   Your ONE source for all your retailer specific analytics.

 Progressive Drilling:       Quickly drill from Sales, Trends and Momentum into specific underlying drivers with proprietary
   reports and measures to better understand SKU, Brand, Segment and Category Productivity.

 Distribution-based analytics:           Our proprietary metrics and tools such as Sales Momentum, Sales
   Decomposition, and Productivity are based on distribution which drives 55% of all purchase decisions.


                                                                                                                                 2
New and Improved Features
3.0
                  Enable Sync

      3.0
                  Summary/Graphs

            3.0
                  Conditional Formatting

                   3.0
                                Custom Reports

                         3.0
                               Contextual Definitions

                                                        3
Summary of New and Improved Features


Enable Sync                                     Custom Reports

                                                     Contextual
                                                     Definitions


                                                     Conditional
                                                     Formatting


                                                                   4
Enabling Automatically Syncs Filters and Layouts across all Reports and Time Periods

                                       U Sales


                                Syncs Changing Reports
    $ Sales       $ Momentum        U Momentum       Productivity               Growth
  View Month        View Half         View Year          Ranking           Sales Decomp
       Syncs when Changing Time Periods


                   View Quarter                                     Note: Replaces Global Tile Change


                                                                                                        5
Summary Function
Builds a clean, summarized
report displaying only top
brands or manufacturers
while rolling up remainder
into ALL OTHER


Graphing Function*
Produces a pre-defined graph
directly in QuickTABS® based
on either $ Sales, U Sales, $
Momentum, or Growth
*Replaces QuickGraph


                                6
Heat Map Conditional Formatting
Under-Performing                                       Over-Performing
Productivity heat mapping and highlighting allows you to instantly spot
underperformers and focus on key areas of growth or decline.


                                                                          7
Generates Custom Layouts, Reports and Scorecards directly in QuickTABS®, discuss with your TABS
Consultant what it takes to add this feature in directly to the standard suite reports


No need to search through glossaries anymore to learn what measures mean. Simply hover over the
field name and the definition will pop up on the screen.


                                                                                                  8

QuickTABS New Features

  • 1.
    New and ImprovedFeatures February 20, 2013
  • 2.
    QuickTABS® Overview QuickTABS® allowsyou and your organization to accurately, quickly and easily: • Navigate syndicated data to identify opportunities and risks to growth • Respond to retailer requests and questions • Identify key business drivers. Features and Benefits:  Customized Database, Characteristics, and Attributes: Design and built from SKU level up to match clients needs and how categories are marketed, shopped and merchandised.  Flexible, Simple, and Accessible: Excel®-base analytical tool that is stored on the users PC and provides instantaneous access to your data to your entire organization. No internet or license required…  Multiple Data Source Integration: Multiple data sources can be integrated and accessed for complete analytical reporting in ONE analytical tool.  Multiple Hierarchy Support: Development and maintenance of multiple hierarchies for retail specific analytics. Your ONE source for all your retailer specific analytics.  Progressive Drilling: Quickly drill from Sales, Trends and Momentum into specific underlying drivers with proprietary reports and measures to better understand SKU, Brand, Segment and Category Productivity.  Distribution-based analytics: Our proprietary metrics and tools such as Sales Momentum, Sales Decomposition, and Productivity are based on distribution which drives 55% of all purchase decisions. 2
  • 3.
    New and ImprovedFeatures 3.0 Enable Sync 3.0 Summary/Graphs 3.0 Conditional Formatting 3.0 Custom Reports 3.0 Contextual Definitions 3
  • 4.
    Summary of Newand Improved Features Enable Sync Custom Reports Contextual Definitions Conditional Formatting 4
  • 5.
    Enabling Automatically SyncsFilters and Layouts across all Reports and Time Periods U Sales Syncs Changing Reports $ Sales $ Momentum U Momentum Productivity Growth View Month View Half View Year Ranking Sales Decomp Syncs when Changing Time Periods View Quarter Note: Replaces Global Tile Change 5
  • 6.
    Summary Function Builds aclean, summarized report displaying only top brands or manufacturers while rolling up remainder into ALL OTHER Graphing Function* Produces a pre-defined graph directly in QuickTABS® based on either $ Sales, U Sales, $ Momentum, or Growth *Replaces QuickGraph 6
  • 7.
    Heat Map ConditionalFormatting Under-Performing Over-Performing Productivity heat mapping and highlighting allows you to instantly spot underperformers and focus on key areas of growth or decline. 7
  • 8.
    Generates Custom Layouts,Reports and Scorecards directly in QuickTABS®, discuss with your TABS Consultant what it takes to add this feature in directly to the standard suite reports No need to search through glossaries anymore to learn what measures mean. Simply hover over the field name and the definition will pop up on the screen. 8