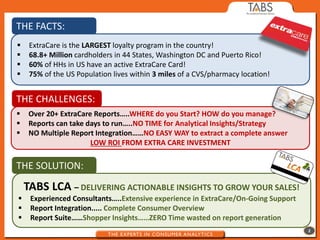
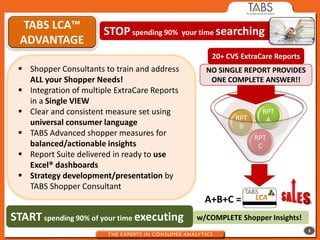
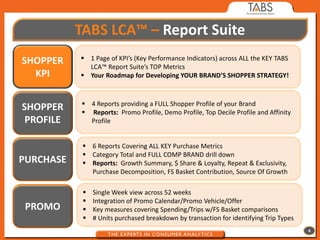
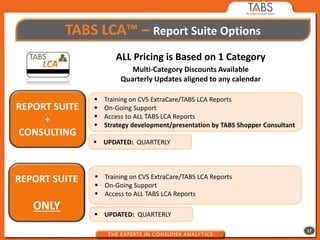
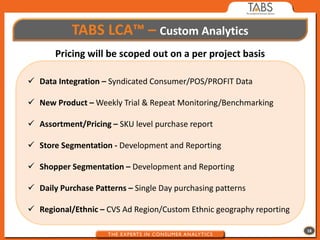
TABS LCA™
Loyalty Card Analytics
THE FACTS:
    ExtraCare is the LARGEST loyalty program in the country!
    68.8+ Million cardholders in 44 States, Washington DC and Puerto Rico!
    60% of HHs in US have an active ExtraCare Card!
    75% of the US Population lives within 3 miles of a CVS/pharmacy location!


THE CHALLENGES:
    Over 20+ ExtraCare Reports…..WHERE do you Start? HOW do you manage?
    Reports can take days to run…..NO TIME for Analytical Insights/Strategy
    NO Multiple Report Integration……NO EASY WAY to extract a complete answer
                       LOW ROI FROM EXTRA CARE INVESTMENT

THE SOLUTION:
    TABS LCA – DELIVERING ACTIONABLE INSIGHTS TO GROW YOUR SALES!
    Experienced Consultants…..Extensive experience in ExtraCare/On-Going Support
    Report Integration..... Complete Consumer Overview
    Report Suite……Shopper Insights……ZERO Time wasted on report generation
                                                                                    2
TABS LCA™
                       STOP spending 90% your time searching
  ADVANTAGE
                                                   20+ CVS ExtraCare Reports
  Shopper Consultants to train and address      NO SINGLE REPORT PROVIDES
   ALL your Shopper Needs!                        ONE COMPLETE ANSWER!!
  Integration of multiple ExtraCare Reports
   in a Single VIEW
  Clear and consistent measure set using                        RPT
                                                         RPT      A
   universal consumer language                            B
  TABS Advanced shopper measures for                          RPT
   balanced/actionable insights                                 C
  Report Suite delivered in ready to use
   Excel® dashboards
  Strategy development/presentation by
   TABS Shopper Consultant
                                                 A+B+C =
START spending 90% of your time executing      w/COMPLETE Shopper Insights!
                                                                               3
TABS LCA™ – Report Suite
SHOPPER     1 Page of KPI’s (Key Performance Indicators) across ALL the KEY TABS
             LCA™ Report Suite’s TOP Metrics
  KPI       Your Roadmap for Developing YOUR BRAND’S SHOPPER STRATEGY!


            4 Reports providing a FULL Shopper Profile of your Brand
SHOPPER     Reports: Promo Profile, Demo Profile, Top Decile Profile and Affinity
 PROFILE     Profile


             6 Reports Covering ALL KEY Purchase Metrics
             Category Total and FULL COMP BRAND drill down
PURCHASE     Reports: Growth Summary, $ Share & Loyalty, Repeat & Exclusivity,
              Purchase Decomposition, FS Basket Contribution, Source Of Growth

               Single Week view across 52 weeks
               Integration of Promo Calendar/Promo Vehicle/Offer
 PROMO         Key measures covering Spending/Trips w/FS Basket comparisons
               # Units purchased breakdown by transaction for identifying Trip Types
                                                                                        4
SHOPPER KPI   Road Map….To Develop You Brand’s Shopper Strategy

                 ALL Shopper Metrics on 1 page


                                                                  5
SHOPPER PROFILE                          TOP DECILE PROFILE
        Speak the CVS Language!

       Understand how your Brand ranks within CVS’ TOP $ DECILES


                                                                   6
SHOPPER PROFILE                           PROMO PROFILE
        Develop Promo Strategy

       Understand How sensitive YOUR shoppers are to ALL Promotions

                         Increase/Decrease your # of promotions


                                                                      7
SHOPPER PROFILE                     DEMO PROFILE
                                Develop Targeted Marketing Events


 Know WHO your CVS Shopper is

    Compare to CVS’ Shopper


                                                                    8
SHOPPER PROFILE                             AFFINITY PROFILE
    Develop Cross Promotional/Merchandising Strategy

        Know what else is in the Basket when YOUR BRAND is purchased


                                                                       9
PURCHASE                                                              GROWTH SUMMARY
                                                    ALL Purchase Growth Metrics on 1 Page

%/Pt Chg YAGO:                                      Benchmark Your Brand to ALL Comp Brands & Category
                                                                                                                                    FS Trips Per
                                    # Buyers           $ Sales       $ Per Buyer    Trips Per Buyer   $ Per Trip   FS $ Per Buyer      Buyer       FS $ Per Trip
 $ Share                      0.6
                                                             26.8%


$ Loyalty -0.7                              14.5%
                                                                                                                            12.2%
                                                                            10.7%                                                          9.7%
                                                                                             8.6%
                                                      5.7%           6.1%
                                                                                      4.0%                           3.9%
                                                                                                      2.1% 1.9%                     1.6%            2.3% 2.3%
% Repeat -0.7

                                    -0.4%
  $ Share   $ Loyalty   % Repeat
                                                                                      TL-CATEGORY     YOUR BRAND


                                                                                                                                                                10
PURCHASE                                        SHARE & LOYALTY
                                   Evaluate/Benchmark YOUR BRAND’S
                              $ Share of the Category vs. It’s $ Share of Wallet
                    $ Share        COMP
                                                                           $ Loyalty
                                  BRAND 1
   ALL OTHER                        14%                    29%
      34%                                        26%                 27%       27%
                                     COMP                                                                   21%
                                    BRAND 2                                              19%       20%
                                      13%
  YOUR
BRAND 4%
                                      COMP
  COMP                               BRAND 3
BRAND 6 4%                             13%
                                 COMP
         COMP                   BRAND 4          COMP      COMP      COMP      COMP      COMP      COMP      YOUR
       BRAND 5 7%                 12%           BRAND 1   BRAND 2   BRAND 3   BRAND 4   BRAND 5   BRAND 6   BRAND


                                                                                                                    11
PURCHASE                                                  REPEAT & EXCLUSIVITY
                                               Evaluate/Benchmark YOUR BRAND’S
                                                Repeat Rate vs. It’s Exclusivity Rate
                           % Repeat                                                          % Exclusivity
                                                                     16%                           17%
 31%       30%       31%
                               29%                                             14%       15%
                                                            27%                                              13%
                                                   25%
                                         23%
                                                                                                                       11%
                                                                                                                                10%


 COMP      COMP      COMP      COMP      COMP      COMP      YOUR    COMP      COMP      COMP      COMP      COMP      COMP      YOUR
BRAND 1   BRAND 2   BRAND 3   BRAND 4   BRAND 5   BRAND 6   BRAND   BRAND 1   BRAND 2   BRAND 3   BRAND 4   BRAND 5   BRAND 6   BRAND


                                                                                                                                        12
PURCHASE                                    PURCHASE DECOMPOSITION
                         Evaluate/Benchmark what is driving YOUR BRAND’S growth
                                      Based on Spending & Trip Rates
             COMP BRAND 1    COMP BRAND 2   COMP BRAND 3   COMP BRAND 4   COMP BRAND 5   COMP BRAND 6   YOUR BRAND
 $ Per
                                $20.50         $18.10         $16.80                                      $18.60
 Buyer          $15.90                                                       $11.70         $15.70


Trips Per         1.6             1.6            1.7            1.6                           1.5           1.5
                                                                               1.4
 Buyer

 $ Per           $9.78
                                $12.72         $10.93         $10.73          $8.40         $10.66        $12.06
  Trip


                                                                                                                   13
PURCHASE                                      FS BASKET CONTRIBUTION
                        Evaluate/Benchmark how valuable YOUR SHOPPER is to CVS
                                 Based on $’s and Trips at CVS’ Front Store
            COMP BRAND 1   COMP BRAND 2   COMP BRAND 3    COMP BRAND 4   COMP BRAND 5   COMP BRAND 6   YOUR BRAND
FS $ Per        $555           $601           $598            $585           $602           $694          $696
 Buyer

FS Trips                                                                                                  34.5
                28.1           28.9           30.1            29.3           30.2           32.8
  Per
 Buyer

FS $ Per       $19.79         $20.79         $19.88          $19.93         $19.92
                                                                                           $21.18        $20.19
  Trip


                                                                                                                  14
PURCHASE   SOURCE OF GROWTH

            Develop strategy by understanding
                     YOUR BRAND’s
                    ATTRITION RATE
                            &
                    RETENTION RATE

           Measure your growth by distinguishing
           RETAINED vs. NEW Buyer Contribution


                                                   15
PROMO
   Increase your ROI on Promotions based on SHOPPER TRIP patterns

 Measure YOUR BRAND’s Shopper Promotional Impact across 52 single weeks

                     Develop Shopper Based Promotional Calendar


                                                                          16
TABS LCA™ – Report Suite Options
                      ALL Pricing is Based on 1 Category
                           Multi-Category Discounts Available
                        Quarterly Updates aligned to any calendar

                  Training on CVS ExtraCare/TABS LCA Reports
REPORT SUITE      On-Going Support
                  Access to ALL TABS LCA Reports
     +            Strategy development/presentation by TABS Shopper Consultant
CONSULTING
                UPDATED: QUARTERLY


REPORT SUITE    Training on CVS ExtraCare/TABS LCA Reports
                On-Going Support
                Access to ALL TABS LCA Reports
   ONLY
                UPDATED: QUARTERLY

                                                                                  17
TABS LCA™ – Custom Analytics
       Pricing will be scoped out on a per project basis

 Data Integration – Syndicated Consumer/POS/PROFIT Data

 New Product – Weekly Trial & Repeat Monitoring/Benchmarking

 Assortment/Pricing – SKU level purchase report

 Store Segmentation - Development and Reporting

 Shopper Segmentation – Development and Reporting

 Daily Purchase Patterns – Single Day purchasing patterns

 Regional/Ethnic – CVS Ad Region/Custom Ethnic geography reporting

                                                                      18

TABS LCA (Loyalty Card Analytics)

  • 1.
  • 2.
    THE FACTS:  ExtraCare is the LARGEST loyalty program in the country!  68.8+ Million cardholders in 44 States, Washington DC and Puerto Rico!  60% of HHs in US have an active ExtraCare Card!  75% of the US Population lives within 3 miles of a CVS/pharmacy location! THE CHALLENGES:  Over 20+ ExtraCare Reports…..WHERE do you Start? HOW do you manage?  Reports can take days to run…..NO TIME for Analytical Insights/Strategy  NO Multiple Report Integration……NO EASY WAY to extract a complete answer LOW ROI FROM EXTRA CARE INVESTMENT THE SOLUTION: TABS LCA – DELIVERING ACTIONABLE INSIGHTS TO GROW YOUR SALES!  Experienced Consultants…..Extensive experience in ExtraCare/On-Going Support  Report Integration..... Complete Consumer Overview  Report Suite……Shopper Insights……ZERO Time wasted on report generation 2
  • 3.
    TABS LCA™ STOP spending 90% your time searching ADVANTAGE 20+ CVS ExtraCare Reports  Shopper Consultants to train and address NO SINGLE REPORT PROVIDES ALL your Shopper Needs! ONE COMPLETE ANSWER!!  Integration of multiple ExtraCare Reports in a Single VIEW  Clear and consistent measure set using RPT RPT A universal consumer language B  TABS Advanced shopper measures for RPT balanced/actionable insights C  Report Suite delivered in ready to use Excel® dashboards  Strategy development/presentation by TABS Shopper Consultant A+B+C = START spending 90% of your time executing w/COMPLETE Shopper Insights! 3
  • 4.
    TABS LCA™ –Report Suite SHOPPER  1 Page of KPI’s (Key Performance Indicators) across ALL the KEY TABS LCA™ Report Suite’s TOP Metrics KPI  Your Roadmap for Developing YOUR BRAND’S SHOPPER STRATEGY!  4 Reports providing a FULL Shopper Profile of your Brand SHOPPER  Reports: Promo Profile, Demo Profile, Top Decile Profile and Affinity PROFILE Profile  6 Reports Covering ALL KEY Purchase Metrics  Category Total and FULL COMP BRAND drill down PURCHASE  Reports: Growth Summary, $ Share & Loyalty, Repeat & Exclusivity, Purchase Decomposition, FS Basket Contribution, Source Of Growth  Single Week view across 52 weeks  Integration of Promo Calendar/Promo Vehicle/Offer PROMO  Key measures covering Spending/Trips w/FS Basket comparisons  # Units purchased breakdown by transaction for identifying Trip Types 4
  • 5.
    SHOPPER KPI Road Map….To Develop You Brand’s Shopper Strategy ALL Shopper Metrics on 1 page 5
  • 6.
    SHOPPER PROFILE TOP DECILE PROFILE Speak the CVS Language! Understand how your Brand ranks within CVS’ TOP $ DECILES 6
  • 7.
    SHOPPER PROFILE PROMO PROFILE Develop Promo Strategy Understand How sensitive YOUR shoppers are to ALL Promotions Increase/Decrease your # of promotions 7
  • 8.
    SHOPPER PROFILE DEMO PROFILE Develop Targeted Marketing Events Know WHO your CVS Shopper is Compare to CVS’ Shopper 8
  • 9.
    SHOPPER PROFILE AFFINITY PROFILE Develop Cross Promotional/Merchandising Strategy Know what else is in the Basket when YOUR BRAND is purchased 9
  • 10.
    PURCHASE GROWTH SUMMARY ALL Purchase Growth Metrics on 1 Page %/Pt Chg YAGO: Benchmark Your Brand to ALL Comp Brands & Category FS Trips Per # Buyers $ Sales $ Per Buyer Trips Per Buyer $ Per Trip FS $ Per Buyer Buyer FS $ Per Trip $ Share 0.6 26.8% $ Loyalty -0.7 14.5% 12.2% 10.7% 9.7% 8.6% 5.7% 6.1% 4.0% 3.9% 2.1% 1.9% 1.6% 2.3% 2.3% % Repeat -0.7 -0.4% $ Share $ Loyalty % Repeat TL-CATEGORY YOUR BRAND 10
  • 11.
    PURCHASE SHARE & LOYALTY Evaluate/Benchmark YOUR BRAND’S $ Share of the Category vs. It’s $ Share of Wallet $ Share COMP $ Loyalty BRAND 1 ALL OTHER 14% 29% 34% 26% 27% 27% COMP 21% BRAND 2 19% 20% 13% YOUR BRAND 4% COMP COMP BRAND 3 BRAND 6 4% 13% COMP COMP BRAND 4 COMP COMP COMP COMP COMP COMP YOUR BRAND 5 7% 12% BRAND 1 BRAND 2 BRAND 3 BRAND 4 BRAND 5 BRAND 6 BRAND 11
  • 12.
    PURCHASE REPEAT & EXCLUSIVITY Evaluate/Benchmark YOUR BRAND’S Repeat Rate vs. It’s Exclusivity Rate % Repeat % Exclusivity 16% 17% 31% 30% 31% 29% 14% 15% 27% 13% 25% 23% 11% 10% COMP COMP COMP COMP COMP COMP YOUR COMP COMP COMP COMP COMP COMP YOUR BRAND 1 BRAND 2 BRAND 3 BRAND 4 BRAND 5 BRAND 6 BRAND BRAND 1 BRAND 2 BRAND 3 BRAND 4 BRAND 5 BRAND 6 BRAND 12
  • 13.
    PURCHASE PURCHASE DECOMPOSITION Evaluate/Benchmark what is driving YOUR BRAND’S growth Based on Spending & Trip Rates COMP BRAND 1 COMP BRAND 2 COMP BRAND 3 COMP BRAND 4 COMP BRAND 5 COMP BRAND 6 YOUR BRAND $ Per $20.50 $18.10 $16.80 $18.60 Buyer $15.90 $11.70 $15.70 Trips Per 1.6 1.6 1.7 1.6 1.5 1.5 1.4 Buyer $ Per $9.78 $12.72 $10.93 $10.73 $8.40 $10.66 $12.06 Trip 13
  • 14.
    PURCHASE FS BASKET CONTRIBUTION Evaluate/Benchmark how valuable YOUR SHOPPER is to CVS Based on $’s and Trips at CVS’ Front Store COMP BRAND 1 COMP BRAND 2 COMP BRAND 3 COMP BRAND 4 COMP BRAND 5 COMP BRAND 6 YOUR BRAND FS $ Per $555 $601 $598 $585 $602 $694 $696 Buyer FS Trips 34.5 28.1 28.9 30.1 29.3 30.2 32.8 Per Buyer FS $ Per $19.79 $20.79 $19.88 $19.93 $19.92 $21.18 $20.19 Trip 14
  • 15.
    PURCHASE SOURCE OF GROWTH Develop strategy by understanding YOUR BRAND’s ATTRITION RATE & RETENTION RATE Measure your growth by distinguishing RETAINED vs. NEW Buyer Contribution 15
  • 16.
    PROMO Increase your ROI on Promotions based on SHOPPER TRIP patterns Measure YOUR BRAND’s Shopper Promotional Impact across 52 single weeks Develop Shopper Based Promotional Calendar 16
  • 17.
    TABS LCA™ –Report Suite Options ALL Pricing is Based on 1 Category Multi-Category Discounts Available Quarterly Updates aligned to any calendar  Training on CVS ExtraCare/TABS LCA Reports REPORT SUITE  On-Going Support  Access to ALL TABS LCA Reports +  Strategy development/presentation by TABS Shopper Consultant CONSULTING  UPDATED: QUARTERLY REPORT SUITE  Training on CVS ExtraCare/TABS LCA Reports  On-Going Support  Access to ALL TABS LCA Reports ONLY  UPDATED: QUARTERLY 17
  • 18.
    TABS LCA™ –Custom Analytics Pricing will be scoped out on a per project basis  Data Integration – Syndicated Consumer/POS/PROFIT Data  New Product – Weekly Trial & Repeat Monitoring/Benchmarking  Assortment/Pricing – SKU level purchase report  Store Segmentation - Development and Reporting  Shopper Segmentation – Development and Reporting  Daily Purchase Patterns – Single Day purchasing patterns  Regional/Ethnic – CVS Ad Region/Custom Ethnic geography reporting 18