1. Use Cases
Create Report
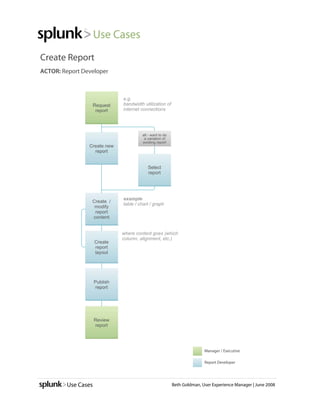
ACTOR: Report Developer
e.g.
Request bandwidth utilization of
report internet connections
alt - want to do
a variation of
existing report
Create new
report
Select
report
example
Create /
table / chart / graph
modify
report
content
where content goes (which
column, alignment, etc.)
Create
report
layout
Publish
report
Review
report
Manager / Executive
Report Developer
Use Cases Beth Goldman, User Experience Manager | June 2008
2. Use Cases
Create Report | CREATE REPORT CONTENT
Find data /
specify
data set
Identify what Identify what
alt - chose
the content existing report you're trying
OR OR
should look e.g. bar chart showing # template e.g. trend over time, or top level to show with
like users / host distribution, or comparison the content
Map fields to alt - just want Identify
raw results /
axes tabular data fields
Select
Format label option to
and chart show raw
graphics/ results
colors
Done
Report Developer
Use Cases Beth Goldman, User Experience Manager | June 2008
3. Use Cases
Create Report Content | MAP FIELDS
Map field to
x-axis
format time alt - x-axis is alt - x-axis
axis categorical (e.g. field is alt - table
SCALE: limit time top referrer) continuous
(time-based range to where
binning option, data exists OR
scale show more time.
format data (#
to show, ,sorting
Select format data
options (e.g. binning (row sort
frequency), options order)
groupings)
Map field(s) alt - want more info alt - want to split y- alt - want
to Y-axis than just count on
y-axis + field is
axis by another
field (e.g. stacked scatterplot /
numeric bar) multi-values
Specify Select Specify what
function(s) another values to
avg, min, field for display
max, sum split (TBD)
Specify
function
avg, min,
max, sum
- # values to display (sum time vs.
Select series max time OR select specific
policy values), how to aggregate "other",
what to do with null values
(suppress?)
Review
content
Format label alt - Too many
values on x or y
and chart axis or z (split
graphics/ by)
colors
alt - scatter
alt - table
plot chart
Set additional Set additional Refine # Remove
properties properties values specific
column size, row + / OR
(color, size, height, labels, displayed on values
shape) etc. x or y-axis (outliers)
Report Developer
Use Cases Beth Goldman, User Experience Manager | June 2008
4. Use Cases
Create Report Content | FIND/SPECIFY DATA
what about
ACTOR: Report Developer users?
Identify
and search
alt - select
for key field
OR existing data
value(s) - set
to detail
(slicing)
modify search
Select
based on source
existing new search OR
Ensure exception - data set saved search OR
name / ID exception -
data that e.g. net flows data source data (e.g.ss) saved search +
I'm looking changes
not there incomplete
for is there
and
complete
Request to based on
add data TBD expected volume,
source sanity checks
Ensure 1:1
correspond (filter out
ence irrelevant and
between group and name
dup data (status
incidents code != 200
and events
Verify that
project by viewing it as a
data is in
summary table, chart
results
graph, etc. when building,
(e,g. bytes
if I can't find... - exception
trans.)
exception -
Ensure data not
data is interpreted
correctly / fully
reportable /
available
as a field
limitation of splunk
Request to
add data
exception -
data fields
not there
Request to also could modify search
add data to extract addn'l fields
field
Report Developer
Use Cases Beth Goldman, User Experience Manager | June 2008
5. Use Cases
Create Report | CREATE REPORT LAYOUT
ACTOR: Report Developer
Position Create Create
report + report + report
content header footer
UPDATE
Review
Report
Report Developer
Use Cases Beth Goldman, User Experience Manager | June 2008
6. Use Cases
Create Report | PUBLISH REPORT
ACTOR: Report Developer
Identify
report
reviewers
alt - want to make alt - decide to alt - save
report available for save entire (dynamic
users to run/view at AND / OR report for re-use timeframe /
any time
Send with other data values)
report
Schedule Create
Add report to save/
report for unique
relevant sched////
recurring dashboard(s) template
TBD
delivery name
Save
template
(format &
Notify users
about new content)
report
Report Developer
Use Cases Beth Goldman, User Experience Manager | June 2008
7. Use Cases
Review Report
ACTOR: Manager / Executive
Receive
notification
that report
is available
Open /
view report
Review
data
alt - identify alt - identify
business problem with
issue report
alt - drill-down Ask report
Follow up with to get more developer to
relevant info? fix / update
employees to
report content
investigate
and/or
and resolve
tempalte
Close
report
Manager / Executive
Use Cases Beth Goldman, User Experience Manager | June 2008
8. Use Cases
Create Report | CREATE REPORT CONTENT
Find data /
specify
data set
Identify what Identify what
alt - chose
the content existing report you're trying
OR OR
should look e.g. bar chart showing # template e.g. trend over time, or top level to show with
like users / host distribution, or comparison the content
Map fields to alt - just want Identify
raw results /
axes tabular data fields
Select
Format label option to
and chart show raw
graphics/ results
colors
Done
Report Developer
Use Cases Beth Goldman, User Experience Manager | June 2008