1. Quantitative data collection methods like tests and surveys are commonly used to collect numerical data for research. Sample selection affects the timing, costs, and arrangements of a research project.
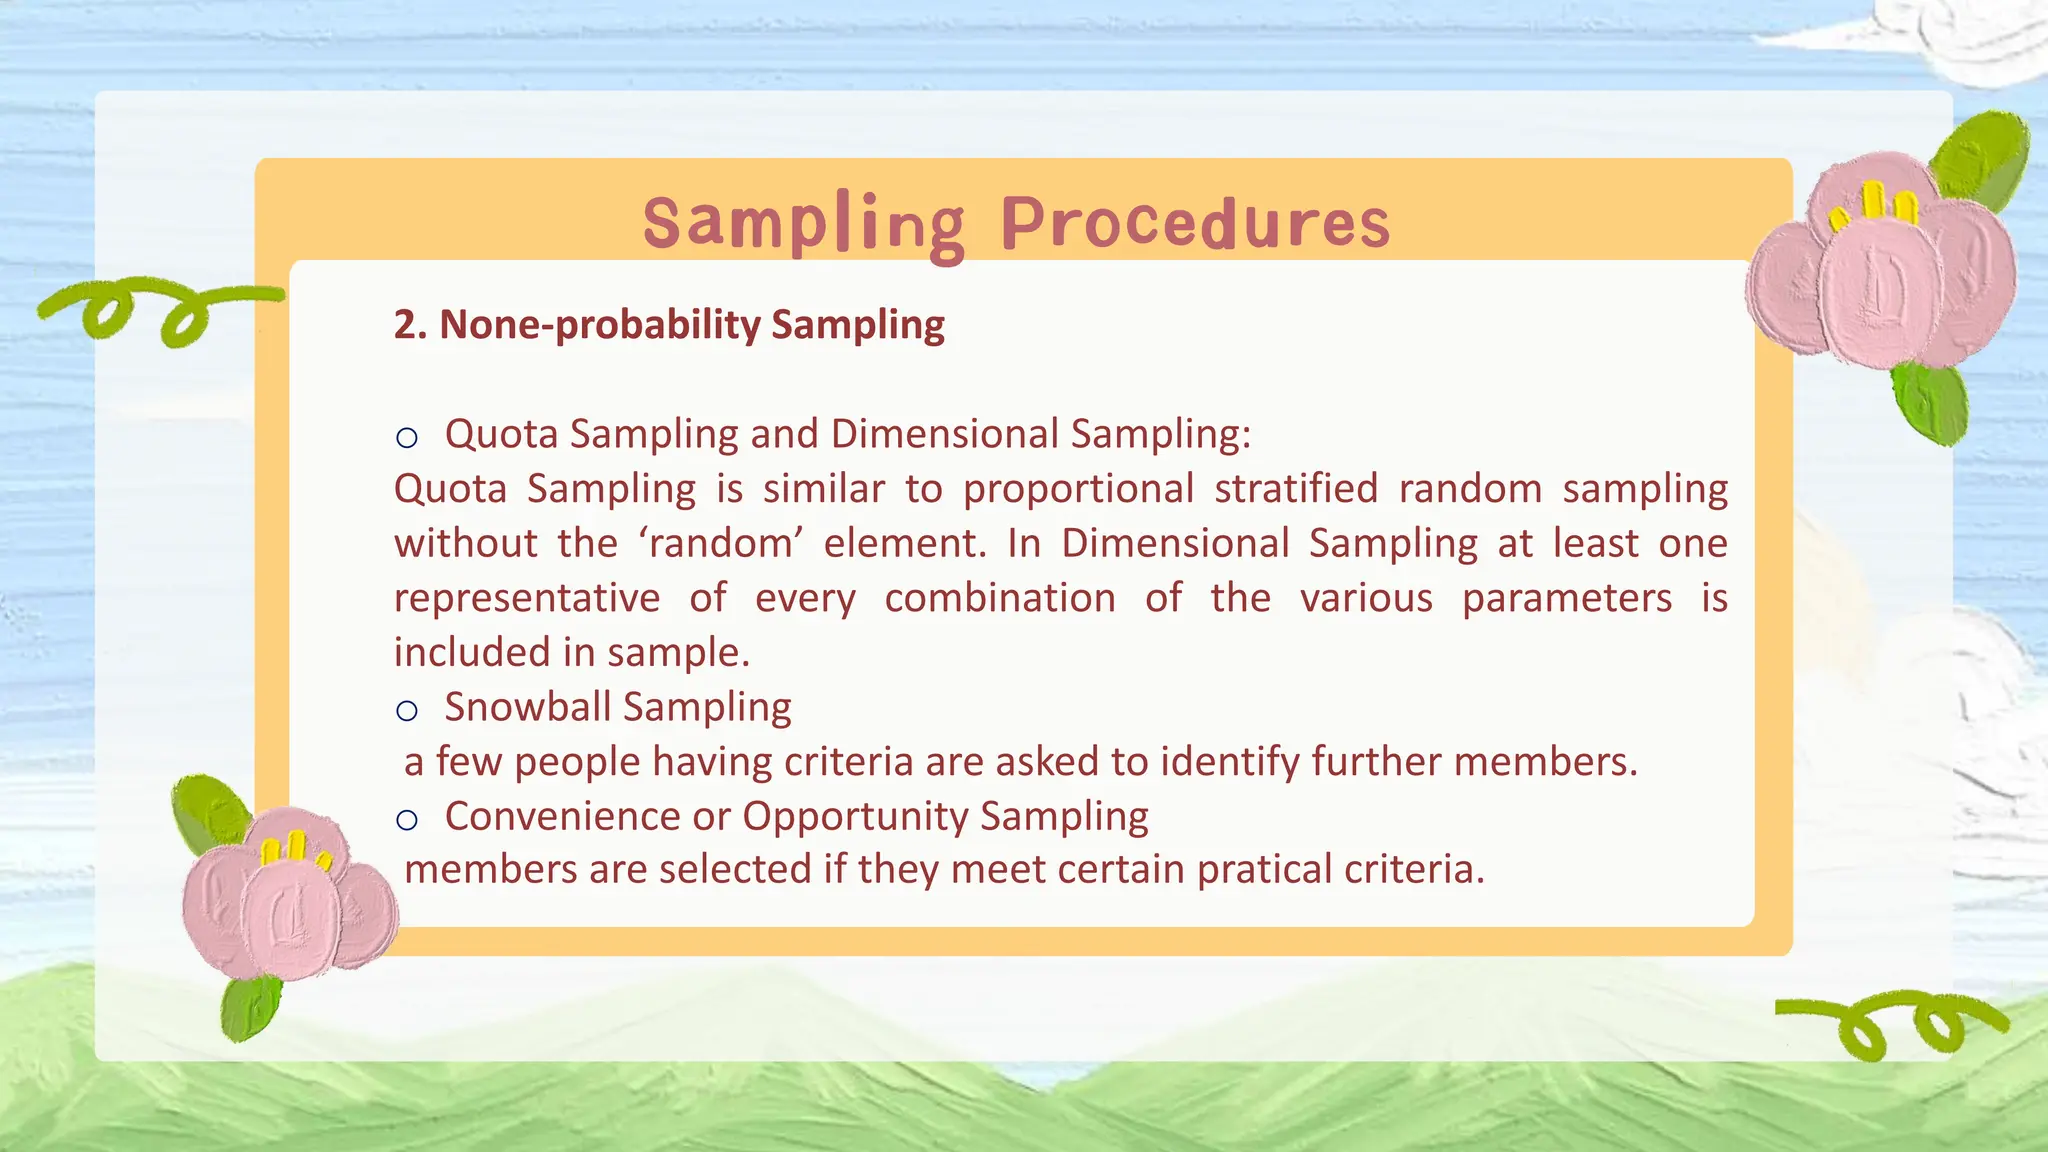
2. There are two main types of sampling - probability sampling which uses random selection, and non-probability sampling which does not. The sample size should be large enough to represent the overall population.
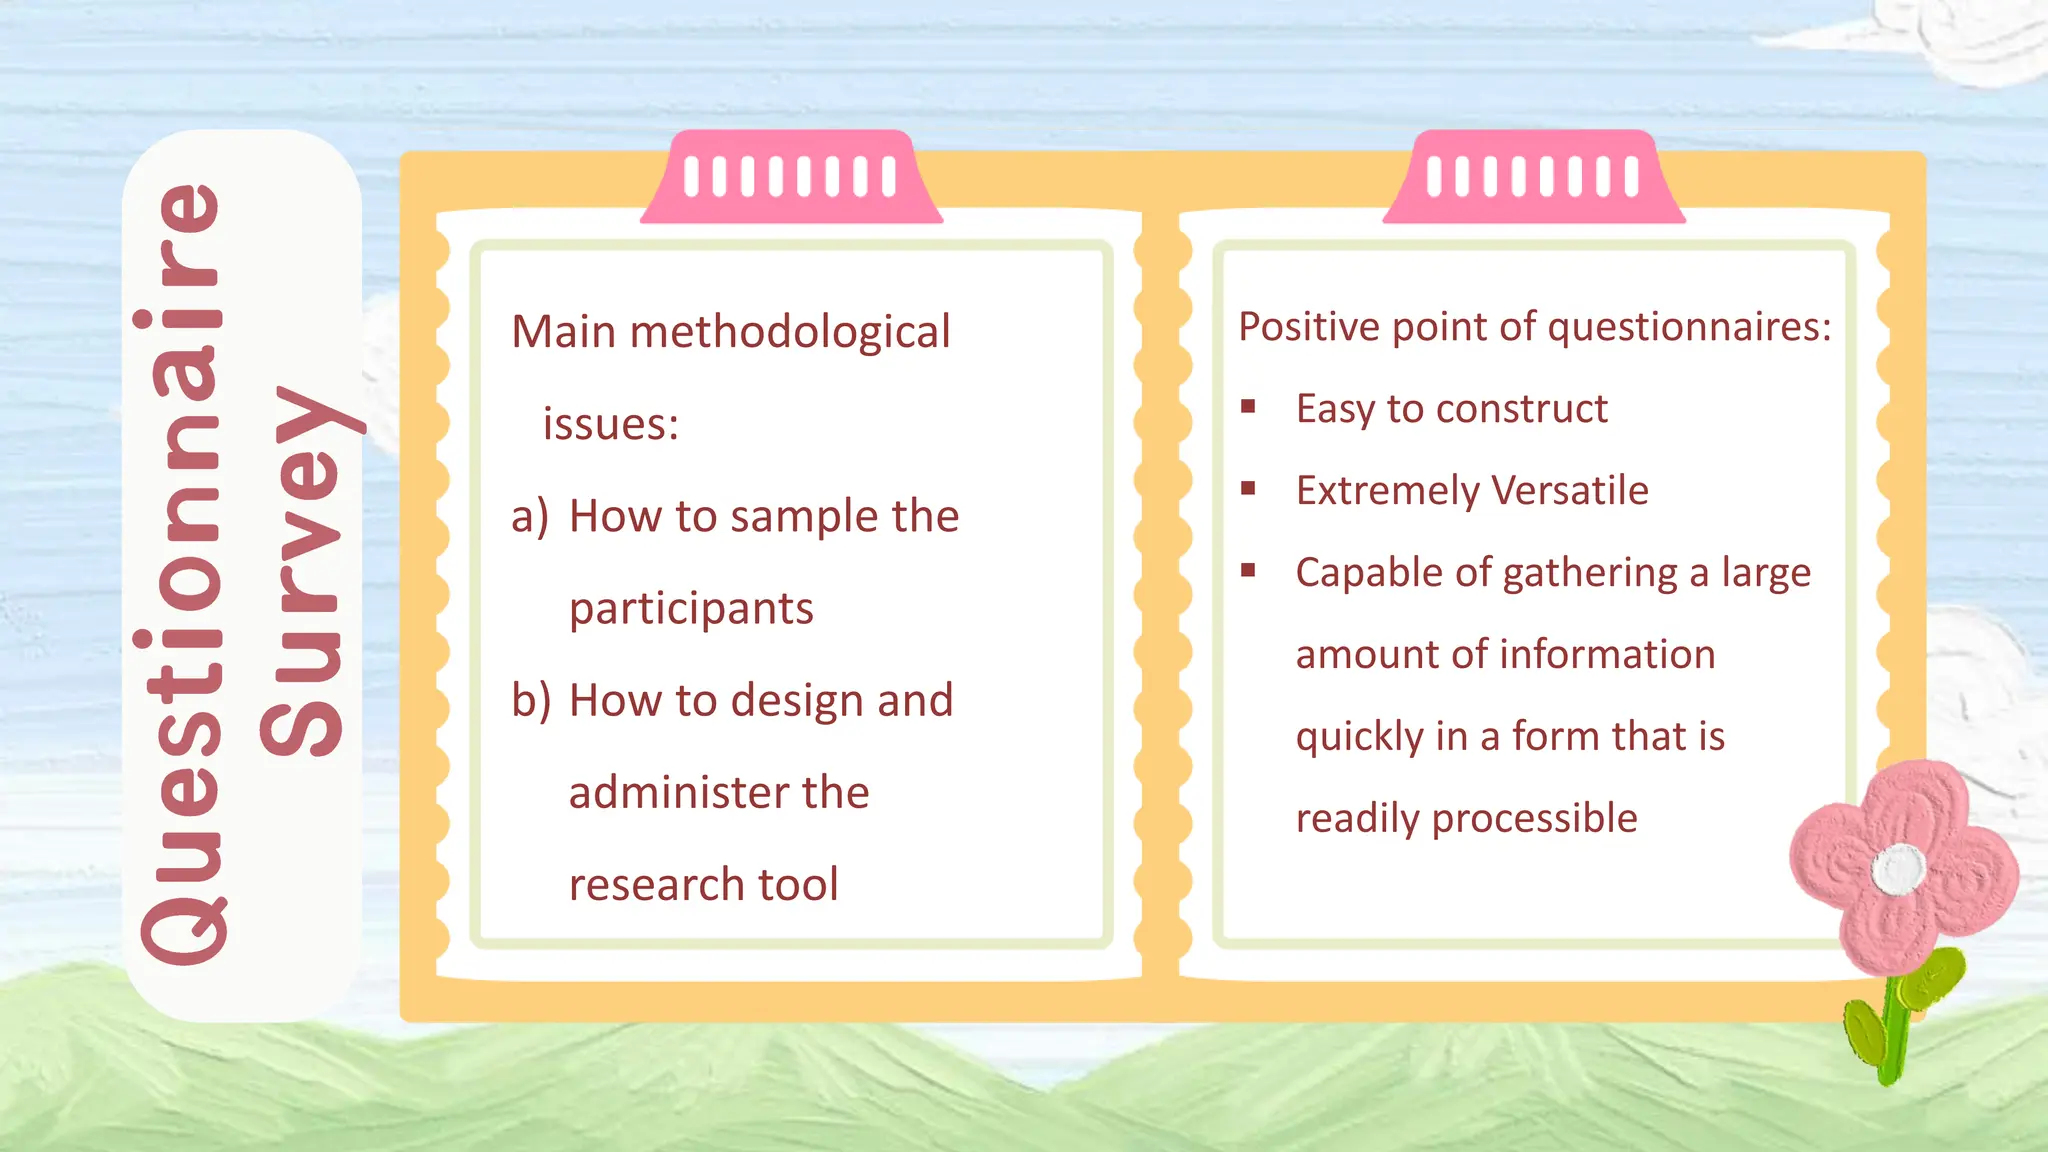
3. Quantitative data collection has benefits like being low-cost and convenient but also limitations such as unreliable data and superficial results. Experimental and quasi-experimental designs can help establish cause-and-effect but have weaknesses in external and internal validity.