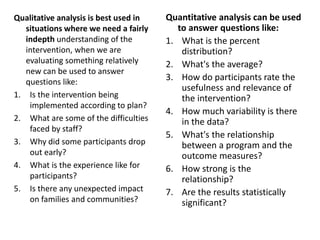
Analyzing Qualitative Data
Process
• Qualitative data analysis is used for any non-
numerical data collected as part of the
evaluation.
• Unstructured observations, open-ended
interviews, analysis of written documents, and
focus groups transcripts all require the use of
qualitative techniques.
• Analyzing qualitative data is challenging,
although many people find it interesting.
Great care has to be taken in accurately
capturing and interpreting qualitative data.
Qualitative analysis is best used in
situations where we need a fairly
indepth understanding of the
intervention, when we are
evaluating something relatively
new can be used to answer
questions like:
1. Is the intervention being
implemented according to plan?
2. What are some of the difficulties
faced by staff?
3. Why did some participants drop
out early?
4. What is the experience like for
participants?
5. Is there any unexpected impact
on families and communities?
Quantitative analysis can be used
to answer questions like:
1. What is the percent
distribution?
2. What's the average?
3. How do participants rate the
usefulness and relevance of
the intervention?
4. How much variability is there
in the data?
5. What's the relationship
between a program and the
outcome measures?
6. How strong is the
relationship?
7. Are the results statistically
significant?
Making Good Notes
• When you collect qualitative data, you want to capture as much
information as possible.
• It is important to accurately capture your observations; good notes are
essential.
• This means paying close attention to language: what people say and how
they say it. Try not to interpret what they say as you write your notes.
• Write down anything thing you observed, any body language, or anything
that happened while you were collecting data (for example, many
interruptions during the interview).
• You may also want to capture your immediate thoughts, reactions and
interpretations. Keep them in a separate section of your notes.
• It is extremely important to leave time soon after an interview,
observation, or focus group to review your preliminary notes and make
additions, and write up your notes so they will make sense when you look
at them later on. It is surprising how difficult it is to make sense of notes
taken in an interview, focus group, or observation session – even from just
a few days earlier.
• Even if you have tape-recorded the session, a small amount of time
invested in a preliminary write-up while it is fresh in your mind will save
hours and hours of listening to or watching tapes or poring over
transcripts later on.
• When conducting a content analysis, for example,
researcher review documents and code them in
terms of themes. The coders must be trained.
• Having two people read and code the same set of
documents helps better control for individual
differences in perceptions.
• If your evaluators are well trained and the
operational definitions and rating systems are
clear and agreed upon in advance, both evaluators
would have a high rate of agreement in their
ratings of the material.
• The jargon term is “inter-rater reliability” and a
high rate would be an indicator of credibility.
Drawing Out Themes and Patterns
• When analyzing qualitative data, your goal is to summarize what you
have seen or heard in terms of common words, phrases, themes or
patterns.
• As you review the material, you will begin to make notes. It helps to
read a few to get a sense of what is there and develop a general
framework for analyzing the rest of the data.
• However, you may discover other themes as you go along and may
have to re-read earlier material.
• As you identify the words, issues, themes or patterns, identify where
they are located so you can find them again if you need to verify
exact quotes or context.
• This will be very tedious the first time you do it; as you gain
experience you will find you can locate potentially important
information much more quickly.
• Some people find it helpful to use a spreadsheet that identifies the
common themes and where they are located in their notes.
• Other people use note cards to sort through the qualitative data.
Content Analysis
• Content analysis is a systematic approach to
qualitative data analysis that identifies and
summarizes message content.
• We usually use the term content analysis to refer to
the analysis of such things as books, brochures,
written documents, speeches, transcripts, news
reports, and visual media.
• A typical content analysis might be to examine the
content of children’s textbooks to see whether they
cover the necessary material for learning a
particular subject, presented in a way that is
reading level appropriate and fits the context in
which the children live and study.
• A deeper analysis might examine whether the
textbooks convey a specific political agenda or
biased interpretation of history.
• Sometimes content analysis is used to when
working with narratives such as diaries or
journals, or to analyze qualitative responses to
open-ended questions on surveys, interviews
or focus group
Summarizing Qualitative Data
• Generally, you will report your qualitative data in terms
of "common themes“ or "a number of people said…"
Sometimes there is an isolated idea or perspective that
you may want to highlight even though it is not a
common theme.
• There is no rulebook here since the analysis is very much
embedded in the particular situation.
• Sometimes it is useful to count the incidence of specific
themes to give some sense of how prevalent a particular
line of thought is among respondents.
• For example, you might want to specify that X number of
the news stories had a liberal bias as compared to Y
number that had a conservative bias.
• If you are using a mixed method (qualitative
and quantitative) data collection approach,
you will want to find themes and comments
that help clarify and illuminate some of the
qualitative data.
• For example, if 55% of the respondents were
dissatisfied with the accessibility of the
intervention, it helps to have a representative
mix of comments that help illustrate what
kinds of problems people were experiencing.
• You will want to capture some of the "quotable
quotes."
• These are the actual statements of the participants and
are chosen because they clearly present a theme or an
important point you want to emphasize.
• There is power with these words, so select them
carefully.
• You may find that your audience will be more likely to
remember a quote than a page of description.
• Be careful that you do not introduce bias here. You may
want to present several different quotes that show the
range of issues and perspectives about the same
theme.
• One example
– The experiences of male doctors regarding female patient
Experiences of RH service providers while
dealing with women patients/clients
Men service provider’s experiences
• Women patients feel very shy to tell clinical
symptoms of STI and do not allow genital
examination. Mostly, they promise to come
next time but never come for follow up.
Sometimes I have to take help from nursing
staffs for the genital examination of women.
(Dermatologist Dang )
• I face difficulty in exploring the health
symptoms of women client in comparison to
men. Most of the women feel shy to tell their
health problems and do not permit pelvic
examination easily.
(Gynecologist, WRH Pokhara)
• Women are very shy and are not open in
expressing their problems. They mostly visit
hospital after long duration of illness.
(Medical officer Dhankuta)
The women patients mostly need somebody to
present their clinical complaints. Sometimes
their husband or mother in law helps them to
express their problems.
Men are more expressive and demanding to
understand all the process and result of health
care in comparison to women patients. In
rural setting, women are the majority service
users and in urban areas, men are more in
comparison with women patients. This could
be the result of distance and the cost of
service.
(Senior Medical Officer, MDGP, Dang).
Controlling for Bias
There is some risk of bias in working with qualitative
data in particular;
• We often see what we want to see and genuinely
miss things that don't conform to our expectations.
• It helps (but does not always completely remedy) to
have another person analyze the data. By comparing
the two analyses, new themes or different ways of
understanding the data may emerge.
• When reporting qualitative data, you will not be able
to present a count of how many or what percent said
or did something.
• Since all were not asked the same question, you
really don't know how everyone felt about that
question.
• When conducting a content analysis, for example,
researcher review documents and code them in
terms of themes. The coders must be trained.
• Having two people read and code the same set of
documents helps better control for individual
differences in perceptions.
• If your evaluators are well trained and the
operational definitions and rating systems are
clear and agreed upon in advance, both
evaluators would have a high rate of agreement
in their ratings of the material.
• The jargon term is “inter-rater reliability” and a
high rate would be an indicator of credibility.
Concluding Thoughts on Qualitative Data Analysis
• Many of us have spent much of our lives being somewhat phobic
about statistics.
• As a consequence, there is a strong tendency to think that the use of
qualitative methods is somehow the easy option.
• there is a lot more to doing good qualitative data analysis than meets
the eye of the casual observer.
• Analyzing qualitative data is very labor intensive and time
consuming, but can reveal some of your most valuable information.
• Be sure to plan enough time to do this well.
• Qualitative methods can be powerful tools for looking at causality –
whether observed changes are due to the intervention or to
something else.
An excellent resource with step-by-step guides for how to do systematic
qualitative data analysis (descriptive, causal, and other) is Miles and
Huberman’s book, Qualitative data analysis: An expanded
sourcebook.
Common Mistakes in Interpreting Quantitative Data
1. A survey asked people to report their perceptions and 80% said it was helpful. Which would be the
better way to report the findings:
• a. ____"The program is helpful"
• b. ____"The participants found the program helpful."
2. The respondents were asked to identify the barriers and supports to the program.
• What is the problem with reporting the results in terms of "pros" and "cons"?
3. A survey asked students to rate various components of the course and most rated each of the
components positively. What is the problem of writing that “most (70%) of the students felt the
course was a success”?
4. 40% of the women and 30% of the men favored curriculum changes. Is it accurate to report the
findings as: “a majority of women favored curriculum changes”?
5. 51% favored changing the curriculum. Is it accurate to say "more than half of the respondents
said…”?
6. The survey was completed by 5 of the 20 instructors. All five agreed that they were well prepared.
Is it accurate to say, "All of the instructors were well-prepared”?
7. In the same survey, is it accurate to report "Eighty percent of the participants said the materials
were organized”?
8. Is it accurate to report a 100% n increase of women in political office when the actual number
increased from 2 to 4, out of 50 elected positions?
9. A training program found that those who participated in the program earned 20% more than those
not in the program.
Is it accurate to report, “The program caused a 20% increase in salary”?

Analyzing Qualitative Data for_ Research

  • 1.
  • 2.
    • Qualitative dataanalysis is used for any non- numerical data collected as part of the evaluation. • Unstructured observations, open-ended interviews, analysis of written documents, and focus groups transcripts all require the use of qualitative techniques. • Analyzing qualitative data is challenging, although many people find it interesting. Great care has to be taken in accurately capturing and interpreting qualitative data.
  • 3.
    Qualitative analysis isbest used in situations where we need a fairly indepth understanding of the intervention, when we are evaluating something relatively new can be used to answer questions like: 1. Is the intervention being implemented according to plan? 2. What are some of the difficulties faced by staff? 3. Why did some participants drop out early? 4. What is the experience like for participants? 5. Is there any unexpected impact on families and communities? Quantitative analysis can be used to answer questions like: 1. What is the percent distribution? 2. What's the average? 3. How do participants rate the usefulness and relevance of the intervention? 4. How much variability is there in the data? 5. What's the relationship between a program and the outcome measures? 6. How strong is the relationship? 7. Are the results statistically significant?
  • 4.
    Making Good Notes •When you collect qualitative data, you want to capture as much information as possible. • It is important to accurately capture your observations; good notes are essential. • This means paying close attention to language: what people say and how they say it. Try not to interpret what they say as you write your notes. • Write down anything thing you observed, any body language, or anything that happened while you were collecting data (for example, many interruptions during the interview). • You may also want to capture your immediate thoughts, reactions and interpretations. Keep them in a separate section of your notes. • It is extremely important to leave time soon after an interview, observation, or focus group to review your preliminary notes and make additions, and write up your notes so they will make sense when you look at them later on. It is surprising how difficult it is to make sense of notes taken in an interview, focus group, or observation session – even from just a few days earlier. • Even if you have tape-recorded the session, a small amount of time invested in a preliminary write-up while it is fresh in your mind will save hours and hours of listening to or watching tapes or poring over transcripts later on.
  • 5.
    • When conductinga content analysis, for example, researcher review documents and code them in terms of themes. The coders must be trained. • Having two people read and code the same set of documents helps better control for individual differences in perceptions. • If your evaluators are well trained and the operational definitions and rating systems are clear and agreed upon in advance, both evaluators would have a high rate of agreement in their ratings of the material. • The jargon term is “inter-rater reliability” and a high rate would be an indicator of credibility.
  • 6.
    Drawing Out Themesand Patterns • When analyzing qualitative data, your goal is to summarize what you have seen or heard in terms of common words, phrases, themes or patterns. • As you review the material, you will begin to make notes. It helps to read a few to get a sense of what is there and develop a general framework for analyzing the rest of the data. • However, you may discover other themes as you go along and may have to re-read earlier material. • As you identify the words, issues, themes or patterns, identify where they are located so you can find them again if you need to verify exact quotes or context. • This will be very tedious the first time you do it; as you gain experience you will find you can locate potentially important information much more quickly. • Some people find it helpful to use a spreadsheet that identifies the common themes and where they are located in their notes. • Other people use note cards to sort through the qualitative data.
  • 7.
    Content Analysis • Contentanalysis is a systematic approach to qualitative data analysis that identifies and summarizes message content. • We usually use the term content analysis to refer to the analysis of such things as books, brochures, written documents, speeches, transcripts, news reports, and visual media. • A typical content analysis might be to examine the content of children’s textbooks to see whether they cover the necessary material for learning a particular subject, presented in a way that is reading level appropriate and fits the context in which the children live and study.
  • 8.
    • A deeperanalysis might examine whether the textbooks convey a specific political agenda or biased interpretation of history. • Sometimes content analysis is used to when working with narratives such as diaries or journals, or to analyze qualitative responses to open-ended questions on surveys, interviews or focus group
  • 9.
    Summarizing Qualitative Data •Generally, you will report your qualitative data in terms of "common themes“ or "a number of people said…" Sometimes there is an isolated idea or perspective that you may want to highlight even though it is not a common theme. • There is no rulebook here since the analysis is very much embedded in the particular situation. • Sometimes it is useful to count the incidence of specific themes to give some sense of how prevalent a particular line of thought is among respondents. • For example, you might want to specify that X number of the news stories had a liberal bias as compared to Y number that had a conservative bias.
  • 10.
    • If youare using a mixed method (qualitative and quantitative) data collection approach, you will want to find themes and comments that help clarify and illuminate some of the qualitative data. • For example, if 55% of the respondents were dissatisfied with the accessibility of the intervention, it helps to have a representative mix of comments that help illustrate what kinds of problems people were experiencing.
  • 11.
    • You willwant to capture some of the "quotable quotes." • These are the actual statements of the participants and are chosen because they clearly present a theme or an important point you want to emphasize. • There is power with these words, so select them carefully. • You may find that your audience will be more likely to remember a quote than a page of description. • Be careful that you do not introduce bias here. You may want to present several different quotes that show the range of issues and perspectives about the same theme. • One example – The experiences of male doctors regarding female patient
  • 12.
    Experiences of RHservice providers while dealing with women patients/clients Men service provider’s experiences • Women patients feel very shy to tell clinical symptoms of STI and do not allow genital examination. Mostly, they promise to come next time but never come for follow up. Sometimes I have to take help from nursing staffs for the genital examination of women. (Dermatologist Dang )
  • 13.
    • I facedifficulty in exploring the health symptoms of women client in comparison to men. Most of the women feel shy to tell their health problems and do not permit pelvic examination easily. (Gynecologist, WRH Pokhara) • Women are very shy and are not open in expressing their problems. They mostly visit hospital after long duration of illness. (Medical officer Dhankuta)
  • 14.
    The women patientsmostly need somebody to present their clinical complaints. Sometimes their husband or mother in law helps them to express their problems. Men are more expressive and demanding to understand all the process and result of health care in comparison to women patients. In rural setting, women are the majority service users and in urban areas, men are more in comparison with women patients. This could be the result of distance and the cost of service. (Senior Medical Officer, MDGP, Dang).
  • 15.
    Controlling for Bias Thereis some risk of bias in working with qualitative data in particular; • We often see what we want to see and genuinely miss things that don't conform to our expectations. • It helps (but does not always completely remedy) to have another person analyze the data. By comparing the two analyses, new themes or different ways of understanding the data may emerge. • When reporting qualitative data, you will not be able to present a count of how many or what percent said or did something. • Since all were not asked the same question, you really don't know how everyone felt about that question.
  • 16.
    • When conductinga content analysis, for example, researcher review documents and code them in terms of themes. The coders must be trained. • Having two people read and code the same set of documents helps better control for individual differences in perceptions. • If your evaluators are well trained and the operational definitions and rating systems are clear and agreed upon in advance, both evaluators would have a high rate of agreement in their ratings of the material. • The jargon term is “inter-rater reliability” and a high rate would be an indicator of credibility.
  • 17.
    Concluding Thoughts onQualitative Data Analysis • Many of us have spent much of our lives being somewhat phobic about statistics. • As a consequence, there is a strong tendency to think that the use of qualitative methods is somehow the easy option. • there is a lot more to doing good qualitative data analysis than meets the eye of the casual observer. • Analyzing qualitative data is very labor intensive and time consuming, but can reveal some of your most valuable information. • Be sure to plan enough time to do this well. • Qualitative methods can be powerful tools for looking at causality – whether observed changes are due to the intervention or to something else. An excellent resource with step-by-step guides for how to do systematic qualitative data analysis (descriptive, causal, and other) is Miles and Huberman’s book, Qualitative data analysis: An expanded sourcebook.
  • 18.
    Common Mistakes inInterpreting Quantitative Data 1. A survey asked people to report their perceptions and 80% said it was helpful. Which would be the better way to report the findings: • a. ____"The program is helpful" • b. ____"The participants found the program helpful." 2. The respondents were asked to identify the barriers and supports to the program. • What is the problem with reporting the results in terms of "pros" and "cons"? 3. A survey asked students to rate various components of the course and most rated each of the components positively. What is the problem of writing that “most (70%) of the students felt the course was a success”? 4. 40% of the women and 30% of the men favored curriculum changes. Is it accurate to report the findings as: “a majority of women favored curriculum changes”? 5. 51% favored changing the curriculum. Is it accurate to say "more than half of the respondents said…”? 6. The survey was completed by 5 of the 20 instructors. All five agreed that they were well prepared. Is it accurate to say, "All of the instructors were well-prepared”? 7. In the same survey, is it accurate to report "Eighty percent of the participants said the materials were organized”? 8. Is it accurate to report a 100% n increase of women in political office when the actual number increased from 2 to 4, out of 50 elected positions? 9. A training program found that those who participated in the program earned 20% more than those not in the program. Is it accurate to report, “The program caused a 20% increase in salary”?